Abstract
Cisplatin chemotherapy often causes permanent hearing loss, which leads to a multifaceted decrease in quality of life. Identification of early cisplatin-induced cochlear damage would greatly improve clinical diagnosis and provide potential drug targets to prevent cisplatin’s ototoxicity. With improved functional and immunocytochemical assays, a recent seminal discovery revealed that synaptic loss between inner hair cells and spiral ganglion neurons is a major form of early cochlear damage induced by noise exposure or aging. This breakthrough discovery prompted the current study to determine early functional, cellular, and molecular changes for cisplatin-induced hearing loss, in part to determine if synapse injury is caused by cisplatin exposure. Cisplatin was delivered in one to three treatment cycles to both male and female mice. After the cisplatin treatment of three cycles, threshold shift was observed across frequencies tested like previous studies. After the treatment of two cycles, beside loss of outer hair cells and an increase in high-frequency hearing thresholds, a significant latency delay of auditory brainstem response wave 1 was observed, including at a frequency region where there were no changes in hearing thresholds. The wave 1 latency delay was detected as early cisplatin-induced ototoxicity after only one cycle of treatment, in which no significant threshold shift was found. In the same mice, mitochondrial loss in the base of the cochlea and declining mitochondrial morphometric health were observed. Thus, we have identified early spiral ganglion-associated functional and cellular changes after cisplatin treatment that precede significant threshold shift.
Keywords: cisplatin, ototoxicity, hair cells, spiral ganglion neuron, Schwann cell
INTRODUCTION
Platinum-based antineoplastic agents, including cisplatin, are widely used against a variety of malignancies and are among the most ototoxic compounds. In addition, they carry the potential for other serious effects, such as nephrotoxicity and neurotoxicity (Francis and Cunningham 2017; Rybak et al. 2019; Sheth et al. 2017). The incidence of cisplatin’s ototoxicity varies between reports, dosing schedules, measurement/definition of significant hearing loss, and patient populations, but rates as high as 90 % have been reported (Hayes et al. 1977; Reddel et al. 1982). Cisplatin causes a dose-dependent progressive permanent, bilateral hearing loss that begins in the high frequencies and spreads to the middle audiometric frequencies (Madasu et al. 1997; van Zeijl et al. 1984) as the cumulative dose increases. Cisplatin-induced hearing loss can potentially become worse even years after completion of the therapy (Einarsson et al. 2010; Knight et al. 2005). The potentially long duration may be due to cisplatin retention in the cochlea’s stria vascularis, which can last indefinitely after treatment (Breglio et al. 2017).
Long-duration cisplatin treatment injures all cell populations in the organ of Corti, manifesting in both metabolic cell death and mechanical damage due to loss of the precise structural organization of the hair cells and supporting cells that comprise the organ (Cardinaal et al. 2000; Hinojosa et al. 1995). One of the primary pathways through which cisplatin damage causes hearing loss is through disruption of the cochlear amplifier, through injury to the outer hair cells (OHCs) (Laurell and Bagger-Sjöbäck 1991) and/or stria vascularis (Komune et al. 1981). Inner hair cells (IHCs) (Laurell and Bagger-Sjöbäck 1991) and spiral ganglion neurons (SGNs) (Böheim and Bichler 1985) are also potential targets of cisplatin-induced injury. Cisplatin is taken up by cells, creating structural abnormalities in DNA that are either repaired or trigger apoptosis signaling (Barry et al. 1990). Apoptosis has been detected in cochlear cells exposed to cisplatin (Ding et al. 2007). Cisplatin also injures cells through oxidative stress, both due to increases in ROS formation (Clerici et al. 1996; Dehne et al. 2001) and through depletion of antioxidants in the cochlea (Lautermann et al. 1997; Ravi et al. 1995).
In clinical studies, the reported prevalence of hearing loss varied considerably between 0 and 90.1 % for children and 10 to 100 % for adults (Brennan-Jones et al. 2019; Lee et al. 2016). Besides variations in age, cumulative dose, dose duration, genetics, and other co-treatments (Mukherjea and Rybak 2011), the sensitivity of current clinical detection methods for hearing loss contributes greatly to this variability (Waissbluth et al. 2017). Otoacoustic emissions testing is frequently deployed clinically for cisplatin ototoxicity monitoring due to the focus of cisplatin’s damage on the cochlear amplifier (McMillan et al. 2012; Stavroulaki et al. 2001). Ultra-high-frequency audiometry is also used for early detection of ototoxicity due to the progressive high-frequency nature of cisplatin-induced hearing loss (Abujamra et al. 2013; Reavis et al. 2008). The goal is detection of ototoxicity before it significantly impacts frequencies critical for speech perception. Because new anti-cancer drugs can also cause ototoxicity (Tang et al. 2015), identification of sensitive tests or markers for detecting early ototoxicity has broad implications for developing appropriate clinical interventions to minimize hearing loss. In addition to the cochlear amplifier as the primary target of cisplatin-induced cochlear injury, the IHC–SGN afferent pathway can also be disrupted by cisplatin, and an auditory brainstem response (ABR)–based metric for detecting early cisplatin ototoxicity, prior to the measurable threshold shift, was explored in the current study. ABR threshold and latency shifts have been used routinely to evaluate cisplatin ototoxicity in animal models (Church et al. 2004; Lynch et al. 2005), and high-frequency ABR threshold and latency data have been used to identify ototoxicity (Fausti et al. 1993). Further, ABR interpeak latency changes have been detected in cisplatin-exposed human patients (Hansen et al. 1989). Finally, ABR wave V latency changes after two cycles of cisplatin presaged later threshold shifts after additional cycles. This was only demonstrated in two patients (De Lauretis et al. 1999), but indicates a possible utility for supra-threshold ABR changes for detection of cisplatin ototoxicity before it has manifested as significant threshold shift.
Otoacoustic emissions and pure tone threshold audiometry are not highly sensitive to damage to the IHC–SGN afferent pathway (Kujawa and Liberman 2009; Lobarinas et al. 2013). The extent to which cisplatin can induce injury to the IHC–SGN synapses or the myelin of the auditory nerve axons is unknown. Either of these pathologies would manifest in reduction of function without necessitating loss of the hair cells. Synaptic loss between type I SGNs and IHCs is an early pathology from noise exposure or during aging (Liberman and Kujawa 2017). This synaptopathy has been detected through immunohistology and functional analysis of supra-threshold ABR compared with distortion product of otoacoustic emissions (DPOAEs). An intact IHC–auditory nerve pathway is critical for delivering the synchronized neural signaling necessary for understanding complex auditory signals, including speech. While synaptopathy injury is a documented consequence of noise exposure in animal models, evidence of synapse injury in cisplatin ototoxicity is not. Therefore, the ABR testing procedure combined with the multi-cycle cisplatin delivery protocol described below was also used to investigate the extent to which synaptopathy and/or supra-threshold ABR changes independent of loss of cochlear amplification occur in cisplatin ototoxicity.
The current study had two primary goals: (1) to determine if early pre-clinical cisplatin ototoxicity could be detected through changes in supra-threshold ABR recordings, and (2) to determine if cisplatin induces early targeted injuries to the IHC–SGN synapses or auditory nerve myelination. A mouse model of cisplatin ototoxicity was utilized (Breglio et al. 2017; Fernandez et al. 2019; Roy et al. 2013). Assessments of OHC loss, ABR and DPOAE threshold shifts, supra-threshold amplitudes and latencies of ABR wave 1, presynaptic ribbons between IHCs and SGNs, and integrity of mitochondria and myelin in the SGNs were used to monitor early and late cochlear damage after cisplatin exposure.
MATERIALS AND METHODS
Experimental Animals
Both male and female CBA/CaJ mice around 3 months old were obtained from the Jackson Laboratory (Bar Harbor, ME, USA) and were housed in a vivarium with a 12-h light–dark cycle for additional 1 month before the start of experiment at Northeast Ohio Medical University (NEOMED). Pellet chow and supplemental nutrition were provided to maintain acceptable body weight throughout the course of the study. The number of mice for the 4 × 1 study was 22; for the 4 × 2 study, 19; and for the 4 × 3 study, 19. All procedures were approved by the NEOMED Animal Care and Use Committee and were conducted in accordance with the National Institutes of Health guidelines.
Cisplatin Exposures
Each animal was exposed to 1–3 cycles of cisplatin treatment (4 × 1, 4 × 2, and 4 × 3) in which the cisplatin was given on four consecutive days followed by a 10-day rest period. Cisplatin (100 mg/ml; Sigma) was injected (i.p.) at 4 mg/kg each of the four consecutive days, for a cumulative dose of 16 mg/kg per cycle. The protocol was developed based on previous work (Fernandez et al. 2019; Roy et al. 2013) that used 3.5 and 4 mg/kg doses on the four consecutive day delivery schedule with the 10-day recovery period between doses. The dosage of 4 mg/kg was selected with the goal of creating a progressive threshold shift that was minimal after the first cycle but grew to a 40–60-dB threshold shift after the third cycle of dosing. Cisplatin was delivered consistently within a 2-h window of 6 to 8 h after light onset in order to present the cisplatin at the same point on the circadian cycle for each animal and administration (Bielefeld et al. 2018). Physiologic tests were run on the sixth day of the rest period after each treatment cycle. Animals were sacrificed on the 10th day of the rest period after the final cisplatin cycle. For the 4 × 1 treatment, the experiment concluded after a single round of the 16 mg/kg dosing. For the 4 × 2 treatment, two 14-day cycles were completed (32 mg/kg cumulative dose). For the 4 × 3 treatment, the experiment concluded after three cycles (cumulative dose of 48 mg/kg). The control groups were given injections of equivalent volumes of saline on the same schedule as the cisplatin injections. Due to the concern that lethargy and gastrointestinal distress from the cisplatin would suppress the mice’s drinking during the cisplatin exposure intervals, supplemental hydration was provided to all animals with sub-cutaneous saline injections (0.5 ml per animal) given daily from the first day of cisplatin administration through the end of the experiment.
Physiological Testing
All tests were performed in an acoustically and electrically shielded chamber with a Tucker Davis Technology (TDT) RZ6 processor and BioSigRZ software. Before each functional test, the animals were anesthetized with ketamine and xylazine (i.p., 80/15 mg/kg) and placed on a warming pad to maintain body temperature at 37 °C by an auto-temperature regulation feedback system (Harvard Apparatus). Similar to our previous published functional testing (Bao et al. 2003, 2004, 2005, 2013; Ohlemiller et al. 2000a, b), ABR thresholds were obtained in free soundfield. The tone bursts were presented at 5, 10, 20, 28, and 40 kHz from 90 dB SPL descending to 0 dB SPL or 10 dB below threshold in 5-dB decrements. Tone bursts were 5 ms in duration, 0.5 ms rise/fall, with a repetition rate of 20/s. Electrodes were placed subdermally behind the tested ear (reference electrode), the vertex (active electrode), and mid-back (ground electrode). The contralateral pinna was compressed with a spring-loaded clip to reduce contribution from the unstimulated ear. Responses were averaged over 512 repetitions. Threshold was defined as the lowest point at which a repeatable response could be detected. ABR wave 1 latencies and amplitudes were measured for both the control and cisplatin-treated groups at 10, 20, 28, and 40 kHz. Amplitudes were calculated as the peak-to-peak amplitude from the P1 peak to the following negative trough.
DPOAEs were measured using TDT System III hardware and EMAV software (Taveggia 2016). DPOAEs were elicited by two pure tones, F1 and F2, with an F2/F1 ratio of 1.2, and with the level of the f2 primary 10 dB less than f1 level, incremented together in 5-dB steps. The 2f1-f2 DPOAE amplitude was extracted, and then Iso-response contours were interpolated from plots of amplitude versus sound level. Threshold was defined as the f1 level required to produce a DPOAE of − 5 dB SPL. A modified Knowles miniature microphone (FG-23329-P07) and custom preamp were used to record responses, which were then displayed and stored on a laboratory computer.
Histological Preparation and Assessment
After the final functional testing, anesthetized mice were intra-cardially perfused with 4 % paraformaldehyde in 0.1 M phosphate buffer, followed by an additional intra-labyrinthine perfusion through the oval and round windows. Cochleae underwent an overnight post fixation in 4 % paraformaldehyde and subsequently were decalcified in 0.35 M EDTA (pH 7.0) up to 96 h at 4 °C. One cochlea was micro-dissected into three to six pieces, and a cochlear frequency map for 10, 20, 28, and 40 kHz was computed based on 3D reconstruction of these pieces (Muniak et al. 2013). Micro-dissected pieces were immunostained with antibodies to the following: (1) C-terminal binding protein 2 (mouse anti-CtBP2; BD Biosciences, used at 1:200) and (2) myosin-VIIa (rabbit anti-myosin-VIIa; Proteus Biosciences; used at 1:200) with appropriate secondary antibodies coupled to Alexa Fluors. DAPI was used for labeling nuclei after the incubation of secondary antibodies. Confocal z-stacks of the 10, 20, 28, and 40 kHz areas were collected using a Leica SP8 laser scanning confocal microscope. Images were collected in a 1024 × 1024 raster using a high-resolution, oil-immersion objective microscope (×80), where IHCs and OHCs at the specific frequency were quantified based on myosin-VIIa–stained cells and DAPI-labeled nuclei within a 100-μm viewing field. Presynaptic ribbons were counted based on 3D (x–y–z axis) representations of each confocal z-stack.
Electron Microscopy (EM) Histology
For animals from the 4 × 1, 4 × 2, and 4 × 3 experiments (both saline controls and cisplatin-treated), a small hole at the apex of the cochlear capsule was made on one cochlea from each animal, and complete exposure of the cochlea to the fixative was ensured by gently circulating the fixative over the cochlea using a transfer pipet. After decalcification in sodium EDTA, the cochleae were post-fixed in buffered 1 % osmium tetroxide, dehydrated in an ascending acetone series, and embedded in Epon. Ultrathin sections (100 nm, gold–silver interference color) were cut from each cochlea using an ultramicrotome (UC6 Ultramicrotome; Leica Microsystems, Buffalo Grove, IL, USA). When the osseous spiral lamina was reached (as determined by periodically mounting and staining the tissue with a 1 % solution of Toluidine Blue), every tenth section was collected until we were able to visualize turns of the cochlea with osseous spiral lamina axons perpendicular to the direction of sectioning resulting in cross-sectional views of the axons. Once we had achieved a satisfactory level of sectioning through the apical, middle, and basal turns, we collected 16 sections in two alternating series. Sections (series 1) viewed with transmission EM were collected onto 300-mesh nickel- or formvar-coated slot grids (Electron Microscopy Sciences (EMS), Hatfield, PA, USA); the second series was mounted onto a glass slide and stained with a solution of 1 % Toluidine Blue to image the cochlear turns and osseous spiral lamina with brightfield microscopy. To increase ultrastructural contrast, grids were washed in UranyLess (EMS catalog #22409) for 15 min and then washed in nanopure water and allowed to dry.
Ultrastructure was observed with a transmission electron microscope (TEM) (JEM-1400Plus; JEOL, Peabody, MA, USA) at 80 kV at ×20,000–×60,000 magnification. Images were taken with an Orius SC1000 side-mount digital camera and measurements were processed with GATAN Microscopy Suite Software (GATAN, Pleasanton, CA, USA). One of three testers, blind to the grid inserted the slides into the TEM, took electron micrographs of 50 myelinated axons, at cross-sections in each of the three cochlear turns in each of three animals across the four treatment groups. This yielded a total of 1800 axons (450 per treatment group) and 5557 mitochondria examined in the current study. Electron micrographs were measured with Gatan Microscopy Software Suite 3 (GATAN) for in-house analysis or ImageJ (Bethesda, MD, USA) for remote analysis. In each axon, we recorded the myelin thickness (maximum/minimum), inside diameters, number of dense lines, number of mitochondrial profiles, the morphometric health of each mitochondrial profile (1–5 scale; Coughlin et al. 2015), the cross-sectional surface area of each mitochondria, the presence of vacuoles, and pathology. Briefly, morphometric health of the mitochondria consisted of examining the ultrastructure of the cristae. A score of 5 reflected regular, intact cristae that were sharply defined, while a score of 1 reflected absent cristae with insults to the inner and outer membranes of the mitochondria. Scores of 4 through 2 reflected varying degrees of swollen and fragmented cristae (Coughlin et al. 2015). Adobe Photoshop was used to adjust brightness and contrast levels and to label photographs.
Experimental Design and Statistical Analysis
All mice (n = 60) were given an acclimation period after delivery before they began the experiment. The mice at 4 months old were randomly assigned to two groups (saline control group and cisplatin-treated group). Pre-treatment ABR and DPOAE testing were conducted 48 h prior to the first cisplatin administration. Post-treatment ABR and DPOAE testing were performed 6 days after cisplatin administration every cycle. Analyses of the ABR and DPOAE data were conducted with the Statistical Package for the Social Sciences (SPSS), version 23.0 (SPSS Inc., Chicago, IL, USA Chicago, IL) and GraphPad Prism 7 (GraphPad Software, San Diego, CA). Repeated measures and three-way analyses of variance (ANOVA) were used to analyze ABR and DPOAE amplitudes and latencies. Two-way ANOVAs with Bonferroni’s multiple comparisons tests were used to evaluate ABR and DPOAE threshold shift, as well as the hair cell and synapse counts.
EM data were analyzed using linear mixed-effects models. Mixed-effects models allow for a hybrid of repeated measures analysis (i.e., “within-subject” variables), model I ANOVA fixed factor analysis (i.e., “between-subject” variables), and model II ANOVA random factor analysis (i.e., variance components), in the same gestalt statistical test. In the present study, treatment was specified as a between-subjects fixed factor across individual mice. Individual mice were specified as between-group random factors, and axons quantified per cochlear turn from each mouse were specified as within-subjects fixed factors within individual mice. Individual mouse number was specified as a random factor. In addition, the interaction between axon diameter and treatment was specified as a fixed effect. Satterthwaite method was used to calculate the effective degrees of freedom. Marginal means used in the two-way ANOVA determined the direction of results. EM statistical tests were performed in R (version 3.5.2 for Windows; R Core Team 2019), supplemented by the add-on packages lme4 and lmerTest. Significance was assumed at a p value of 0.05 in all statistical analyses unless the Bonferroni correction dictated a lower value.
RESULTS
Cisplatin-Induced Cochlear Damage after the 4 × 1 Cycle
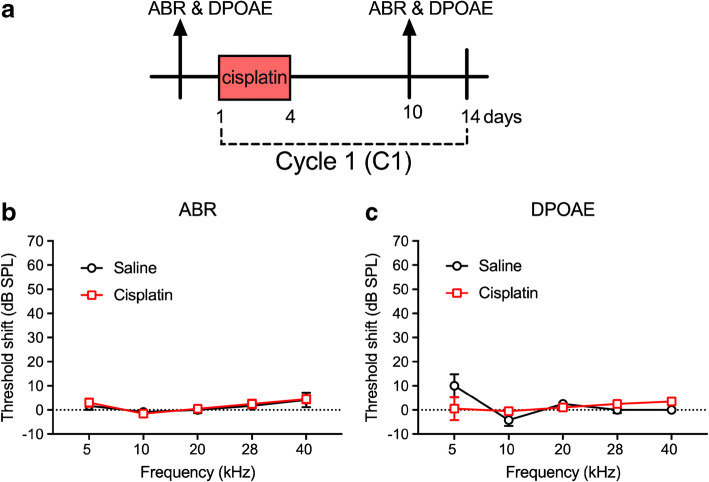
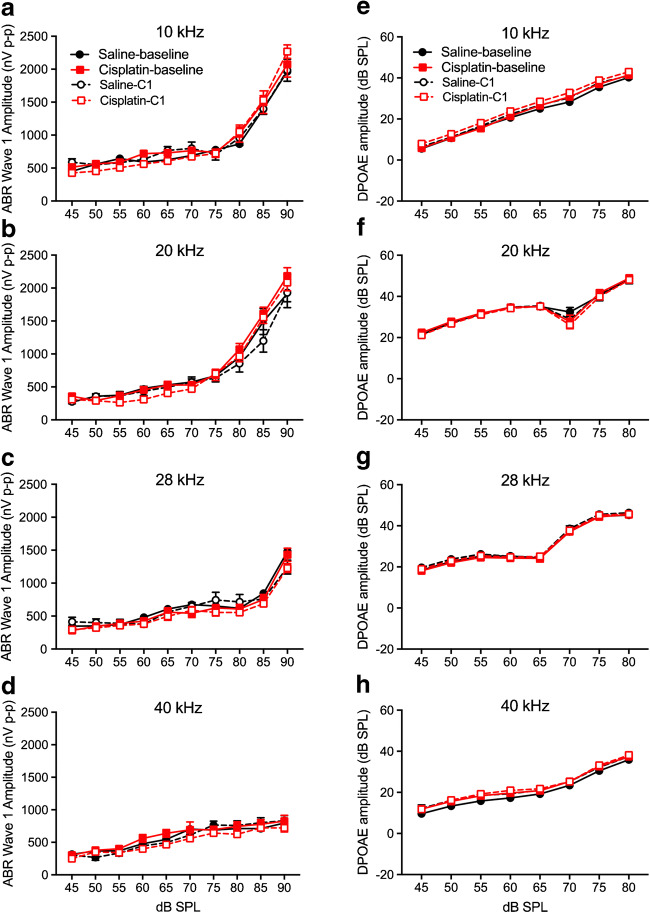
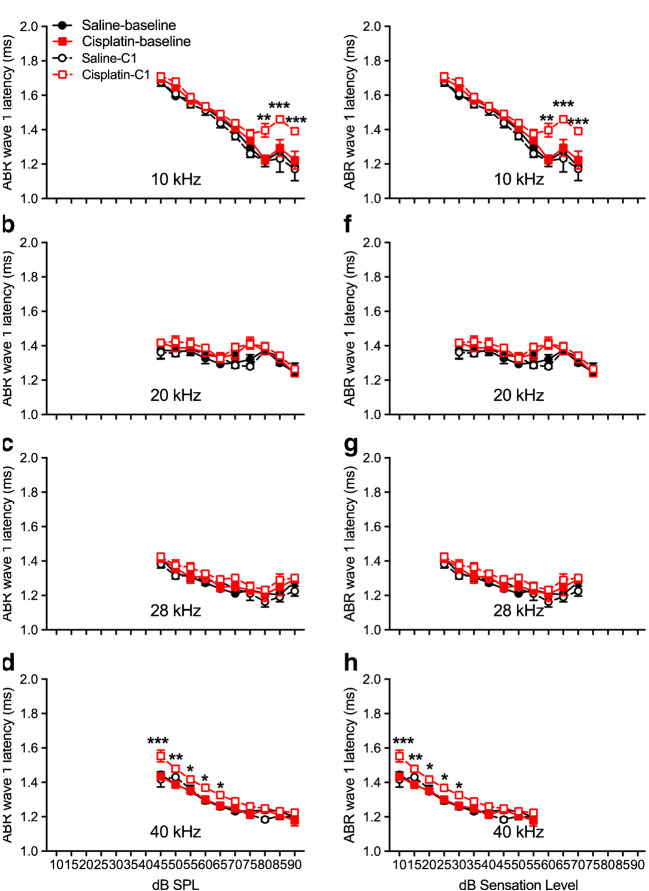
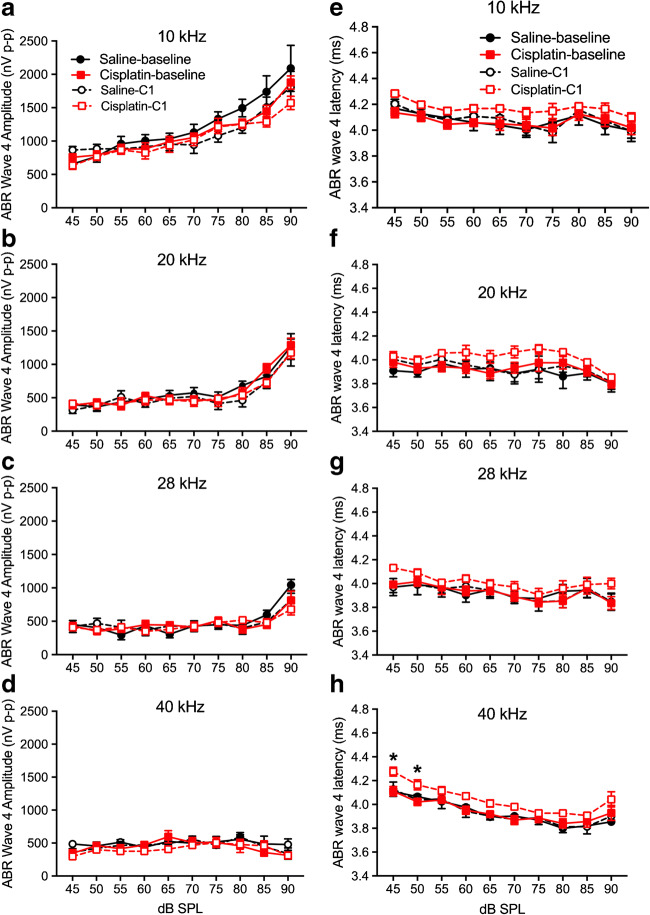
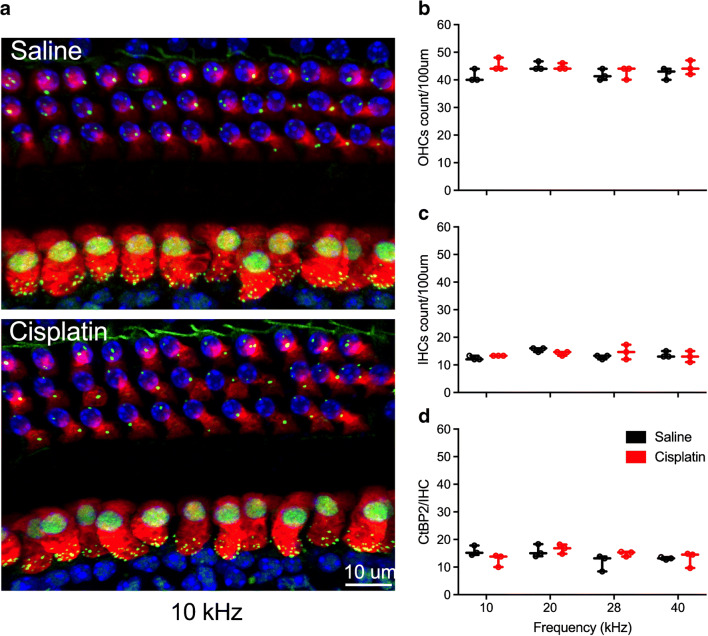
Early cisplatin-induced damage to the auditory system was assessed by delivering one cycle of the cisplatin dosing (cumulative dose of 16 mg/kg). This cycle is depicted in Fig. 1a. Two-factor ANOVAs (group × frequency) revealed no significant differences between the saline control and cisplatin groups for ABR threshold shifts or DPOAE threshold shifts across the five frequencies tested (Fig. 1b, c). Furthermore, there were no significant differences in ABR wave 1 amplitudes (Fig. 2a–d) or DPOAE amplitudes (Fig. 2e–h) at 10, 20, 28, and 40 kHz after the 4 × 1 cisplatin treatment. However, the three-factor ANOVA (group × stimulus level × test time) assessing ABR wave 1 latencies revealed a three-way interaction at 10 kHz [F(9, 272) = 21.89, p = 0.0268]. Bonferroni’s multiple comparisons test at each stimulus level/test time combination revealed that the post-exposure had higher latencies at 10 kHz (80–90 dB SPL; Fig. 3a). No differences were found at 20 or 28 kHz (Fig. 3b, c), but a three-way interaction was found at 40 kHz [F(9, 264) = 1.61, p = 0.0329], with post hoc analyses again revealing elevated latencies in the cisplatin-treated group post-exposure, this time at 45–65 dB SPL (Fig. 3d). The saline group did not demonstrate any latency prolongations. Because, in clinical diagnostics, ABR measurements were often performed at equal sensation levels (dB above threshold) instead of equal SPLs, we quantified the latencies at equal sensation levels and found the same pattern with the measurement at equal SPLs (Fig. 3e–h). Thus, a delay of ABR wave 1 latency was the earliest functional indicator for cisplatin-induced ototoxicity after the 4 × 1 treatment. Considering that ABR wave 1 is often difficult to reliably measure in humans, and the translatability of our study to the clinic would be enhanced if other ABR waves were similarly affected, especially for ABR wave 4 that is approximately homologous to the more reliably detected ABR wave V in humans, we quantified ABR wave 4 amplitude (Fig. 4a–d) and latency measurement (Fig. 4e–h). A significant difference between cisplatin group and saline group was found at 40 kHz [F(9, 272) = 17.62, p = 0.002 × 10⁻⁷] (Fig. 4h). Histological quantification was performed on cochleae from the same mice with the immunostaining of hair cells with myosin 7a (in red) and presynaptic ribbons with CtBP2 (in green) (representative images in Fig. 5a). Histopathologically, no significant differences were observed for the numbers of OHCs (Fig. 5b), IHCs (Fig. 5c), and presynaptic ribbons (Fig. 5d) between the cisplatin- and saline-treated groups after the 4 × 1 protocol.
Fig. 1.
No hearing threshold shifts after cisplatin 4 × 1 treatment. a The diagram of the 4 × 1 protocol. Mice were undergoing one cycle of cisplatin administration for 4 days followed by 10 days of recovery. ABR and DPOAE were tested 3 days prior the cisplatin treatment and 6 days after the last injection of cisplatin. b, c After the 4 × 1 treatment, both ABR and DPOAE threshold shifts were not significantly different between the saline (n = 6) and cisplatin (n = 10) groups. Data shown are the means ± 1 SEM
Fig. 2.
No significant changes of DPOAE and ABR wave 1 amplitudes after cisplatin 4 × 1 treatment. a–d I/O curves of DPOAE amplitudes were measured before (solid lines; baseline) and after cisplatin (n = 10) or saline (n = 6) administration (dashed lines). Two-way ANOVA revealed no differences in DPOAE amplitudes between the treated (cisplatin) and control (saline) across all four frequencies. e–h No differences were observed for ABR wave 1 amplitudes at all four frequencies. Data shown are the means ± 1 SEM
Fig. 3.
Changes of ABR wave 1 latencies after cisplatin 4 × 1 treatment. ABR wave 1 latencies at 10 kHz (a), 20 kHz (b), 28 kHz (c), and 40 kHz (d) were measured before cisplatin injection (solid red lines) or saline injection (solid black lines) and post-cisplatin (dashed red lines or dashed black lines). Sample sizes were n = 6 for the saline group and n = 10 for the cisplatin group. Points where the cisplatin post-exposure latencies were higher than at 10 kHz and 40 kHz at same SPL (a, d) or sensation level (e, h). *p < 0.05, **p < 0.01, and ***p < 0.001. Data shown are the means ± 1 SEM
Fig. 4.
Changes of ABR wave 4 amplitudes and latencies after cisplatin 4 × 1 treatment. a–d ABR wave 4 amplitudes were measured before (solid lines; baseline) and after cisplatin (n = 10) or saline (n = 6) administration (dashed lines). Two-way ANOVA revealed no differences in wave amplitudes between the treated (cisplatin) and control (saline) across all four frequencies. e–h ABR wave 4 latencies were measured and the latency at 40 kHz was longer in the cisplatin group compared with saline group. *p < 0.05. Data shown are the means ± 1 SEM
Fig. 5.
No significant loss of OHCs, IHCs, and presynaptic ribbons after cisplatin 4 × 1 treatment. a Immunostaining of hair cells with myosin 7a (in red), presynaptic ribbons with CtBP2 (in green), and cell nuclei with by DAPI (in blue). Loss of OHCs and presynaptic ribbons were observed. Quantification of OHCs (b), IHCs (c), and presynaptic ribbons between IHCs and SGNs (d) were performed at 10 kHz, 20 kHz, 28 kHz, and 40 kHz. No significant differences were found for any of these quantifications. Sample sizes are n = 4 (2 for each sex) for both groups. Data shown are the means ± 1 SEM
Cisplatin-Induced Damage after the 4 × 2 Treatment Cycle
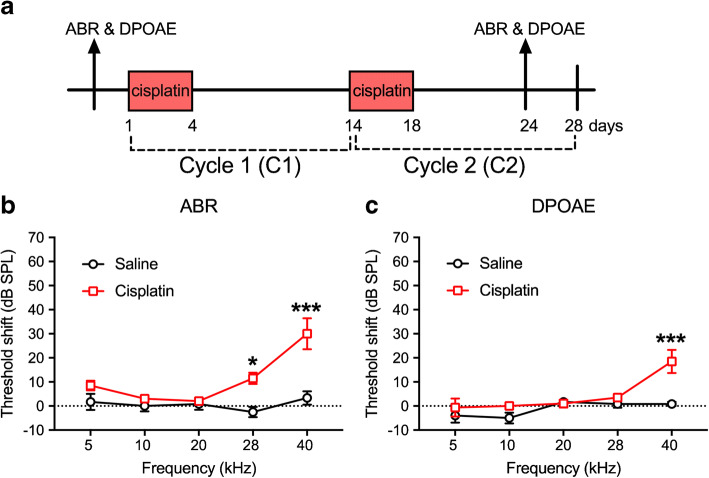
The 4 × 2 treatment protocol is illustrated in Fig. 6a. ABR and DPOAE data were collected at the sixth day after the last injection of cisplatin. Two-way ANOVA (group × frequency) for ABR threshold shifts between the controls and cisplatin-treated groups revealed a significant two-way interaction [F(4, 70) = 4.79, p = 0.002]. Bonferroni’s multiple comparisons test revealed significant differences between the cisplatin-exposed and saline control groups at 28 kHz (p = 0.004) and 40 kHz (p = 0.002 × 10⁻³) (Fig. 6b). Similarly, a significant two-way interaction for DPOAE threshold shifts was also observed [F(4, 67) = 3.35, p = 0.015]. Bonferroni’s multiple comparisons test of groups revealed a significant difference at 40 kHz (p = 0.0001) (Fig. 6c).
Fig. 6.
Threshold shifts after cisplatin 4 × 2 treatment. a Diagram of the 4 × 2 protocol. Animals were sacrificed 10 days after the last cisplatin injection. b, c Six days after the 4 × 2 treatment, analyses showed that both ABR and DPOAE threshold shifts were increased significantly in high-frequency regions in the cisplatin group (n = 10), but not the saline group (n = 6), measured 6 days after the last injection. **p < 0.01 and ***p < 0.001. Data shown are the means ± 1 SEM
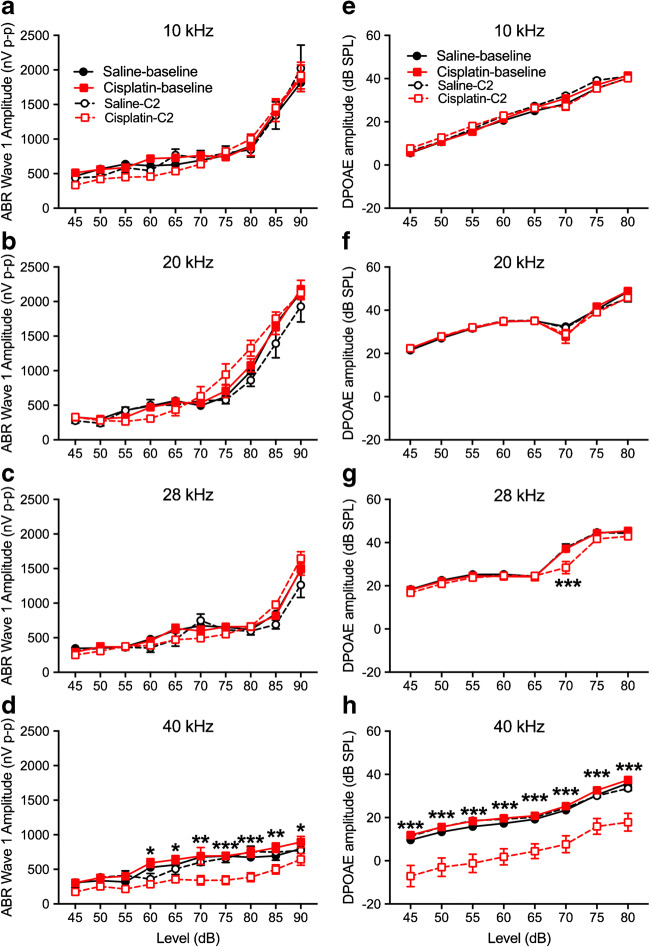
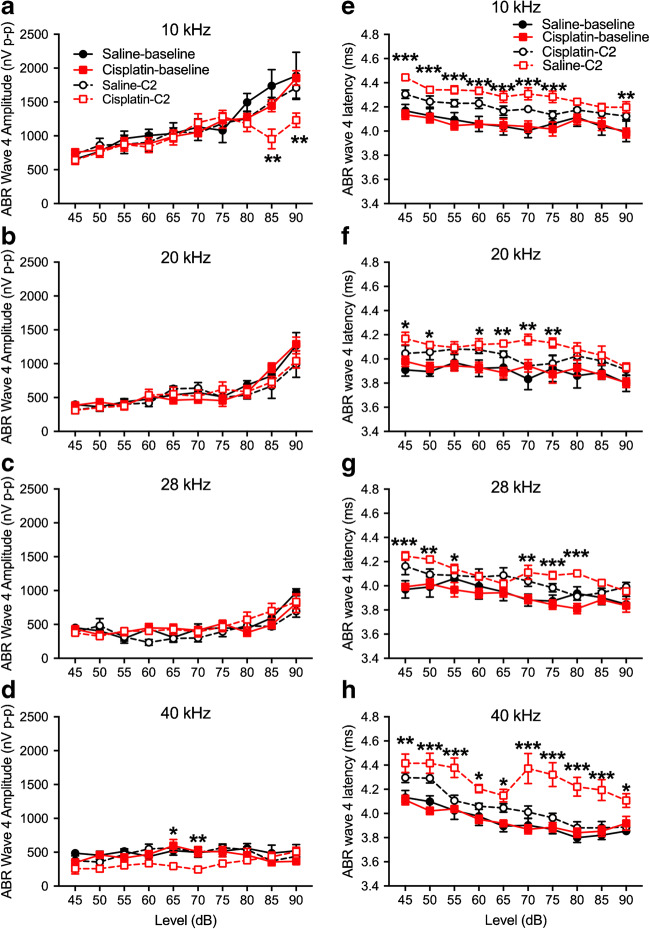
For ABR wave 1 amplitudes, a three-factor ANOVA (group × time × level) at each of the four test frequencies revealed no significant effects involving group at 10, 20, or 28 kHz (Fig. 7a–c). At 40 kHz, a significant three-way interaction was detected [F(9, 244) = 16.16, p = 0.0001] (Fig. 7d). Two-way ANOVAs (time × level) revealed no significant amplitude changes in the saline control group, but a significant two-way interaction in the cisplatin group [F(9, 143) = 2.59, p = 0.009]. Bonferroni test comparing baseline to post-exposure at each level revealed significant differences at the 65-, 80-, 85-, and 90-dB SPL stimulus levels. DPOAE amplitude changes were like the ABR wave 1 amplitudes. For DPOAE amplitude measurements across all frequencies tested, the three-factor ANOVAs (group × time × level) at each frequency found no significant effects involving group at 10, 20, or 28 kHz (Fig. 7e–g). At 40 kHz, a three-way interaction was detected [F(14, 182) = 1.75, p = 0.049] (Fig. 7h). Two-way ANOVAs (time × level) revealed no significant DPOAE amplitude changes in the saline control group, but a significant two-way interaction in the cisplatin group [F(14, 112) = 6.88, p = 0.006]. Bonferroni’s test comparing baseline to post-exposure at each level revealed significant differences at all stimulus levels from 25 to 80 dB SPL. For ABR wave 4 amplitudes, a three-factor ANOVA (group × time × level) at each of the four test frequencies revealed no significant effects involving group at 20 or 28 kHz (Fig. 8b or c). At 10 or 40 kHz (Fig. 8a or d), a significant three-way interaction was detected at 10 kHz [F(9, 267) = 4.58, p = 0.004] (Fig. 8a) and at 40 kHz [F(9, 63) = 6.964, p < 0.001] (Fig. 8d). The wave 4 latencies were longer in the cisplatin-treated group across all frequencies (Fig. 8e–h).
Fig. 7.
Changes of ABR wave 1 and DPOAE amplitudes after cisplatin 4 × 2 treatment. ABR wave 1 amplitudes were determined at the frequencies of 10 kHz (a), 20 kHz (b), 28 kHz (c), and 40 kHz (d) before (“Saline-baseline” and “Cisplatin-baseline”) and after (“Saline-C2” and “Cisplatin-C2”) the 4 × 2 protocol. Analyses revealed that the cisplatin-treated group (n = 10) experienced significant wave 1 amplitude decreases at 40 kHz, while the saline group (n = 6) did not. e–h DPOAE data revealed a similar pattern, with the cisplatin group presenting significant decreases in amplitude at 40 kHz. *p < 0.05, **p < 0.01, and ***p < 0.001. Data shown are the means ± 1 SEM
Fig. 8.
Changes of ABR wave 4 amplitudes and latencies after cisplatin 4 × 2 treatment. a–d ABR wave 4 amplitudes were measured in the 4 × 2 cycles and the statistical analysis showed dramatically drop at high intensity of 10 kHz. Two-way ANOVA revealed significant differences in wave 4 latencies between the treated (cisplatin) and control (saline) across all four frequencies (e–h). *p < 0.05, **p < 0.01, and ***p < 0.001. Data shown are the means ± 1 SEM
ABR wave 1 latencies before and after the 4 × 2 cisplatin treatment in the cisplatin group and the saline controls are depicted in Fig. 9. Three-factor ANOVAs were again run separately at each frequency. No significant effects involving groups were detected at 20 kHz (Fig. 9b). At 10, 28, and 40 kHz (Fig. 9a, c, d), a significant increase of ABR wave 1 latencies was observed across all frequencies tested. Collapsing across levels, Bonferroni’s test comparing groups at each test time revealed that the pre-exposure saline and cisplatin groups’ latencies were not different, nor were the pre-exposure saline and the post-exposure saline latencies. However, the post-exposure cisplatin latencies were significantly longer than the pre-exposure cisplatin and the post-exposure saline latencies.
Fig. 9.
Increase of ABR wave 1 latencies after cisplatin 4 × 2 treatment. ABR wave 1 latencies at 10 kHz (a), 20 kHz (b), 28 kHz (c), and 40 kHz (d) were measured before cisplatin injection (baseline) and after 4 × 2 cisplatin/saline (C2) administration. There were no significant changes in ABR wave 1 latencies for the control group (n = 6) among different time points. Significant latency increases for the cisplatin-treated group (n = 10) were detected at 10 kHz, 28 kHz, and 40 kHz. *p < 0.05, **p < 0.01, and ***p < 0.001. Data shown are the means ± 1 SEM
There were no differences in IHC counts between the control and cisplatin-treated mice by two-way ANOVA [F(1, 18) = 3.18, p = 0.092] (Fig. 10b). However, for OHC counts (Fig. 10a), there was a significant two-way interaction of group and location on the basilar membrane [F(2, 12) = 4.41, p = 0.037]. Bonferroni’s tests comparing the cisplatin and saline groups at each basilar membrane location revealed that the cisplatin group had significantly fewer OHCs than the saline group at the 40-kHz region of the basilar membrane (p = 0.032), consistent with the DPOAE data. A significant interaction of group × location was detected for IHC presynaptic ribbon counts [F(2, 12) = 19.23, p = 0.005] (Fig. 10c), with the cisplatin group’s presynaptic ribbons significantly lower at the 40-kHz region. In contrast, the number of presynaptic ribbons per OHC were not different between the control and cisplatin groups.
Fig. 10.
Loss of OHCs and presynaptic ribbons after cisplatin 4 × 2 treatment. a–c Quantification of IHCs (a), OHCs (b), and presynaptic ribbons between IHCs and SGNs (c) was performed at 10 kHz, 20 kHz, and 40 kHz. Two-way ANOVA showed that OHCs’ IHC presynaptic ribbons were significantly lower at 40 kHz in the cisplatin group (n = 4) than in the saline group (n = 4). **p < 0.01 and ***p < 0.001. Data shown are the means ± 1 SEM
Cisplatin-Induced Damage after the 4 × 3 Treatment Cycle
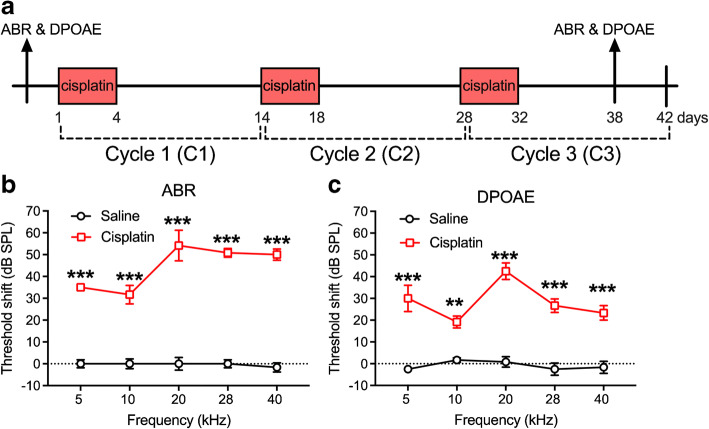
The third cycle of cisplatin (4 × 3) brought the cumulative dose to 48 mg/kg over a full 42-day experimental window (Fig. 11a). After the 4 × 3 treatment, both ABR and DPOAE threshold shifts were evaluated 6 days after the last injection of cisplatin. Two-way (group × frequency) ANOVA of ABR threshold shift revealed a significant two-way interaction [F(4, 50) = 5.31, p = 0.001]. Bonferroni’s multiple comparisons tests comparing the groups at each frequency revealed that the cisplatin group had significantly higher threshold shifts than the saline group at all five test frequencies (Fig. 11b). For the two-way ANOVA assessing DPOAE threshold shift, the same pattern was revealed, with a significant two-way interaction [F(4, 50) = 3.90, p = 0.008]. Bonferroni’s tests at each frequency revealed that the threshold shifts were higher in the cisplatin group than the saline group at each frequency (Fig. 11c).
Fig. 11.
Threshold shifts after cisplatin 4 × 3 treatment. a The diagram of the 4 × 3 protocol. ABR and DPOAE was tested 3 days prior to the cisplatin treatment for baseline and 6 days after the last injection of cisplatin. b Analyses revealed that a significant increase of ABR threshold shifts was observed across all five frequencies tested in the cisplatin-exposed group (n = 10) compared to the saline group (n = 6). c Analysis of DPOAE threshold shifts also showed significant increases across all five frequencies in the cisplatin-treated group. **p < 0.01 and ***p < 0.001. Data shown are the means ± 1 SEM
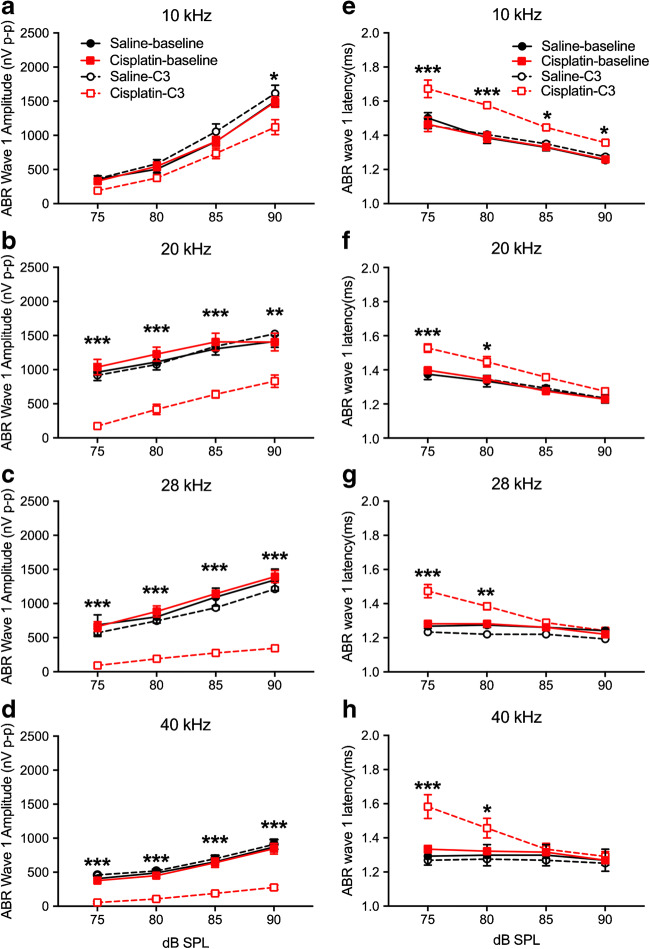
Because of the magnitude of threshold shift, supra-threshold DPOAE amplitudes comprised too limited of a data set and were not analyzed. Supra-threshold ABR wave 1 amplitudes (Fig. 12a–d) and wave 1 latencies (Figs. 12e–13g) were confined to 75 dB SPL and above due to ABR threshold shift. Each frequency was analyzed separately. At 10 kHz, the three-factor ANOVA for wave 1 amplitudes (group × frequency × test time) revealed no significant effects involving groups or test time. At 20 kHz, a two-way interaction of group × test time was detected [F(1, 36) = 5.00, p = 0.045]. Post hoc analysis (Bonferroni test) revealed that the 4 × 3 cisplatin-treated group had significantly lower amplitudes after cisplatin exposure than the saline group pre- or post-exposure or the cisplatin group pre-exposure (Fig. 12b). At 28 kHz, a three-way interaction was found [F(3, 30) = 6.71, p = 0.004 × 10⁻⁴]. Groups were compared at each level and test time combination with Bonferroni’s tests. Results revealed that the 4 × 3 cisplatin group post-exposure had lower amplitudes than the saline group pre- or post-exposure or the cisplatin group pre-exposure at each level from 75 to 90 dB SPL (Fig. 12c). The same three-way interaction [F(3, 36) = 5.60, p = 0.003] and pattern of group differences were detected at 40 kHz (Fig. 12d).
Fig. 12.
Changes of ABR wave 1 amplitudes and latencies after cisplatin 4 × 3 treatment. a–d ABR wave 1 amplitudes at 10 kHz, 20 kHz, 28 kHz, and 40 kHz, respectively. Analyses revealed significant reductions from baseline of ABR wave 1 amplitude by cisplatin treatment (n = 10) at 20–40 kHz, compared to the saline group (n = 6). e–h ABR wave 1 latencies were determined at 10 kHz, 20 kHz, 28 kHz, and 40 kHz. Analyses showed significant increases induced by cisplatin treatment at lower stimulus levels. *p < 0.05, **p < 0.01, and ***p < 0.001. Data shown are the means ± 1 SEM
Fig. 13.
Cochlear histopathology quantification after the 4 × 3 treatment protocol. a OHC counts after the 4 × 3 protocol. As expected, OHC loss in the cisplatin-treated group (n = 6) was significantly greater than the saline group (n = 7) across the regions of the basilar membrane that were evaluated. b IHC counts demonstrated no significant differences between the cisplatin and control groups. c Presynaptic ribbons on the IHCs were also reduced in the cisplatin-treated group. *p < 0.05, **p < 0.01, and ***p < 0.001. Data shown are the means ± 1 SEM
The analysis of ABR wave 1 latency at 10 kHz showed a significant three-way interaction (group × level × test time) [F(3, 36) = 6.023, p = 0.002]. Groups were compared at each level and test time combination with Bonferroni’s tests. Results revealed that the 4 × 3 cisplatin group post-exposure had longer latencies than the saline group pre- or post-exposure or the cisplatin group pre-exposure at each level from 75 to 90 dB SPL (Fig. 12e). A three-way interaction was also detected at 20 kHz [F(3, 36) = 4.77, p = 0.007]. Bonferroni’s tests revealed that the 4 × 3 cisplatin group post-exposure had longer latencies than the saline group pre- or post-exposure or the cisplatin group pre-exposure at each level from 75 and 80 dB SPL (Fig. 12f). The same three-way interaction [F(3, 33) = 5.73, p = 0.003] and pattern of Bonferroni’s tests were detected at 28 kHz (Fig. 12g) and again at 40 kHz (interaction—F(3, 33) = 35.49, p = 0.0001) (Fig. 12h).
Histopathology confirmed the high level of damage induced by the cumulative 48 mg/kg dose of cisplatin. Two-way ANOVA (group × location on the basilar membrane) assessing OHC counts revealed a two-way interaction [F(2, 21) = 7.33, p = 0.002]. Bonferroni’s tests comparing groups at each region of the basilar membrane revealed that the cisplatin-treated group had fewer OHCs than the saline group at each of the four regions sampled (Fig. 13a). There were no group differences or interaction for IHC counts (Fig. 13b). For IHC presynaptic ribbons (Fig. 13c), a significant two-way interaction was detected [F(2, 21) = 9.68, p = 0.003 × 10⁻³]. Like for the OHC counts, Bonferroni’s tests comparing groups at each region of the basilar membrane revealed that the cisplatin-treated group had fewer presynaptic ribbons than the saline group at each of the four regions sampled. No significant differences were detected for OHC presynaptic ribbons.
Mitochondria Are Compromised by an Early Treatment of Cisplatin
To investigate the pathology underlying the early latency changes that were detected after the 4 × 1 dosing paradigm, we applied EM to assess and mitochondrial morphology and auditory nerve demyelination. We quantified a total of 450 saline-treated (50 axons per turn, per 3 control mice) and 450 4 × 1 cisplatin-treated (50 axons per turn, per 3 4 × 1 mice) axons.
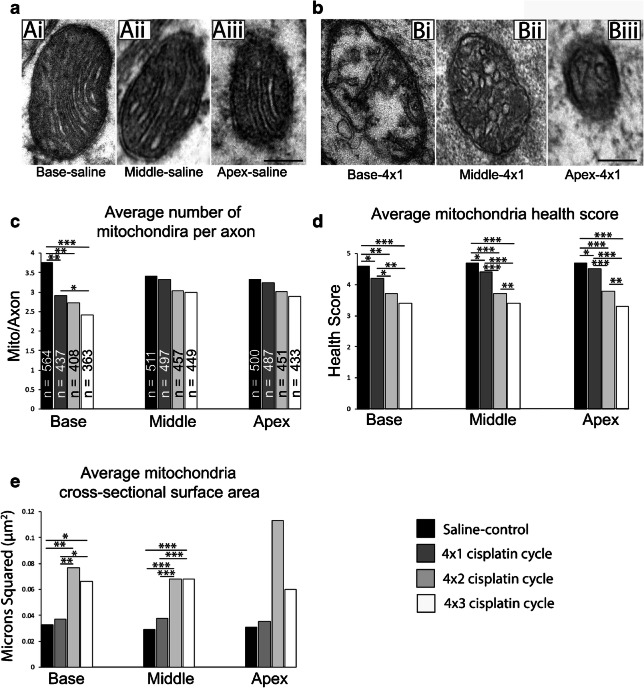
The most conspicuous morphological changes between the saline-treated and 4 × 1 treatment groups involved the mitochondrial profiles. In the saline-treated group, mitochondria cristae in each turn were “healthy” as they were intact, regularly packed, and sharply defined (Fig. 14a). In the 4 × 1 treatment group, mitochondria cristae began to appear fragmented, irregularly packed, swollen, and even absent in severe cases (Fig. 14b). To examine the effects of the 4 × 1 treatment cycle on mitochondria morphology, we quantified the number of mitochondria present in each axon, the morphometric health of each mitochondria, and the cross-sectional surface area of each mitochondrion (Table 1). In the 450 saline-treated axons, there were 1575 mitochondrial profiles (Fig. 14c). In the 450 4 × 1 treated axons, there were 1421 mitochondrial profiles. We found that the number of mitochondria profiles per axon was significantly (p = 0.003) reduced in the base by the early treatment of cisplatin. We did not find significant changes in mitochondria per axon in the middle or apical turns in the early treatment of cisplatin. Each mitochondrial profile was given a morphometric health grade based on the integrity of the cristae from 5 (best) to 1 (worst). The early treatment of cisplatin significantly reduced the average health score of the mitochondrial profiles from 4.6 to 4.2 in the base (p = 0.004), 4.7 to 4.4 in the middle (p = 0.004), and from 4.7 to 4.5 in the apex (p = 0.004; Fig. 14d). Cross-sectional surface area of the mitochondria was not changed by the 4 × 1 treatment of cisplatin (Fig. 14e).
Fig. 14.
Early treatment (4 × 1) of cisplatin affects the morphology of mitochondrial profiles throughout the cochlear nerves. a Transmission electron micrographs of mitochondria in the base, middle, and apex of a saline-treated cochlea at ×60,000 magnification. (Ai) A mitochondria in the basal turn of a saline treated cochlea. The cristae of this mitochondria are sharp and regularly packed. This mitochondrion was given a health grade of 5. (Aii) A mitochondria in the middle turn of a saline-treated cochlea. The cristae of this mitochondria are sharp and regularly packed. This mitochondrion was given a health grade of 5. (Aiii) A mitochondria in the apical turn of a saline-treated cochlea. The cristae of this mitochondria are sharp and regularly packed. This mitochondrion was given a health grade of 5. b Transmission electron micrographs of mitochondria in the base, middle, and apex of a 4 × 1 treated cochlea at ×60,000 magnification. (Bi) A mitochondria in the basal turn of a 4 × 1 treated cochlea. The cristae of this mitochondria are fragmented, loosely packed, swollen, or missing. This mitochondrion was given a health grade of 2. (Bii) A mitochondria in the middle turn of a 4 × 1 treated cochlea. The cristae of this mitochondria are swollen, fragmented, and irregularly packed. This mitochondrion was given a health grade of 3. (Biii) A mitochondria in the apical turn of a 4 × 1 treated cochlea. The cristae of this mitochondria are swollen, fragmented, and irregularly packed. This mitochondrion was given a health grade of 3. c Histograms summarizing the number of mitochondrial profiles per axon across the base, middle, and apex of cochlea treated with saline, a 4 × 1 cisplatin cycle, a 4 × 2 cisplatin cycle, and a 4 × 3 cisplatin cycle. 150 axons were examined in each combination of cochlear turn and treatment. N = the number of mitochondria quantified in the give 150 axons, the number of mitochondria profiles per axon were significantly reduced in the base after every treatment cycle of cisplatin when compared to the saline treated axons (*p < 0.05; **p < 0.005; ***p < 0.001). d Histograms summarizing the health score of each mitochondria profile across the base, middle, and apex of cochlea treated with saline, a 4 × 1 cisplatin cycle, a 4 × 2 cisplatin cycle, and a 4 × 3 cisplatin cycle. The health scores of mitochondria were significantly reduced in each cochlear turn across each cisplatin treatment when compared to the saline treatment (*p < 0.05; **p < 0.005; ***p < 0.001). Mitochondria health scores continued to significantly decline with more treatment cycles of cisplatin. E Histograms summarizing the cross-sectional surface area of each mitochondria profile across the base, middle, and apex of cochlea treated with saline, a 4 × 1 cisplatin cycle, a 4 × 2 cisplatin cycle, and a 4 × 3 cisplatin cycle. The cross-sectional surface areas were not significantly different between the saline-treated and 4 × 1 treated cochlea in any turn. Cross-sectional surface areas of mitochondria in the base and middle treated with a 4 × 2 cycle or 4 × 3 cycle of cisplatin were significantly larger than surface areas treated with saline (*p < 0.05; **p < 0.005; ***p < 0.001). Post hoc analysis of the mixed-effect model revealed no significant change in the apex. Scale bars = 100 nm (a) and (b)
Table 1.
Summary of mitochondrial ultrastructural changes of axons within the basal, middle, and apical turns of the osseous spiral lamina after various treatment cycles of cisplatin
| Base mito/axon | Treatment | Saline | 1st cycle | 2nd cycle | 3rd cycle |
| Saline | 0.0022 | 0.0011 | 0.0003 | ||
| 1st cycle | 0.0022 | 0.3797 | 0.0349 | ||
| 2nd cycle | 0.0011 | 0.3797 | 0.1185 | ||
| 3rd cycle | 0.0003 | 0.0349 | 0.1185 | ||
| Base mito health | Treatment | Saline | 1st cycle | 2nd cycle | 3rd cycle |
| Saline | 0.0483 | 0.0014 | 0.0003 | ||
| 1st cycle | 0.0483 | 0.0176 | 0.0014 | ||
| 2nd cycle | 0.0014 | 0.0176 | 0.0735 | ||
| 3rd cycle | 0.0003 | 0.0014 | 0.0735 | ||
| Base mito S.A. | Treatment | Saline | 1st cycle | 2nd cycle | 3rd cycle |
| saline | 0.708 | 0.0046 | 0.0103 | ||
| 1st cycle | 0.708 | 0.0046 | 0.0133 | ||
| 2nd cycle | 0.0046 | 0.0046 | 0.2924 | ||
| 3rd cycle | 0.0103 | 0.0133 | 0.2924 | ||
| Middle mito/axon | Treatment | Saline | 1st cycle | 2nd cycle | 3rd cycle |
| Saline | 0.638 | 0.1328 | 0.1328 | ||
| 1st cycle | 0.638 | 0.2042 | 0.1328 | ||
| 2nd cycle | 0.1328 | 0.2042 | 0.6526 | ||
| 3rd cycle | 0.1328 | 0.1328 | 0.6526 | ||
| Middle mito health | Treatment | Saline | 1st cycle | 2nd cycle | 3rd cycle |
| Saline | 0.0075 | < 0.0001 | < 0.0001 | ||
| 1st cycle | 0.0075 | < 0.0001 | < 0.0001 | ||
| 2nd cycle | < 0.0001 | < 0.0001 | 0.0011 | ||
| 3rd cycle | < 0.0001 | < 0.0001 | 0.0011 | ||
| Middle mito S.A. | Treatment | saline | 1st cycle | 2nd cycle | 3rd cycle |
| saline | 0.06 | < 0.0001 | < 0.0001 | ||
| 1st cycle | 0.06 | 0.0002 | 0.0002 | ||
| 2nd cycle | < 0.0001 | 0.0002 | 0.7362 | ||
| 3rd cycle | < 0.0001 | 0.0002 | 0.7362 | ||
| Apex mito/axon | Treatment | Saline | 1st cycle | 2nd cycle | 3rd cycle |
| Saline | 0.5167 | 0.1525 | 0.1148 | ||
| 1st cycle | 0.5167 | 0.3178 | 0.1525 | ||
| 2nd cycle | 0.1525 | 0.3178 | 0.4791 | ||
| 3rd cycle | 0.1148 | 0.1525 | 0.4791 | ||
| Apex mito health | Treatment | Saline | 1st cycle | 2nd cycle | 3rd cycle |
| saline | 0.0395 | < 0.0001 | < 0.0001 | ||
| 1st cycle | 0.0395 | 0.0001 | < 0.0001 | ||
| 2nd cycle | < 0.0001 | 0.0001 | 0.0026 | ||
| 3rd cycle | < 0.0001 | < 0.0001 | 0.0026 | ||
| Apex mito S.A. | Treatment | Saline | 1st cycle | 2nd cycle | 3rd cycle |
| Saline | 0.8751 | 0.087 | 0.5154 | ||
| 1st cycle | 0.8751 | 0.087 | 0.5154 | ||
| 2nd cycle | 0.087 | 0.087 | 0.2219 | ||
| 3rd cycle | 0.5154 | 0.5154 | 0.2219 |
Linear mixed-effect models were used and determined that there were significant changes to the presence of mitochondria per axon, the morphometric health score of each mitochondria, and the cross-sectional surface area of each mitochondria in each turn of the cochlea after three different treatment cycles of cisplatin. Bold values indicate the comparisons to the saline- and cisplatin-treated groups that reached statistical difference; p < 0.05
S.A. cross-sectional surface area
To better understand whether these mitochondrial changes continued to occur in later treatment cycles, we quantified these measures in an additional 450 axons given the 4 × 2 treatment and 450 axons given the 4 × 3 treatment of cisplatin (Fig. 14c–e). We found additional losses of mitochondrial profiles in the base after both the second and third cycle of cisplatin treatment (Fig. 14c). Health scores continued to decline in all three turns for each treatment cycle of cisplatin (Fig. 14d). Cross-sectional surfaces significantly increased after 4 × 2 and 4 × 3 treatments, perhaps reflecting fused mitochondria and/or swollen mitochondria (Fig. 14e).
Interestingly, we found no significant changes to the myelin thickness, number of dense lines, and axon diameter in any cochlear turn in the 4 × 1 treatment group. Nor did we observe any signs of pathological myelin such as ballooning, splitting, and decompaction of the lamellae or vacuolization (Fig. 15a–f). As such, we did not quantify these criteria in the second and third treatment cycles as the goal of the current study was to establish changes in the cochlear axons due to an early treatment of cisplatin. We did qualitatively observe signs pathological myelin after the later cycles of cisplatin and the unhealthiest mitochondrial profiles (scores of 1 or 2) (Fig. 15c, d). However, based on previous literature (Jessen and Mirsky 2008; Lee et al. 2005a, b; Taioli et al. 2011; van Ruijven et al. 2005; Wan and Corfas 2017; Wu et al. 2017), signs of pathological myelin due to later treatment cycles of cisplatin are expected.
Fig. 15.
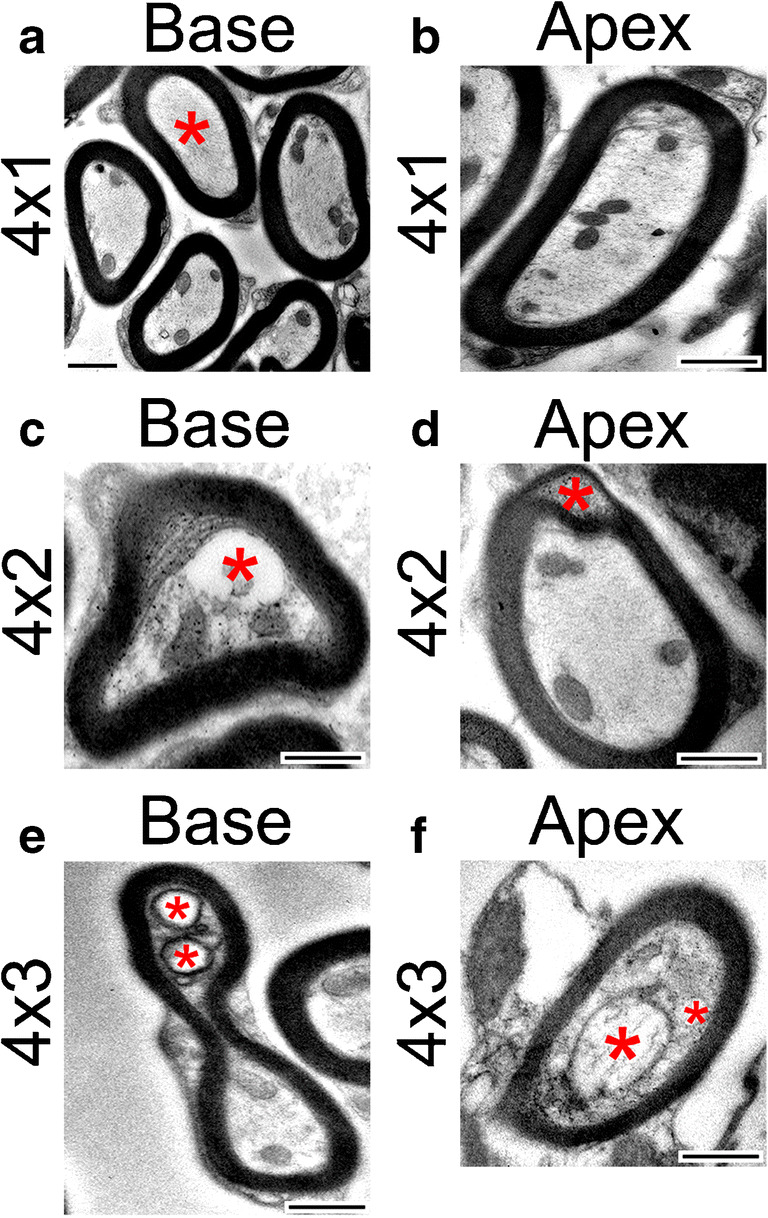
Myelination is not affected by early treatments of cisplatin. The early treatment of cisplatin did not result in significant differences in the myelination of axons in the osseous spiral laminae of the cochlea. a Electron micrograph of axons in the basal turn of the cochlea after an early treatment of cisplatin. Myelination appears regular and without noticeable pathologies. However, note the absence of mitochondria in the axon marked with a red asterisk. The absence of mitochondria after a 4 × 1 treatment of cisplatin occurred more frequently in the base than the middle or apex. b Electron micrograph of an axon in the apex after an early treatment of cisplatin with normal myelination. c Electron micrograph of an axon in the base after a 4 × 2 treatment of cisplatin. Note the formation of a large vacuole and separation of the cytoplasm from the myelin sheath (red asterisk). d Electron micrograph of an axon in the apex after a 4 × 2 treatment of cisplatin. Note the splitting and ballooning within the myelin (red asterisk). e Electron micrograph of an axon in the base after a 4 × 3 treatment of cisplatin. The axon is malformed, and vacuoles are present (red asterisks). f Electron micrograph of an axon in the apex after a 4 × 3 treatment of cisplatin. The mitochondria in the axon are severely damaged as it is very swollen, and the cristae are largely absent (larger red asterisks). There is also a vacuole present (smaller red asterisk). Scale bars = 500 nm
DISCUSSION
The impact of cisplatin-induced ototoxicity not only affects the cancer treatment of patients but also their quality of life (Rybak et al. 2019). Built from our previous studies (Bielefeld 2013; Bielefeld et al. 2018; Harrison et al. 2015; Harrison et al. 2016; Tang et al. 2015), here, we identified early functional and cellular changes for cisplatin-induced ototoxicity. Our results indicate that one early cellular target for cisplatin-induced damage is the SGN axons. The data from the 4 × 1 experiment suggest that a delay of ABR wave 1 latency is the earliest functional change in cisplatin ototoxicity, preceding ABR threshold shifts and amplitude changes, as well as DPOAE changes. ABR wave I latency may be a useful tool to help clinical diagnosis of early cisplatin-induced ototoxicity in humans (Velasco et al. 2014).
Cisplatin-Induced Functional and Cellular Damages
Cisplatin chemotherapy can cause side effects to the nervous system either at low- or high-dose regimens (Chiorazzi et al. 2015; Gilardini et al. 2012; Kanat et al. 2017; Karasawa and Steyger 2015). In the 4 × 3 model with a cumulative dose of 48 mg/kg, increases of ABR thresholds were found from low to high frequencies tested. In the 4 × 2 model (32 mg/kg cumulative dose), increases of ABR and DPOAE thresholds were found only at high frequencies, with underlying loss of OHCs and presynaptic ribbons between IHCs and SGNs. Most interestingly, the delay of ABR wave 1 latency from this 4 × 2 treatment was not confined to high-frequency regions. Since no changes to ABR and DPOAE thresholds were observed in the low-frequency region of the cochlea, this finding along with the latency changes after the 4 × 1 protocol suggests that the ABR wave 1 latency delay is an early functional marker for cisplatin-induced ototoxicity, one that occurs before clinically detectable changes to hearing thresholds or DPOAEs. In the 4 × 1 protocol, no other functional changes beyond the ABR wave 1 latency delay were observed, even in high-frequency regions. Interestingly, after the 4 × 1 treatment at 10 kHz, the latency differences appeared only at high supra-threshold levels, whereas at 40 kHz, the latency differences appeared only at the lower intensity levels. The latencies measured at equal sensation levels showed the same pattern. This difference indicates a possible regional difference in their sensitivities to cisplatin. Consistent with our finding in mice, a delay of ABR wave latencies is observed prior to increased hearing thresholds in patients treated with cisplatin, although the number of cases reported was low (De Lauretis et al. 1999).
Associated with the delay of ABR wave 1, two early cellular changes after the 4 × 1 treatment were found, mitochondrial loss and deterioration of mitochondrial health in SGN axons. Cisplatin is known to cause loss of three types of cochlear cells: hair cells, SGNs, and cells in spiral ligament and stria vascularis (Karasawa and Steyger 2015; Rybak et al. 2007). Recent findings implicate that hair cell death may be secondary to impaired maintenance of the endolymph by the damaged stria vascularis because of high cisplatin accumulation found in stria vascularis compared with little accumulation in hair cells (Breglio et al. 2017). After the 4 × 1 treatment, there was no loss of hair cells or synapses between IHCs and SGNs. Thus, it is likely that the SGN mitochondria and myelination changes are not secondary to damage that occurred in other cochlear cell types. Instead, cisplatin can cause direct damage to SGNs by binding to nuclear and mitochondrial DNA, with similar binding affinities to each (Canta et al. 2015; Podratz et al. 2011). Cisplatin may also impair mitochondrial transport dynamics (Podratz et al. 2017) and alter the expression of mitochondrial fusion and fission proteins (Bobylev et al. 2018). All these damage processes could result in the decrease in mitochondrial numbers observed after each of the cisplatin treatment protocols. It is important to note that the observed mitochondrial injuries may not be confined to those in the SGNs. Other cell populations in the organ of Corti and lateral wall are dense with mitochondria as well and are known targets of cisplatin ototoxicity. The current study did not assess the hair cells and lateral wall cells for mitochondrial changes, but it is quite possible that those cells would be affected similarly to the SGNs evaluated in the present study. Similarly, it cannot be ruled out that stria vascularis damage and a subsequent reduction of the endocochlear potential could underlie the ABR threshold shifts and supra-threshold changes that were detected. Future research should evaluate mitochondria changes in those cells to determine if changes in those cells might correlate with ABR physiology changes in early cisplatin ototoxicity.
LIMITATIONS
The finding of latency shifts preceding threshold shift, with a possible underlying change in SGN mitochondria, is intriguing. While the current study quantified presynaptic ribbons in the IHC–SGN synapse, no post-synaptic structures were evaluated. Since these may be a target of cisplatin and could contribute to the reduced ABR amplitudes and threshold shifts measured after the 4 × 2 and 4 × 3 protocols, quantifying those structures is a worthwhile future experiment. In addition, the EM work was composed of relatively low sample sizes. Future work will expand on those analyses to provide more detailed insight into early cisplatin-induced damage to the SGN axons.
CONCLUSION
In summary, we have identified both early cisplatin-induced functional, cellular, and molecular changes in the cochlea. The results point to SGNs as a target for early cisplatin-induced damages. An increased latency of ABR wave 1 could be due to cisplatin-induced damage to SGN mitochondria and myelination. Thus, the results point to not only a functional marker that can potentially be used to detect early cisplatin-induced ototoxicity but also potential cellular targets to prevent this damage.
Acknowledgments
The authors would like to thank Dr. Mincheol Kang for his help. The project was supported by a grant to J.B. from the National Institute on Deafness and Other Communication Disorders (R41DC017108).
Compliance with Ethical Standards
Conflict of Interest Disclosure Statement
J.B. is one of the co-founders of Gateway Biotechnology Inc. and has disclosed potential interests fully to Northeast Ohio Medical University. Other authors declare that they have no conflict of interest.
Footnotes
Publisher’s Note
Springer Nature remains neutral with regard to jurisdictional claims in published maps and institutional affiliations.
References
- Abujamra AL, Escosteguy JR, Dall'Igna C, Manica D, Cigana LF, Coradini P, Brunetto A, Gregianin LJ. The use of high-frequency audiometry increases the diagnosis of asymptomatic hearing loss in pediatric patients treated with cisplatin-based chemotherapy. Pediatr Blood Cancer. 2013;60:474–478. doi: 10.1002/pbc.24236. [DOI] [PubMed] [Google Scholar]
- Bao J, Wolpowitz D, Role LW, Talmage DA. Back signaling by the Nrg-1 intracellular domain. J Cell Biol. 2003;161:1133–1141. doi: 10.1083/jcb.200212085. [DOI] [PMC free article] [PubMed] [Google Scholar]
- Bao J, Lin H, Ouyang Y, Lei D, Osman A, Kim T-W, Mei L, Dai P, Ohlemiller KK, Ambron RT. Activity-dependent transcription regulation of PSD-95 by neuregulin-1 and Eos. Nat Neurosci. 2004;7:1250–1258. doi: 10.1038/nn1342. [DOI] [PubMed] [Google Scholar]
- Bao J, Lei D, Du Y, Ohlemiller KK, Beaudet AL, Role LW. Requirement of nicotinic acetylcholine receptor subunit β2 in the maintenance of spiral ganglion neurons during aging. J Neurosci. 2005;25:3041–3045. doi: 10.1523/JNEUROSCI.5277-04.2005. [DOI] [PMC free article] [PubMed] [Google Scholar]
- Bao J, Hungerford M, Luxmore R, Ding D, Qiu Z, Lei D, Yang A, Liang R, Ohlemiller KK. Prophylactic and therapeutic functions of drug combinations against noise-induced hearing loss. Hear Res. 2013;304:33–40. doi: 10.1016/j.heares.2013.06.004. [DOI] [PMC free article] [PubMed] [Google Scholar]
- Barry MA, Behnke CA, Eastman A (1990) Activation of programmed cell death (apoptosis) by cisplatin, other anticancer drugs, toxins and hyperthermia. Biochem Pharmacol 40(10):2353–2362 [DOI] [PubMed]
- Bielefeld EC. Age-related hearing loss patterns in Fischer 344/NHsd rats with cisplatin-induced hearing loss. Hear Res. 2013;306:46–53. doi: 10.1016/j.heares.2013.09.003. [DOI] [PubMed] [Google Scholar]
- Bielefeld EC, Markle A, DeBacker JR, Harrison RT. Chronotolerance for cisplatin ototoxicity in the rat. Hear Res. 2018;370:16–21. doi: 10.1016/j.heares.2018.09.004. [DOI] [PubMed] [Google Scholar]
- Bobylev I, Joshi AR, Barham M, Neiss WF, Lehmann HC. Depletion of mitofusin-2 causes mitochondrial damage in cisplatin-induced neuropathy. Mol Neurobiol. 2018;55:1227–1235. doi: 10.1007/s12035-016-0364-7. [DOI] [PubMed] [Google Scholar]
- Böheim K, Bichler E. Cisplatin-induced ototoxicity: audiometric findings and experimental cochlear pathology. Arch Otorhinolaryngol. 1985;242:1–6. doi: 10.1007/BF00464398. [DOI] [PubMed] [Google Scholar]
- Breglio AM, Rusheen AE, Shide ED, Fernandez KA, Spielbauer KK, McLachlin KM, Hall MD, Amable L, Cunningham LL. Cisplatin is retained in the cochlea indefinitely following chemotherapy. Nat Commun. 2017;8:1654. doi: 10.1038/s41467-017-01837-1. [DOI] [PMC free article] [PubMed] [Google Scholar]
- Brennan-Jones CG, McMahen C, Van Dalen EC. Cochrane corner: platinum-induced hearing loss after treatment for childhood cancer. Int J Audiol. 2019;58:181–184. doi: 10.1080/14992027.2018.1539808. [DOI] [PubMed] [Google Scholar]
- Canta A, Pozzi E, Carozzi V. Mitochondrial dysfunction in chemotherapy-induced peripheral neuropathy (CIPN) Toxics. 2015;3:198–223. doi: 10.3390/toxics3020198. [DOI] [PMC free article] [PubMed] [Google Scholar]
- Cardinaal RM, de Groot JC, Huizing EH, Veldman JE, Smoorenburg GF. Dose-dependent effect of 8-day cisplatin administration upon the morphology of the albino Guinea pig cochlea. Hear Res. 2000;144:135–146. doi: 10.1016/S0378-5955(00)00059-9. [DOI] [PubMed] [Google Scholar]
- Chiorazzi A, Semperboni S, Marmiroli P. Current view in platinum drug mechanisms of peripheral neurotoxicity. Toxics. 2015;3:304–321. doi: 10.3390/toxics3030304. [DOI] [PMC free article] [PubMed] [Google Scholar]
- Church MW, Blakley BW, Burgio DL, Gupta AK. WR-2721 (Amifostine) ameliorates cisplatin-induced hearing loss but causes neurotoxicity in hamsters: dose-dependent effects. J Assoc Res Otolaryngol. 2004;5:227–237. doi: 10.1007/s10162-004-4011-z. [DOI] [PMC free article] [PubMed] [Google Scholar]
- Clerici W, Hensley K, DiMartino D, Butterfield D. Direct detection of ototoxicant-induced reactive oxygen species generation in cochlear explants. Hear Res. 1996;98:116–124. doi: 10.1016/0378-5955(96)00075-5. [DOI] [PubMed] [Google Scholar]
- Coughlin L, Morrison RS, Horner PJ, Inman DM (2015) Mitochondrial morphology differences and mitophagy deficit in murine glaucomatous optic nerve. Investig Ophthalmol Vis Sci 56(3):1437–1446 [DOI] [PMC free article] [PubMed]
- De Lauretis A, De Capua B, Barbieri MT, Bellussi L, Passàli D. ABR evaluation of ototoxicity in cancer patients receiving cisplatin or carboplatin. Scand Audiol. 1999;28:139–143. doi: 10.1080/010503999424707. [DOI] [PubMed] [Google Scholar]
- Dehne N, Lautermann J, Petrat F, Rauen U, de Groot H. Cisplatin ototoxicity: involvement of iron and enhanced formation of superoxide anion radicals. Toxicol Appl Pharmacol. 2001;174:27–34. doi: 10.1006/taap.2001.9171. [DOI] [PubMed] [Google Scholar]
- Ding D, Jiang H, Wang P, Salvi R. Cell death after co-administration of cisplatin and ethacrynic acid. Hear Res. 2007;226:129–139. doi: 10.1016/j.heares.2006.07.015. [DOI] [PubMed] [Google Scholar]
- Einarsson EJ, Petersen H, Wiebe T, Fransson PA, Grenner J, Magnusson M, Moëll C. Long term hearing degeneration after platinum-based chemotherapy in childhood. Int J Audiol. 2010;49:765–771. doi: 10.3109/14992027.2010.485595. [DOI] [PubMed] [Google Scholar]
- Fausti SA, Frey RH, Henry JA, Olson DJ, Schaffer HI. High-frequency testing techniques and instrumentation for early detection of ototoxicity. J Rehabil Res Dev. 1993;30:333–3341. [PubMed] [Google Scholar]
- Fernandez K, Wafa T, Fitzgerald TS, Cunningham LL. An optimized, clinically relevant mouse model of cisplatin-induced ototoxicity. Hear Res. 2019;375:66–74. doi: 10.1016/j.heares.2019.02.006. [DOI] [PMC free article] [PubMed] [Google Scholar]
- Francis SP, Cunningham LL. Non-autonomous cellular responses to ototoxic drug-induced stress and death. Front Cell Neurosci. 2017;11:252. doi: 10.3389/fncel.2017.00252. [DOI] [PMC free article] [PubMed] [Google Scholar]
- Gilardini A, Avila RL, Oggioni N, Rodriguez-Menendez V, Bossi M, Canta A, Cavaletti G, Kirschner DA. Myelin structure is unaltered in chemotherapy-induced peripheral neuropathy. Neurotoxicology. 2012;33:1–7. doi: 10.1016/j.neuro.2011.10.010. [DOI] [PubMed] [Google Scholar]
- Hansen SW, Helweg-Larsen S, Trojaborg W. Long-term neurotoxicity in patients treated with cisplatin, vinblastine, and bleomycin for metastatic germ cell cancer. J Clin Oncol. 1989;7:1457–1461. doi: 10.1200/JCO.1989.7.10.1457. [DOI] [PubMed] [Google Scholar]
- Harrison RT, DeBacker JR, Bielefeld EC. A low-dose regimen of cisplatin before high-dose cisplatin potentiates ototoxicity. Laryngoscope. 2015;125:E78–E83. doi: 10.1002/lary.24948. [DOI] [PubMed] [Google Scholar]
- Harrison RT, Seiler BM, Bielefeld EC. Ototoxicity of 12 mg/kg cisplatin in the Fischer 344/NHsd rat using multiple dosing strategies. Anti-Cancer Drugs. 2016;27:780–786. doi: 10.1097/CAD.0000000000000395. [DOI] [PubMed] [Google Scholar]
- Hayes D, Cvitkovic E, Colbey R, Schreiner E, Helson L, Krakoff J. High dose cis-platinum diammine dichloride. Cancer. 1977;39:1372–1381. doi: 10.1002/1097-0142(197704)39:4<1372::AID-CNCR2820390404>3.0.CO;2-J. [DOI] [PubMed] [Google Scholar]
- Hinojosa R, Riggs LC, Strauss M, Matz GJ. Temporal bone histopathology of cisplatin ototoxicity. Am J Otol. 1995;16:731–740. [PubMed] [Google Scholar]
- Jessen KR, Mirsky R. Negative regulation of myelination: relevance for development, injury, and demyelinating disease. Glia. 2008;56:1552–1565. doi: 10.1002/glia.20761. [DOI] [PubMed] [Google Scholar]
- Kanat O, Ertas H, Caner B. Platinum-induced neurotoxicity: a review of possible mechanisms. World J Clin Oncol. 2017;8:329–335. doi: 10.5306/wjco.v8.i4.329. [DOI] [PMC free article] [PubMed] [Google Scholar]
- Karasawa T, Steyger PS. An integrated view of cisplatin-induced nephrotoxicity and ototoxicity. Toxicol Lett. 2015;237:219–227. doi: 10.1016/j.toxlet.2015.06.012. [DOI] [PMC free article] [PubMed] [Google Scholar]
- Knight KRG, Kraemer DF, Neuwelt EA. Ototoxicity in children receiving platinum chemotherapy: underestimating a commonly occurring toxicity that may influence academic and social development. J Clin Oncol. 2005;23:8588–8596. doi: 10.1200/JCO.2004.00.5355. [DOI] [PubMed] [Google Scholar]
- Komune S, Asakuma S, Snow JB., Jr Pathophysiology of the ototoxicity of cis-diamminedichloroplatinum. Otolaryngol Head Neck Surg. 1981;89:275–282. doi: 10.1177/019459988108900226. [DOI] [PubMed] [Google Scholar]
- Kujawa SG, Liberman MC (2009) Adding insult to injury: cochlear nerve degeneration after "temporary" noise-induced hearing loss. J Neurosci. 29(45):14077–14085 [DOI] [PMC free article] [PubMed]
- Laurell G, Bagger-Sjöbäck D. Degeneration of the organ of Corti following intravenous administration of cisplatin. Acta Otolaryngol. 1991;111:891–898. doi: 10.3109/00016489109138427. [DOI] [PubMed] [Google Scholar]
- Lautermann J, Crann SA, McLaren J, Schacht J. Glutathione-dependent antioxidant systems in the mammalian inner ear: effects of aging, ototoxic drugs and noise. Hear Res. 1997;114:75–82. doi: 10.1016/S0378-5955(97)00154-8. [DOI] [PubMed] [Google Scholar]
- Lee J, Gravel M, Zhang R, Thibault P, Braun PE. Process outgrowth in oligodendrocytes is mediated by CNP, a novel microtubule assembly myelin protein. J Cell Biol. 2005;170:661–673. doi: 10.1083/jcb.200411047. [DOI] [PMC free article] [PubMed] [Google Scholar]
- Lee Y-C, Soong B-W, Liu Y-T, Lin K-P, Kao K-P, Wu Z-A. Median nerve motor conduction velocity is concordant with myelin protein zero gene mutation. J Neurol. 2005;252:151–155. doi: 10.1007/s00415-005-0621-6. [DOI] [PubMed] [Google Scholar]
- Liberman MC, Kujawa SG (2017) Cochlear synaptopathy in acquired sensorineural hearing loss: Manifestations and mechanisms. Hear Res 349:138–147 [DOI] [PMC free article] [PubMed]
- Lee Y-J, Lee GJ, Yi SS, Heo S-H, Park C-R, Nam H-S, Cho M-K, Lee S-H. Cisplatin and resveratrol induce apoptosis and autophagy following oxidative stress in malignant mesothelioma cells. Food Chem Toxicol. 2016;97:96–107. doi: 10.1016/j.fct.2016.08.033. [DOI] [PubMed] [Google Scholar]
- Lobarinas E, Salvi R, Ding D. Insensitivity of the audiogram to carboplatin induced inner hair cell loss in chinchillas. Hear Res. 2013;302:113–120. doi: 10.1016/j.heares.2013.03.012. [DOI] [PMC free article] [PubMed] [Google Scholar]
- Lynch ED, Gu R, Pierce C, Kil J. Combined oral delivery of ebselen and allopurinol reduces multiple cisplatin toxicities in rat breast and ovarian cancer models while enhancing anti-tumor activity. Anti-Cancer Drugs. 2005;16:569–579. doi: 10.1097/00001813-200506000-00013. [DOI] [PubMed] [Google Scholar]
- Madasu R, Ruckenstein M, Leake F, Steere E, Robbins K. Ototoxic effects of supradose cisplatin with sodium thiosulfate neutralization in patients with head and neck cancer. Arch Otolaryngol Head Neck Surg. 1997;123:978–981. doi: 10.1001/archotol.1997.01900090094014. [DOI] [PubMed] [Google Scholar]
- McMillan GP, Konrad-Martin D, Dille MF. Accuracy of distortion-product otoacoustic emissions-based ototoxicity monitoring using various primary frequency step-sizes. Int J Audiol. 2012;51:689–696. doi: 10.3109/14992027.2012.688143. [DOI] [PMC free article] [PubMed] [Google Scholar]
- Mukherjea D, Rybak LP (2011) Pharmacogenomics of cisplatin-induced ototoxicity. Pharmacogenomics 12(7):1039–1050 [DOI] [PMC free article] [PubMed]
- Muniak MA, Rivas A, Montey KL, May BJ, Francis HW, Ryugo DK. 3D model of frequency representation in the cochlear nucleus of the CBA/J mouse. J Comp Neurol. 2013;521:1510–1532. doi: 10.1002/cne.23238. [DOI] [PMC free article] [PubMed] [Google Scholar]
- Ohlemiller KK, Wright JS, Heidbreder AF. Vulnerability to noise-induced hearing loss in ‘middle-aged’and young adult mice: a dose–response approach in CBA, C57BL, and BALB inbred strains. Hear Res. 2000;149:239–247. doi: 10.1016/S0378-5955(00)00191-X. [DOI] [PubMed] [Google Scholar]
- Ohlemiller KK, McFadden SL, Ding D-L, Lear PM, Ho Y-S. Targeted mutation of the gene for cellular glutathione peroxidase (Gpx1) increases noise-induced hearing loss in mice. J Assoc Res Otolaryngol. 2000;1:243–254. doi: 10.1007/s101620010043. [DOI] [PMC free article] [PubMed] [Google Scholar]
- Podratz JL, Knight AM, Ta LE, Staff NP, Gass JM, Genelin K, Schlattau A, Lathroum L, Windebank AJ. Cisplatin induced mitochondrial DNA damage in dorsal root ganglion neurons. Neurobiol Dis. 2011;41:661–668. doi: 10.1016/j.nbd.2010.11.017. [DOI] [PMC free article] [PubMed] [Google Scholar]
- Podratz JL, Lee H, Knorr P, Koehler S, Forsythe S, Lambrecht K, Arias S, Schmidt K, Steinhoff G, Yudintsev G. Cisplatin induces mitochondrial deficits in Drosophila larval segmental nerve. Neurobiol Dis. 2017;97:60–69. doi: 10.1016/j.nbd.2016.10.003. [DOI] [PMC free article] [PubMed] [Google Scholar]
- R Core Team (2019) R: A language and environment for statistical computing. In: R Foundation for Statistical Computing, Vienna, Austria URL https://www.R-project.org/
- Ravi R, Somani SM, Rybak LP. Mechanism of cisplatin ototoxicity: antioxidant system. Pharmacol Toxicol. 1995;76:386–394. doi: 10.1111/j.1600-0773.1995.tb00167.x. [DOI] [PubMed] [Google Scholar]
- Reavis KM, Phillips DS, Fausti SA, Gordon JS, Helt WJ, Wilmington D, Bratt GW, Konrad-Martin D. Factors affecting sensitivity of distortion-product otoacoustic emissions to ototoxic hearing loss. Ear Hear. 2008;29:875–893. doi: 10.1097/AUD.0b013e318181ad99. [DOI] [PubMed] [Google Scholar]
- Reddel R, Kefford R, Grant J, Coates A, Fox T, Tattersall M. Ototoxicity in patients receiving cisplatin: importance of dose and method of drug administration. Cancer Treat Rep. 1982;66:19–23. [PubMed] [Google Scholar]
- Roy S, Ryals MM, Van den Bruele AB, Fitzgerald TS, Cunningham LL. Sound preconditioning therapy inhibits ototoxic hearing loss in mice. J Clin Invest. 2013;123:4945–4949. doi: 10.1172/JCI71353. [DOI] [PMC free article] [PubMed] [Google Scholar]
- Rybak LP, Whitworth CA, Mukherjea D, Ramkumar V. Mechanisms of cisplatin-induced ototoxicity and prevention. Hear Res. 2007;226:157–167. doi: 10.1016/j.heares.2006.09.015. [DOI] [PubMed] [Google Scholar]
- Rybak LP, Mukherjea D, Ramkumar V (2019) Mechanisms of cisplatin-induced ototoxicity and prevention. Seminars in hearing, Vol. 40. Thieme Medical Publishers. Pp. 197-204 [DOI] [PMC free article] [PubMed]
- Sheth S, Mukherjea D, Rybak LP, Ramkumar V. Mechanisms of cisplatin-induced ototoxicity and otoprotection. Front Cell Neurosci. 2017;11:338. doi: 10.3389/fncel.2017.00338. [DOI] [PMC free article] [PubMed] [Google Scholar]
- Stavroulaki P, Apostolopoulos N, Segas J, Tsakanikos M, Adamopoulos G. Evoked otoacoustic emissions—an approach for monitoring cisplatin induced ototoxicity in children. Int J Pediatr Otorhinolaryngol. 2001;59:47–57. doi: 10.1016/S0165-5876(01)00455-4. [DOI] [PubMed] [Google Scholar]
- Taioli F, Cabrini I, Cavallaro T, Acler M, Fabrizi GM. Inherited demyelinating neuropathies with micromutations of peripheral myelin protein 22 gene. Brain. 2011;134:608–617. doi: 10.1093/brain/awq374. [DOI] [PubMed] [Google Scholar]
- Tang J, Qian Y, Li H, Kopecky BJ, Ding D, Ou HC, DeCook R, Chen X, Sun Z, Kobel M. Canertinib induces ototoxicity in three preclinical models. Hear Res. 2015;328:59–66. doi: 10.1016/j.heares.2015.07.002. [DOI] [PMC free article] [PubMed] [Google Scholar]
- Taveggia C. Schwann cells–axon interaction in myelination. Curr Opin Neurobiol. 2016;39:24–29. doi: 10.1016/j.conb.2016.03.006. [DOI] [PubMed] [Google Scholar]
- van Ruijven MWM, de Groot JCMJ, Klis SFL, Smoorenburg GF (2005) The cochlear targets of cisplatin: An electrophysiological and morphological time-sequence study. Hear Res 205(1-2):241–248 [DOI] [PubMed]
- van Zeijl G, Conijn E, Rodenburg M, Tange R, Brocaar M. Analysis of hearing loss due to cis-diamminedichloroplatinum-II. Arch Oto-Rhino-Laryngol. 1984;239:255–262. doi: 10.1007/BF00464252. [DOI] [PubMed] [Google Scholar]
- Velasco R, Bruna J, Briani C, Argyriou AA, Cavaletti G, Alberti P, Frigeni B, Cacciavillani M, Lonardi S, Cortinovis D. Early predictors of oxaliplatin-induced cumulative neuropathy in colorectal cancer patients. J Neurol Neurosurg Psychiatry. 2014;85:392–398. doi: 10.1136/jnnp-2013-305334. [DOI] [PubMed] [Google Scholar]
- Waissbluth S, Peleva E, Daniel SJ. Platinum-induced ototoxicity: a review of prevailing ototoxicity criteria. Eur Arch Otorhinolaryngol. 2017;274:1187–1196. doi: 10.1007/s00405-016-4117-z. [DOI] [PubMed] [Google Scholar]
- Wan G, Corfas G. Transient auditory nerve demyelination as a new mechanism for hidden hearing loss. Nat Commun. 2017;8:14487. doi: 10.1038/ncomms14487. [DOI] [PMC free article] [PubMed] [Google Scholar]
- Wu Y, Ma Y, Liu Z, Geng Q, Chen Z, Zhang Y (2017) Alterations of myelin morphology and oligodendrocyte development in early stage of Alzheimer’s disease mouse model. Neurosci Lett 642:102–106 [DOI] [PubMed]


