Summary
A clearer understanding of the tumor immune microenvironment (TIME) in metastatic clear cell renal cell carcinoma (ccRCC) may help to inform precision treatment strategies. We sought to identify clinically meaningful TIME signatures in ccRCC. We studied tumors from 39 patients with metastatic ccRCC using quantitative multiplexed immunofluorescence and relevant immune marker panels. Cell densities were analyzed in three regions of interest (ROIs): tumor core, tumor–stroma interface and stroma. Patients were stratified into low‐ and high‐marker density groups using median values as thresholds. Log‐rank and Cox regression analyses while controlling for clinical variables were used to compare survival outcomes to patterns of immune cell distributions. There were significant associations with increased macrophage (CD68+CD163+CD206+) density and poor outcomes across multiple ROIs in primary and metastatic tumors. In primary tumors, T‐bet+ T helper type 1 (Th1) cell density was highest at the tumor–stromal interface (P = 0·0021), and increased co‐expression of CD3 and T‐bet was associated with improved overall survival (P = 0·015) and survival after immunotherapy (P = 0·014). In metastatic tumor samples, decreased forkhead box protein 3 (FoxP3)+ T regulatory cell density correlated with improved survival after immunotherapy (P = 0·016). Increased macrophage markers and decreased Th1 T cell markers within the TIME correlated with poor overall survival and treatment outcomes. Immune markers such as FoxP3 showed consistent levels across the TIME, whereas others, such as T‐bet, demonstrated significant variance across the distinct ROIs. These findings suggest that TIME profiling outside the tumor core may identify clinically relevant associations for patients with metastatic ccRCC.
Keywords: immune cell markers, immunotherapy, matched pairs, metastatic renal cell carcinoma, T‐bet, tumor immune microenvironment, tumor‐associated macrophages
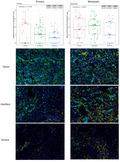
A better understanding of the tumor immune microenvironment may serve as a critical step in advancing precision treatment strategies. We analyzed tumors from patients with metastatic clear cell renal cell carcinoma using quantitative multiplexed immunofluorescence and relevant immune cell markers in three separate regions of interest. Our results demonstrate that patterns of immune cell spatial distribution across microenvironment compartments in primary and metastatic tumors correlate with meaningful clinical outcomes.
Introduction
Approximately 30% of patients with renal cell carcinoma have metastatic disease at diagnosis, and 20–30% of patients with localized tumors who are treated with curative intent will eventually develop metastatic disease [1]. Unfortunately, renal cell carcinoma is highly resistant to both chemotherapy and radiation therapy, and the 5‐year overall survival rate of patients with metastatic renal cell carcinoma is only 12% [2]. However, the results of recent clinical trials have expanded the treatment landscape for metastatic renal cell carcinoma to include immune checkpoint inhibitors, multi‐targeted tyrosine kinase inhibitors and novel combination therapies, which have produced unprecedented results among certain patients with previously unresponsive metastatic disease [3, 4].
Despite the rapid increase of available agents used to treat metastatic renal cell carcinoma, there remains a lack of comparative information and measurable biological indicators to help clinicians select the best sequences and combinations of agents for individual patients. Researchers have begun searching for prognostic clues within the tumor immune microenvironment (TIME) – a complex and dynamic network of extracellular matrices, stromal cells and immune/inflammatory cells at the interface between a malignant tumor and surrounding stromal tissue [5, 6, 7, 8]. One such marker that has been identified is programmed death receptor ligand 1 (PD‐L1), a ligand that is expressed on the surface of tumor cells. Unfortunately, the quantification of this solitary ligand has not proved to be a reliable predictor of treatment response in the metastatic renal cell carcinoma TIME [8, 9]. There is emerging evidence, however, to suggest that other patterns of tumor‐associated macrophage (TAM) and T cell infiltration may better correlate with treatment responses [3, 6, 7, 10].
Although immune marker profiles have been well described in other malignancies (i.e. gastrointestinal cancer, lung cancer and melanoma), there are limited studies focused on the TIME in primary and metastatic renal cell carcinoma tumors. Furthermore, many prior studies are limited by their use of macrodissection and bulk sequencing approaches, which rely upon mined data from previous tumor‐centric analyses, to describe TIME heterogeneity and to explain tumor–immune cell interactions [11]. These methods are prone to exclude potentially significant biological information that exists in the tumor–stroma interface and surrounding stroma.
To gain a more detailed insight into the immunophenotypes of metastatic renal cell carcinoma, we separately examined three regions of interest (ROIs): the tumor core, the tumor–stroma interface and the surrounding stroma in primary and metastatic tumors. We hypothesized that specific immune spatial profiles correlate with meaningful clinical outcomes.
Materials and methods
Patients and clinical samples
Following institutional review board approval, we analyzed pretreatment tumor tissue specimens that were prospectively collected from patients enrolled into H. Lee Moffitt Cancer Center and Research Institute’s Total Cancer Care protocol (MCC no. 14690; Advarra IRB Pro00014441) from 2004 to 2018. Patients were included in this study if they (1) were diagnosed with metastatic clear cell renal cell carcinoma; (2) provided written consent to the molecular characterization of their tissue; and (3) received some form of immunotherapy [interleukin‐2 (IL‐2), atezolizumab, nivolumab, pembrolizumab or ipilimumab] following tissue collection. In line with clinical treatment algorithms for clear cell renal cell carcinoma, many patients (n = 30 of 39) also received targeted therapy (pazopanib, axitinib, sorafenib, sunitinib, everolimus, cabozantinib, bevacizumab) at some point during their treatment course. All tumor tissue was obtained via surgical excision (i.e. biopsy tissue was not included). A total of 39 patients with 58 available tissue samples, including 29 primary tumors and 29 metastatic tumors, were analyzed. Paired primary and metastatic tumor tissues from 11 patients were available.
Multiplex immune panel procedure
To prepare the tissue blocks, an expert genitourinary pathologist (J.D.) reviewed each formalin‐fixed paraffin‐embedded tissue sample and annotated three separate ROIs: tumor core (100% tumor tissue), tumor–stromal interface (approximately 50% tumor and 50% stroma tissue, hereby referred to as ‘interface’) and stroma (100% stromal tissue). Tissue blocks that did not contain stromal elements were not chosen for this analysis. Tissue samples were then immunostained using the PerkinElmer OPAL 7‐color automation immunohistochemistry (IHC) kit (PerkinElmer, Waltham, MA, USA) on the BOND RX Autostainer (Leica Biosystems, Vista, CA, USA). In brief, tissue slides were sequentially stained in two panels using antibodies against CD3 (Thermo Fisher, Waltham, MA, USA: SP7, 1 : 200), CD8 (Dako, Carpenteria, CA, USA: CD8/144B, 1 : 600), CD68 (Cell Signaling Technology, Danvers, MA, USA: D4B9C, 1 : 300), CD163 (Abcam, Cambridge, MA, USA: OTI2G12, 1 : 100), CD206 (Abcam: polyclonal, 1:400), forkhead box protein 3 (FoxP3) (Abcam: 236/E7, 1:400), T‐box protein expressed in T cells (T‐bet) (Cell Signaling Technology, Beverly, MA, USA: D6N8B, 1 : 50) and PD‐L1 (Cell Signaling Technology: E1L3N, 1 : 200). All subsequent steps, including deparaffinization, antigen retrieval and staining, were performed using the OPAL IHC manufacturer’s protocol. Pan‐cytokeratin (Thermo Fisher) and 4′,6‐diamidino‐2‐phenylindole (DAPI) (Thermo Fisher) counterstaining were applied to all slides, and imaging was performed using the Vectra3 Automated Quantitative Pathology Imaging System (Akoya Biosciences, Menlo Park, CA, USA).
Quantitative image analyses
Multi‐layer TIFF images were exported from InForm (Akoya Biosciences) and loaded into HALO (Indica Laboratories, Albuquerque, NM, USA) for quantitative image analyses. Pan‐cytokeratin was used to train tumor regions, and a total cell classifier was created and tested on various ROIs in the image set. For each staining marker a positivity threshold within the nucleus or cytoplasm was set, and the entire image set was analyzed. The generated data included positive cell counts of each fluorescent marker and the percentage of cells that were positive for the marker. The data were sorted according to the ROI classification. The tumor core ROIs were selected based on sufficient tumor cellularity characterized by 100% tumor cells by morphology and pan‐cytokeratin expression, the interface ROI by 40–50% tumor cells by morphology and pan‐cytokeratin expression and the stromal ROI by 0% tumor cells by morphology and pan‐cytokeratin expression. The size of the ROIs was standardized at 1356 × 1012 pixels, with a resolution of 0·5 μm/pixel for a total surface area of 0·343 mm2. In addition to the summary output, a per‐cell analysis was exported to provide the marker status, classification and fluorescent intensities of every individual cell within each image.
Statistical analyses
Statistical analyses were performed using R program version 3.6.1 (Vienna, Austria). The Friedman test was used to compare immune cell densities among the different ROIs, and a linear mixed‐model analysis was completed to compare these densities between primary tumor and metastatic tumor specimens. The Kaplan–Meier curve method was used to estimate a survival distribution, and the log‐rank test was performed to compare survival distributions after stratifying patients into groups of high‐ or low‐density levels on the basis of the median of individual markers as a cut‐off. Multivariable Cox proportional hazards regression analyses were also performed to compute the hazard ratio of a quantitative marker density for risk of death while controlling for age, gender and International Metastatic Renal Cell Carcinoma Database Consortium risk score [12].
Results
Patterns of immune cell distribution across separate ROIs
Patient demographic and clinical characteristics, including the distribution of tissue collection sites, are listed in Table 1. In each tissue sample, we measured differences in the distributions of CD3+ T cells, CD8+ cytotoxic T cells, FoxP3+ T regulatory cells, T‐bet+ T helper type 1 (Th1) cells, CD68+ pan‐macrophages, CD163+ type 2 macrophages (M2), CD206+ M2 macrophages and PD‐L1+ immune inhibitory pathway markers. We observed higher densities of CD68+ macrophages within the tumor core and at the interface than in the surrounding stroma in primary (Fig. 1a) and metastatic tumors (P < 0·05). In contrast, levels of FoxP3+ T regulatory cells were equally distributed across all the three ROIs in primary tumors (Fig. 1b). The interface was enriched with T‐bet+ Th1 cells compared to the tumor core and surrounding stroma in primary (Figb 1c) and metastatic tumors (P < 0·05).
Table 1.
Demographics and baseline clinical characteristics of patients with metastatic clear cell renal cell carcinoma (n = 39) and sites of tissue collection (n = 58)
| Variable | Total |
|---|---|
| Median age at diagnosis, years | 56 (36–77) |
| Median follow‐up after diagnosis, months | 53 (6–177) |
| Median maximal tumor dimension, cm | 9·2 (2·5–16·2) |
| Gender | |
| Male | 24 |
| Female | 15 |
| Race | |
| White | 37 |
| Asian | 1 |
| Black | 0 |
| Other | 1 |
| Fuhrman nuclear grade | |
| 2 | 4 |
| 3 | 21 |
| 4 | 14 |
| Laterality | |
| Right | 24 |
| Left | 15 |
| pT † | |
| T1 | 3 |
| T2 | 7 |
| T3 | 25 |
| T4 | 4 |
| pN † | |
| N0 | 14 |
| N1 | 25 |
| pM † | |
| M0 | 15 |
| M1 | 24 |
| IMDC risk category* | |
| Favorable‐risk (0 criteria) | 0 |
| Intermediate‐risk (1–2 criteria) | 23 |
| Poor‐risk (≥ 3 criteria) | 16 |
| Immunotherapy courses received** | |
| Interleukin‐2 | 24 |
| Nivolumab | 10 |
| Pembrolizumab | 7 |
| Targeted therapy courses received** | |
| Pazopanib | 17 |
| Axitinib | 13 |
| Sorafenib | 13 |
| Sunitinib | 10 |
| Everolimus | 7 |
| Cabozantinib | 6 |
| Bevacizumab | 3 |
| Tissue specimen collection site | |
| Kidney | 28 |
| Skin/soft tissue | 4 |
| Retroperitoneum | 3 |
| Lung | 2 |
| Adrenal | 1 |
| Bone | 1 |
ccRCC = clear cell renal cell carcinoma; IMDC = International Metastatic RCC Database Consortium.
Pathological staging is based on the time of initial nephrectomy or metastasectomy. All patients in this study (n = 39) developed metastatic disease during their treatment course.
IMDC risk score is relevant to mRCC patients undergoing systemic therapy, and several ongoing trials are using this model in prospective studies. The criteria include: less than 1 year from time of diagnosis to systemic therapy, Karnofsky performance status < 80%, hemoglobin < lower limit of normal, calcium > upper limit of normal, neutrophil count > upper limit of normal and platelet count > upper limit of normal.
Includes types of therapy spanning from first‐ to fifth‐line treatments.
Fig. 1.
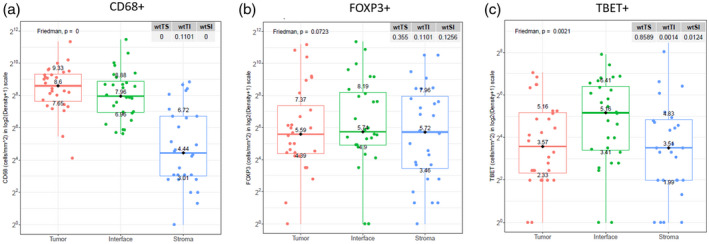
Differences in the distribution of immune cell markers across regions of interest in primary tumors.
Differences in immune cell distribution between primary and metastatic tumors
Among all primary and metastatic clear cell renal cell carcinoma tumors, the interface had the most differences in patterns of immune cell distributions (Fig. 2). There were significantly higher densities of T‐bet+ Th1 cells, CD163+ M2 macrophages and CD206+ M2 macrophages at the interface of metastatic sites than in primary tumor samples (all P‐values < 0·05). Furthermore, the co‐expression of macrophage markers CD68 and CD163 was significantly higher in metastatic tumors than in primary tumors (Fig. 3), and there were higher densities of T‐bet+ Th1 cells and CD206+ M2 macrophages in the tumor core and surrounding stroma of metastatic tumors than in that of primary tumors (all P‐values < 0·05). Eleven patients had matching primary and metastatic tumor tissue; among these matched pairs, there was no statistically significant tumor heterogeneity in immune profiles. Although PD‐L1 marker densities tended to be higher in metastatic sites than in primary tumors, this imbalance did not reach statistical significance (P = 0·06) (Supporting information, Table S1 and Fig. S1).
Fig. 2.
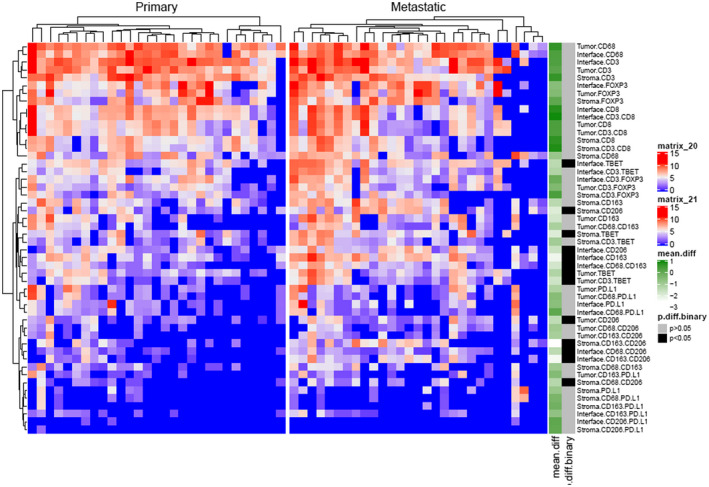
Heat‐map showing differences in immune cell marker density between primary and metastatic tumors.
Fig. 3.
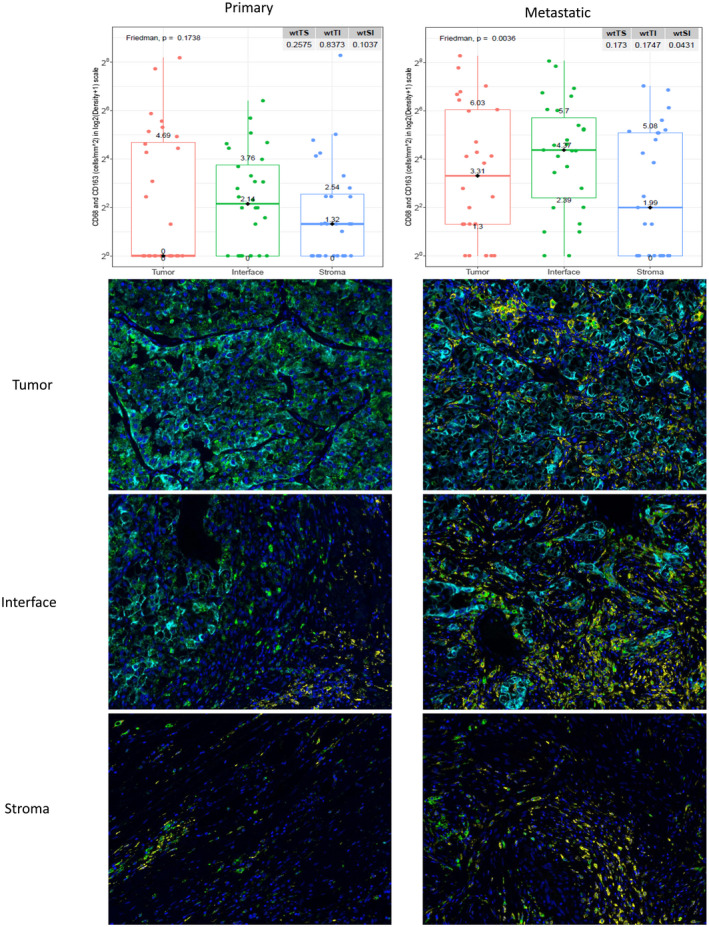
Differences in CD68+CD163+ macrophage marker (yellow) distribution across three regions of interest shown on immunofluorescence and box‐plot graphs.
Clinical correlations between immune cell distribution and survival
Overall survival and survival following the initiation of immunotherapy were compared with the patients’ spatial TIME marker profiles. There was a significant association between increased CD68+ macrophage density and decreased overall survival and survival after immunotherapy across all ROIs in primary tumors (Fig. 4a–c). In primary tumor tissue, high levels of T‐bet+ Th1 cells in the interface (Fig. 5) and high co‐expression of CD3 and T‐bet across all ROIs were associated with significantly improved survival following the initiation of immunotherapy. There was delayed separation of the Kaplan–Meier survival curves for patients with high and low levels of T‐bet+ Th1 cells at the interface (Fig. 5) compared to an immediate separation of Kaplan–Meier survival curves observed when considering in CD68 and FoxP3 markers (Fig. 4). In metastatic tumor samples, decreased FoxP3+ T regulatory cell density correlated with improved survival after immunotherapy across all ROIs (Fig. 4d–f). Furthermore, increased co‐expression of PD‐L1 and CD68 in the tumor core and surrounding stroma correlated with worse overall survival and survival after immunotherapy (Supporting information, Fig. S2). Among patients who received targeted therapy during their treatment course, decreased tumor core and interface T regulator cell and macrophage marker densities, as well as decreased stromal macrophage and PD‐L1 marker densities, were associated with improved outcomes (details of immune marker associations for this analysis can be found in Supporting information, Fig. S3).
Fig. 4.
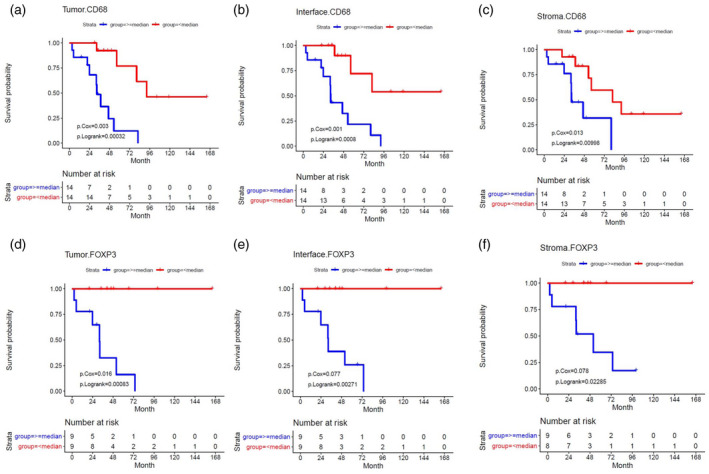
Correlations with marker density and survival following immunotherapy for CD68 in primary tumors and forkhead box protein 3 (FoxP3) in metastatic tumors estimated using Cox regression and Kaplan–Meier analyses
Fig. 5.
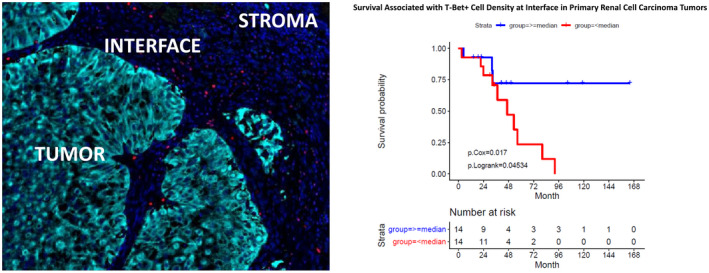
Distribution of T‐box protein expressed in T cells (T‐bet)+ cells (red) at the pan‐cytokeratin‐stained tumor‐ (cyan) and 4′,6‐diamidino‐2‐phenylindole (DAPI)‐stained stroma (dark blue) interface shown on immunofluorescence and correlation with survival after first dose of immunotherapy estimated using Kaplan–Meier survival analyses.
Discussion
We examined the spatial TIME of relevant immune cell markers in metastatic clear cell renal cell carcinoma by characterizing and analyzing the tissue staining of three distinct ROIs. In primary tumors the distribution of T‐bet+ Th1 cells was highest at the interface, and FoxP3+ T regulatory cell density was equal among all three ROIs. Furthermore, we observed that patterns of spatial distribution correlated with clinical outcomes. Across all ROIs in primary tumors, an increase in CD3+/T‐bet+ Th1 cells was correlated with improved survival after immunotherapy, whereas an increase in macrophage (CD68+CD163+CD206+) cell density was associated with poor outcomes across all ROIs in primary and metastatic tumors.
Our results highlight significant associations between clinical outcomes and spatial distributions of macrophages within the TIME. The densities of pan‐macrophage marker CD68 and M2 markers CD163 and CD206 were significantly higher in metastatic tumors than in primary tumors. Higher densities of macrophages within the tumor core, interface and the surrounding stroma were each independently correlated with decreased overall survival and survival following immunotherapy. TAMs are known to be strong tumor‐supporting cells that accelerate tumor progression and limit responses to anti‐tumor immunity through the production of immunosuppressive cytokines, pro‐angiogenic factors and metalloproteases [7]. In a secondary exploratory analysis of archival tissue from metastatic renal cell carcinoma patients enrolled into the COMPARZ Phase III trial, Hakimi et al. found macrophage infiltration to be a powerful predictor of response to tyrosine kinase‐targeted therapy [6]. Our results support this finding, as we observed inferior survival after targeted therapy in a subset of patients with high macrophage immune marker densities (i.e. CD68 and CD163).
An interesting finding in our analysis was co‐expression of CD68 and PD‐L1 correlated with worse overall survival and survival after immunotherapy, whereas in non‐small‐cell lung cancer patients, increased CD68+/PD‐L1+ macrophage density was associated with prolonged overall survival [13]. This paradoxical finding adds to the accumulating evidence that immune infiltration patterns in renal cell carcinoma are distinct from those in other solid tumor types [14]. Our study is the first, to our knowledge, to use quantitative immunofluorescence to characterize TAM infiltration patterns in the TIME of clear cell renal cell carcinoma and their correlation with clinical outcomes. Emerging strategies that target TAMs, including TAM depletion, blockade of monocyte/macrophage recruitment and neutralizing TAM products, may be particularly beneficial for patients with macrophage‐enriched metastatic renal cell carcinoma TIME infiltration [15].
T‐bet is an important transcription factor that is responsible for orchestrating type 1 immune cell differentiation. We found that T‐bet+ Th1 cells were enriched at the interface and that increased levels of T‐bet+ Th1 cells at this location, in addition to the co‐expression of CD3 and T‐bet across all ROIs, were associated with significantly improved survival rates following the initiation of immunotherapy. In a multi‐parametric analysis of the TIME in a cohort of patients with colorectal cancer, increased T‐bet+ tumor‐infiltrating lymphocyte density was associated with favorable overall survival and higher microsatellite instability [16]. Similarly, in oropharyngeal squamous cell carcinoma, high tumor core T‐bet+ T cell density was associated with prolonged rates of progression‐free survival [17]. Quantification of T‐bet+ T cells in the renal cell carcinoma TIME may prove to be a useful biomarker, given the clinical correlations we identified between CD3 and T‐bet marker density in both primary and metastatic tissue samples.
FoxP3 is a key intracellular transcription factor in the development and function of T regulatory cells. FoxP3+ T regulatory cells suppress host‐versus‐tumor immunity in the TIME through the inhibition of anti‐tumor cytotoxic T cells [18]. In our study, FoxP3+ T regulatory cells were evenly distributed across all three ROIs in primary tumors. Interestingly, increased levels of FoxP3 marker density in metastatic samples correlated with poor overall survival and survival following immunotherapy. Li et al. similarly observed that high levels of T regulatory cells in peritumoral areas were predictive of poor survival in renal cell carcinoma, whereas tumor core T regulatory cell density had no prognostic value [19]. In a study analyzing only renal cell carcinoma tumor core tissue, Siddiqui et al. also showed no correlation between tumor core T regulatory cell density and clinical outcomes [20]. Jensen et al. later reported a marked increase in tumor core FoxP3+ T cell density in patients who received IL‐2 treatment, and showed that this increase adversely correlated with overall survival [21]. These conflicting findings regarding the renal cell carcinoma TIME distribution of FoxP3+ cells may be explained by differences in the studies’ methods, sample sizes and cohort heterogeneity. Further investigations that clarify FoxP3 marker quantification in metastatic renal cell carcinoma are warranted.
The association between T cell infiltration and prognosis in clear cell renal cell carcinoma is highly nuanced. Contrasting with other primary sites and histologies, increasing CD8+ infiltration in clear cell renal cell carcinoma is not associated with improved survival or response to immunotherapy, and is often found to confer a worse prognosis [22, 23, 24, 25]. The reason for this is probably related to the functional capacity of these cells and the broader context of the TIME surrounding them. Granier et al. identified a subset of PD1+CD8+ infiltrating T cells with high Tim‐3 expression in renal cell carcinoma tumors that were associated with significantly worse survival and exhibited impaired function after stimulation, suggesting that high Tim‐3 expression may be a surrogate for T cell exhaustion [24]. Giraldo et al. identified two unique subsets of CD8+ infiltrated renal cell carcinoma tumors: one with many immune checkpoints and absent mature dendritic cells (associated with worse prognosis), and one with few immune checkpoints but localization of mature dendritic cells in the TIME (associated with a good prognosis) [23]. Additionally, the prognostic impact of CD4+ infiltration of renal cell carcinoma tumors seems to be apparent only through stratification into specific subgroups of memory or regulatory T cells [20, 25]. Our analysis further emphasizes that that the association between T cell infiltration and prognosis in clear cell renal cell carcinoma is not straightforward, and seems to be dependent upon specific T cell subtypes and the TIME in which these cells exist.
Until recently, most efforts to identify clinically relevant biomarkers were limited to analyses focused only on tumor core tissue. This focus was based on the belief that the most telling information about a tumor resides in the tumor cells themselves. However, we now have a better appreciation of spatially distinct TIMEs and clonal evolutions which may drive inter‐ and intrapatient tumor heterogeneity, thereby leading to resistance from effective therapy [4, 6, 10, 11, 19, 20, 21, 26, 27]. In the context of cancer immunotherapy, in which treatments are based on the manipulation of immune cells, we were compelled to expand our understanding of the TIME beyond the tumor core. In fact, in our analysis we identified more clinical associations with survival and immune cell density patterns in the surrounding stroma (n = 17) than within tumor core tissue (n = 13). Concurrently, in a recently published multi‐dimensional interrogation of breast cancer histology, the authors also reported that certain stromal signatures, particularly those with high levels of vimentin, were independently associated with poorer progression‐free and overall survival [26]. Furthermore, we demonstrated that some markers (i.e. FoxP3) may be more reliable for deconvolution methods using bulk sequencing data, given the consistencies across multiple ROIs. We also showed that other makers (i.e. T‐bet) may require a more granular diagnostic approach owing to differences in distribution between the tumor core, interface and stroma.
Identifying immune markers with clinical correlations across multiple TIME sites within primary and metastatic tumors could lead to more robust biomarker candidates that are reproducible among different renal cell carcinoma cohorts. The most significant results of our study can easily be reproduced and put into clinical practice through the use of standard and practical IHC staining [28], which is already commonly employed to diagnose and treat clear cell renal cell carcinoma [29, 30].
There are several limitations of this study. For example, all tissue specimens were obtained via surgical excision; therefore, it is unknown whether these methods can be applied to core biopsies tissue at this time. Although many patients in our preliminary studies received immunotherapy, the dosing schedules and regimens used were heterogeneous and are not reflective of the current treatment landscape. Due to the intermixture of treatment types, regimens and sequencing in a limited cohort of patients, we were unable to perform statistically robust subgroup analyses for individual therapies. Furthermore, although we observed clinical correlations with immune density infiltration patterns and survival following targeted therapy in a small subgroup of patients, the study was designed to analyze survival outcomes following immunotherapy; therefore, the targeted therapy correlations should be interpreted as hypothesis‐generating. Finally, there is a potential for selection bias given the retrospective nature of this study.
Some limitations of our study are justifiable. The use of median values as cut‐offs for assigning high‐ and low‐density immune cell antibody staining distributions may be considered a limitation; however, optimal threshold values have yet to be widely established and, as such, median cut‐off levels have been commonly used in scientific literature. We did not observe significant associations between CD8+ T cell infiltration patterns and survival; however, our study was not designed to detect differences in the many phenotypically distinct subsets of CD8+ lymphocytes [31].
Conclusions
Increased macrophage markers and decreased Th1 T cell markers within the TIME correlated with poor overall survival and treatment outcomes. Some immune markers, such as FoxP3, showed consistent levels across the TIME and others, such as T‐bet, demonstrated significant variance across the distinct ROIs. These results may aid our interpretation of immune profiling through commonly employed tumor‐centric deconvolution methods. Additionally, our findings suggest that TIME profiling outside the tumor core may be used to identify clinically relevant associations for patients with metastatic clear cell renal cell carcinoma.
Disclosures
The corresponding author certifies that all conflicts of interest, including specific financial interests and relationships and affiliations relevant to the subject matter or materials discussed in the manuscript (i.e. employment/affiliation, grants or funding, consultancies, honoraria, stock ownership or options, expert testimony, royalties, or patents filed, received or pending), are the following: A. H., A. M. A., L. Z., J. N., J. M. L., J. C., S. Z., S. F., M. F., J. K. T., J. D., S. M., C. M., E. N. K., W. J. S., Y. K. and B. J. M. have no disclosures; P. E. S. is NCCN Bladder and Penile Cancer Panel Member and Vice‐Chair; J. M. is an Associate Center Director at Moffitt Cancer Center, has ownership interest in Fulgent Genetics, Inc., Aleta Biotherapeutics, Inc., Cold Genesys, Inc., Myst Pharma, Inc., and Tailored Therapeutics, Inc. and is a consultant/advisory board member for ONCoPEP, Inc., Cold Genesys, Inc., Morphogenesis, Inc., Mersana Therapeutics, Inc., GammaDelta Therapeutics, Ltd, Myst Pharma, Inc., Tailored Therapeutics, Inc., Verseau Therapeutics, Inc., Iovance Biotherapeutics, Inc., Vault Pharma, Inc., Noble Life Sciences Partners, Fulgent Genetics, Inc., UbiVac, LLC, Vycellix, Inc. and Aleta Biotherapeutics, Inc.
Supporting information
Fig. S1. Differences in immune cell marker distribution between matched primary tumors (green) and metastatic tumors (red) (n = 11).
Fig. S2. Correlations between coexpression of CD68 and PD‐L1 in the tumor core and stroma and overall survival following immunotherapy estimated using Cox regression and Kaplan‐Meier analyses.
Fig. S3. Correlations between marker density in the tumor core, interface, and stroma and overall survival following targeted therapy estimated using Cox regression and Kaplan‐Meier analyses.
Table S1. Differences in marker density between matched primary and metastatic tumors (n = 11).
Table S2. Differences in overall survival based on immune cell marker density according to location in primary and metastatic tumors (P < 0·05 is considered statistically significant).
Table S3. Differences in survival following immunotherapy based on immune cell marker density according to location in primary and metastatic tumors (P < 0·05 is considered statistically significant).
Acknowledgements
Editorial assistance was provided by the Moffitt Cancer Center’s Scientific Editing Department by Dr Paul Fletcher and Daley Drucker. No compensation was given beyond their regular salaries. This work was supported by the Urology Care Foundation Research Scholar Award Program and Society for Urologic Oncology (to B. J. M); the United States Army Medical Research Acquisition Activity Department of Defense (KC180139 to B. J. M); Total Cancer Care Protocol at Moffitt Cancer Center, which was enabled in part by the generous support of the DeBartolo Family; the Biostatistics and Bioinformatics Shared Resource at the H. Lee Moffitt Cancer Center and Research Institute, a National Cancer Institute designated Comprehensive Cancer Center (P30‐CA076292); and the Tissue Core Facility at the H. Lee Moffitt Cancer Center and Research Institute (P30‐CA076292). The content is solely the responsibility of the authors and does not necessarily represent the official views of the American Urological Association or the Urology Care Foundation.
Data Availability Statement
The data that support the findings of this study are available from the corresponding author upon reasonable request.
References
- 1. Kotecha RR, Motzer RJ, Voss MH. Towards individualized therapy for metastatic renal cell carcinoma. Nat Rev Clin Oncol 2019; 16:621–33. [DOI] [PubMed] [Google Scholar]
- 2. Cancer Facts & Figures 2019 . 2019. Available at: https://www.cancer.org/cancer/kidney‐cancer/detection‐diagnosis‐staging/survival‐rates.html (accessed 3 January 2020).
- 3. McDermott DF, Huseni MA, Atkins MB et al. Clinical activity and molecular correlates of response to atezolizumab alone or in combination with bevacizumab versus sunitinib in renal cell carcinoma. Nat Med 2018; 24:749–57. [DOI] [PMC free article] [PubMed] [Google Scholar]
- 4. Donskov F, Motzer RJ, Voog E et al. Outcomes based on age in the phase III METEOR trial of cabozantinib versus everolimus in patients with advanced renal cell carcinoma. Eur J Cancer 2019; 126:1–10. [DOI] [PMC free article] [PubMed] [Google Scholar]
- 5. George AP, Kuzel TM, Zhang Y, Zhang B. The discovery of biomarkers in cancer immunotherapy. Comput Struct Biotechnol J 2019; 17:484–97. [DOI] [PMC free article] [PubMed] [Google Scholar]
- 6. Hakimi AA, Voss MH, Kuo F et al. Transcriptomic profiling of the tumor microenvironment reveals distinct subgroups of clear cell renal cell cancer: data from a randomized phase III trial. Cancer Discov 2019; 9:510–25. [DOI] [PMC free article] [PubMed] [Google Scholar]
- 7. Kovaleva OV, Samoilova DV, Shitova MS, Gratchev A. Tumor associated macrophages in kidney cancer. Anal Cell Pathol 2016; 2016:9307549. [DOI] [PMC free article] [PubMed] [Google Scholar]
- 8. Callea M, Albiges L, Gupta M et al. Differential expression of PD‐L1 between primary and metastatic sites in clear‐cell renal cell carcinoma. Cancer Immunol Res 2015; 3:1158–64. [DOI] [PMC free article] [PubMed] [Google Scholar]
- 9. Kammerer‐Jacquet SF, Deleuze A, Saout J et al. Targeting the PD‐1/PD‐L1 pathway in renal cell carcinoma. Int J Mol Sci 2019; 20:1692. [DOI] [PMC free article] [PubMed] [Google Scholar]
- 10. Adotevi O, Pere H, Ravel P et al. A decrease of regulatory T cells correlates with overall survival after sunitinib‐based antiangiogenic therapy in metastatic renal cancer patients. J Immunother 2010; 33:991–8. [DOI] [PubMed] [Google Scholar]
- 11. Finotello F, Eduati F. Multi‐omics profiling of the tumor microenvironment: paving the way to precision immuno‐oncology. Front Oncol 2018; 8:430. [DOI] [PMC free article] [PubMed] [Google Scholar]
- 12. Heng DY, Xie W, Regan MM et al. Prognostic factors for overall survival in patients with metastatic renal cell carcinoma treated with vascular endothelial growth factor‐targeted agents: results from a large, multicenter study. J Clin Oncol 2009; 27:5794–9. [DOI] [PubMed] [Google Scholar]
- 13. Liu Y, Zugazagoitia J, Ahmed FS et al. Immune cell PD‐L1 colocalizes with macrophages and is associated with outcome in PD‐1 pathway blockade therapy. Clin Cancer Res 2020; 26:970–7. [DOI] [PMC free article] [PubMed] [Google Scholar]
- 14. Barnes TA, Amir E. HYPE or HOPE: the prognostic value of infiltrating immune cells in cancer. Br J Cancer 2017; 117:451–60. [DOI] [PMC free article] [PubMed] [Google Scholar]
- 15. Li X, Liu R, Su X et al. Harnessing tumor‐associated macrophages as aids for cancer immunotherapy. Mol Cancer 2019; 18:177. [DOI] [PMC free article] [PubMed] [Google Scholar]
- 16. Ott E, Bilonda L, Dansette D et al. The density of Tbet+ tumor‐infiltrating T lymphocytes reflects an effective and druggable preexisting adaptive antitumor immune response in colorectal cancer, irrespective of the microsatellite status. Oncoimmunology 2019; 8:e1562834. [DOI] [PMC free article] [PubMed] [Google Scholar]
- 17. Santegoets SJ, Duurland CL, Jordanova ES et al. Tbet‐positive regulatory T cells accumulate in oropharyngeal cancers with ongoing tumor‐specific type 1 T cell responses. J Immunother Cancer 2019; 7:14. [DOI] [PMC free article] [PubMed] [Google Scholar]
- 18. Shang B, Liu Y, Jiang SJ, Liu Y. Prognostic value of tumor‐infiltrating FoxP3+ regulatory T cells in cancers: a systematic review and meta‐analysis. Sci Rep 2015; 5:15179. [DOI] [PMC free article] [PubMed] [Google Scholar]
- 19. Li JF, Chu YW, Wang GM et al. The prognostic value of peritumoral regulatory T cells and its correlation with intratumoral cyclooxygenase‐2 expression in clear cell renal cell carcinoma. BJU Int 2009; 103:399–405. [DOI] [PubMed] [Google Scholar]
- 20. Siddiqui SA, Frigola X, Bonne‐Annee S et al. Tumor‐infiltrating Foxp3–CD4+CD25+ T cells predict poor survival in renal cell carcinoma. Clin Cancer Res 2007; 13:2075–81. [DOI] [PubMed] [Google Scholar]
- 21. Jensen HK, Donskov F, Nordsmark M, Marcussen N, von der Maase H. Increased intratumoral FOXP3‐positive regulatory immune cells during interleukin‐2 treatment in metastatic renal cell carcinoma. Clin Cancer Res 2009; 15:1052–8. [DOI] [PubMed] [Google Scholar]
- 22. Braun DA, Hou Y, Bakouny Z et al. Interplay of somatic alterations and immune infiltration modulates response to PD‐1 blockade in advanced clear cell renal cell carcinoma. Nat Med 2020; 26:909–18. [DOI] [PMC free article] [PubMed] [Google Scholar]
- 23. Giraldo NA, Becht E, Pages F et al. Orchestration and prognostic significance of immune checkpoints in the microenvironment of primary and metastatic renal cell cancer. Clin Cancer Res 2015; 21:3031–40. [DOI] [PubMed] [Google Scholar]
- 24. Granier C, Dariane C, Combe P et al. Tim‐3 expression on tumor‐infiltrating PD‐1(+)CD8(+) T cells correlates with poor clinical outcome in renal cell carcinoma. Cancer Res 2017; 77:1075–82. [DOI] [PubMed] [Google Scholar]
- 25. Hotta K, Sho M, Fujimoto K et al. Prognostic significance of CD45RO+ memory T cells in renal cell carcinoma. Br J Cancer 2011; 105:1191–6. [DOI] [PMC free article] [PubMed] [Google Scholar]
- 26. Jackson HW, Fischer JR, Zanotelli VRT et al. The single‐cell pathology landscape of breast cancer. Nature 2020; 578:615–20. [DOI] [PubMed] [Google Scholar]
- 27. Atzpodien J, Kirchner H, Jonas U et al. Interleukin‐2‐ and interferon alfa‐2a‐based immunochemotherapy in advanced renal cell carcinoma: a prospectively randomized trial of the German Cooperative Renal Carcinoma Chemoimmunotherapy Group (DGCIN). J Clin Oncol 2004; 22:1188–94. [DOI] [PubMed] [Google Scholar]
- 28. Shen SS, Truong LD, Scarpelli M, Lopez‐Beltran A. Role of immunohistochemistry in diagnosing renal neoplasms: when is it really useful? Arch Pathol Lab Med 2012; 136:410–7. [DOI] [PubMed] [Google Scholar]
- 29. Truong LD, Shen SS. Immunohistochemical diagnosis of renal neoplasms. Arch Pathol Lab Med 2011; 135:92–109. [DOI] [PubMed] [Google Scholar]
- 30. Zhou M, Roma A, Magi‐Galluzzi C. The usefulness of immunohistochemical markers in the differential diagnosis of renal neoplasms. Clin Lab Med 2005; 25:247–57. [DOI] [PubMed] [Google Scholar]
- 31. Simoni Y, Becht E, Fehlings M et al. Bystander CD8(+) T cells are abundant and phenotypically distinct in human tumour infiltrates. Nature 2018; 557:575–9. [DOI] [PubMed] [Google Scholar]
Associated Data
This section collects any data citations, data availability statements, or supplementary materials included in this article.
Supplementary Materials
Fig. S1. Differences in immune cell marker distribution between matched primary tumors (green) and metastatic tumors (red) (n = 11).
Fig. S2. Correlations between coexpression of CD68 and PD‐L1 in the tumor core and stroma and overall survival following immunotherapy estimated using Cox regression and Kaplan‐Meier analyses.
Fig. S3. Correlations between marker density in the tumor core, interface, and stroma and overall survival following targeted therapy estimated using Cox regression and Kaplan‐Meier analyses.
Table S1. Differences in marker density between matched primary and metastatic tumors (n = 11).
Table S2. Differences in overall survival based on immune cell marker density according to location in primary and metastatic tumors (P < 0·05 is considered statistically significant).
Table S3. Differences in survival following immunotherapy based on immune cell marker density according to location in primary and metastatic tumors (P < 0·05 is considered statistically significant).
Data Availability Statement
The data that support the findings of this study are available from the corresponding author upon reasonable request.


