

Abstract

Mass spectrometry imaging (MSI) has become an indispensible tool for spatially resolved molecular investigation of tissues. One of the key application areas is biomedical research, where matrix-assisted laser desorption/ionization (MALDI) MSI is predominantly used due to its high-throughput capability, flexibility in the molecular class to investigate, and ability to achieve single cell spatial resolution. While many of the initial technical challenges have now been resolved, so-called batch effects, a phenomenon already known from other omics fields, appear to significantly impede reliable comparison of data from particular midsized studies typically performed in translational clinical research. This critical insight will discuss at what levels (pixel, section, slide, time, and location) batch effects can manifest themselves in MALDI-MSI data and what consequences this might have for biomarker discovery or multivariate classification. Finally, measures are presented that could be taken to recognize and/or minimize these potentially detrimental effects, and an outlook is provided on what is still needed to ultimately overcome these effects.
Introduction
Mass spectrometry imaging (MSI) is a technique to obtain spatially resolved mass spectral information from thin surfaces such as biological tissue sections. Among the many available MSI techniques, the use of matrix-assisted laser desorption/ionization (MALDI) MSI has shown the steepest growth curve in the past years due to its capability to investigate different molecular classes, its high acquisition speed, and high spatial resolution.1 Furthermore, MALDI-MSI technology has the capability to provide tissue-type specific molecular profiles, which makes this technology especially interesting for biomedical research and cancer research in particular.2 The first evidence for this was given in 2003, when Yanagisawa et al. reported in The Lancet that MALDI-based proteomic patterns directly from tissue could predict prognosis and classify subgroups in lung cancer patients.3 Only one year later, it was envisaged that “From work already published, it is clear that the integration of this technology into protocols for disease diagnosis as well as outcome prediction will soon take place.”4
During the last 16 years, MALDI-MSI technology has been critically assessed twice.5,6 Ion suppression, sample throughput, homogeneity of matrix application and enzymatic tissue processing, spatial resolution/analyte delocalization, and the availability of validated/standardized protocols have been identified as key challenges. Since then, there have been significant advances in speed, spatial resolution, increased sensitivity, and various MSI data analysis packages (e.g., LipostarMSI, SCiLS, Cardinal, MSiReader, Metaspace) have been developed.
As many of the initial technical challenges have now been resolved, so-called batch effects, a phenomenon already known from other omics fields7 and digital pathology,8 appear to significantly impede the reliable interpretation and comparison of results, in particular from large-scale studies performed in translational clinical research. This critical insight will discuss how batch effects can manifest themselves in MALDI-MSI data and what measures could be taken to recognize, minimize, or adjust for them.
Batch Effects in MALDI-MSI
Batch effects are a potential systematic source of technical variation that affect a larger number of samples (the “batch”) in the same way.
In mass spectrometry (MS), there are many potential causes of batch effects, which can be categorized into the different levels at which they act. Similar to other analytical methods, day-to-day variation (factor “time”) plays an important role for causing batch effects due to changes in the performance of the mass spectrometer or sample preparation devices, lack of automation, or changes in laboratory environmental conditions (i.e., humidity, temperature, chemicals).9 A change of the laboratory where and by whom the study is performed (factor “location”) may amplify all above-mentioned factors and may be considered the source of the highest technical variation. Also, sample storage and collection are important factors, since they can influence the molecular content due to, for example, degradation.10 While MALDI-MSI shares these sources of batch effects with many other analytical techniques, MSI-exclusive types of batches can be formed on a pixel, section, and slide level (Figure 1a).
Figure 1.

Types and consequences of batch effects in MALDI-MSI. (a) Technical variation caused by batch effects can mask a given biological effect size (green rectangle) alone or in combination (cumulative batch effect, red triangle). The sources of this technical variation range from tissue collection, over sample preparation to the actual measurement. The batch effect can thereby manifest itself on five different levels: on a pixel, section, slide, time, and location level. (b) Systematic bias in any of these levels can hence lead to spurious correlations, where the observed correlation between an independent and dependent variable is actually caused by a confounding factor.
All these batch effects can either inflate variance or introduce confounding differences between samples. In the first case, batch effects can mask, individually or in combination, the true biological variation between samples due to large technical variation, causing false-negative results (Figure 1a). While this technical variation is certainly accumulating from the pixel to the location level, the contribution of the individual factors to the total sum of variation is largely unknown. Second, if the technical variation causes systematic bias in MALDI-MSI data, batch effects can lead to the observation of false-positive correlations (Figure 1b).
In order to enable the reliable detection of subtle biological differences and to avoid false discoveries in MALDI-MSI studies, it is of utmost importance to discuss the different types of batch effects.
Pixel-to-Pixel Batch Effects
In MSI, a data set is a collection of mass spectra where each mass spectrum (also termed “pixel” in MSI) has been acquired from a different position within a tissue section. The different chemical and biological composition at each location can influence the overall measurement process thereby hindering reliable quantitative comparisons between pixels. In MALDI-MSI, this effect builds up over two steps: sample preparation and MS measurement.
The MALDI technique relies on the application of organic matrices. The different local chemical properties of the tissue affect the extraction efficiency of the solvent and matrix crystallization.11 The latter leads to inhomogeneities in matrix coating (in extreme cases visible as “hot spots”), which will lead to spatially differing analyte suppression due to matrix-related ion suppression (Figure 2a, left).12 This adds to the spatial-dependent ion suppression that also happens without using a matrix (Figure 2a, right).12 All these effects can be considered as batch effects, since all molecules in the resulting spectrum of a pixel are affected.
Figure 2.

Batch effects on a pixel, region, section, and slide level. (a) Ion suppression caused by the MALDI matrix (left) or the inherent chemical composition of each MSI pixel (right) can lead to artificial differences in signal intensity across the tissue and therefore to pixel- and region-related batch effects. Adapted with permission from ref (12). Copyright 2018 American Chemical Society. (b) The different chemical setup of tissue regions can also effect on-tissue digestion velocities and thereby lead to region-related batch effects. This has been shown for myelin basic protein in rodent brain, where the time point at which the ratio between a terminal (m/z 1460, dashed lines) and its miscleaved precursor peptide (m/z 2141, continuous lines) inverts is later in gray matter (gray lines) than in white matter (black lines). Adapted with permission from ref (18). Copyright 2015 American Chemical Society. (c) Region-related batch effects can also be caused by systematic technical variation during an MS run, as shown here in a MALDI-MSI measurement of metabolites in a transversal rat heart section (left). Fading detector sensitivity, dirt accumulation, or a slope in tissue thickness, which leads to an out of focus of the laser, can cause such a gradient. A second measurement (center) revealed a homogeneous distribution, which means an artificial signal intensity loss of 96% (right) between the northern and southern region (blue and red, left). (d) Batch effects on a section, slide, and date level were observed in a data set consisting of 71 consective (therefore virtually identical) tissue sections, which were allocated in their cutting order on five glass slides and measured nonrandomly by MALDI-MSI on a lipid level. The variation of the total-ion-count (TIC, y axis) indicates the magnitude of batch effects on a date (A–D), slide (I–V), and section level (1–71) in decreasing order. Adapted from ref (41) under a Creative Commons CC BY license.
There has been some effort to quantify and correct for tissue-specific ion suppression by introducing tissue-extinction coefficients (TECs). For MSI studies of drugs, Hamm et al. coated control tissues homogeneously with a target compound to determine variations in its intensity across different organs, the TECs, which were later used as an organ-specific correction factor in dosed animals.13 Another approach in targeted MSI is to homogeneously distribute a known quantity of an isotope-labeled homologue of the target compound across the tissue. As this internal standard has the same chemical properties as the target compound, it can be used to normalize the signal of the target molecule on a per-pixel basis.14 While these targeted approaches have shown comparable performances to the gold standard liquid chromatgraphy (LC)–MS, with reported correlation coefficients of around 0.86,15,16 they do not work for discovery-based MSI, since each molecule has a different response to the ionization and is effected differently by the pixel-to-pixel batch effect.
Different strategies have been proposed to adjust for this and normalize the pixels to intrinsic information contained in the mass spectra, such as the total ion count or other parameters.11,17 However, these approaches need careful consideration when applied to the MSI data, since they can cause artifacts on their part.11,17 Moreover, they cannot account for other region-specific batch effects caused by on-tissue chemistry, such as in situ digestion or derivatization (Figure 2b).18
Another potential source of technical variation causing batch effects at pixel level is related to the instrument itself. Systematic measurement biases with local consequences can be caused by changes during the measurement such as a continuous decrease in detector sensitivity, evaporation of volatile matrices in low-pressure systems,19 or accumulation of residual ablated material in the ion source (Figure 2c). Acquiring single pixels in a randomized sequence would probably overcome these biases, but measurement time would multiply by the square root of the number of pixels, which makes this approach unfeasible.
Another source of technical variation is the optimal laser focus point at every pixel. Differences in the height topography of the tissue, e.g., caused by inhomogeneous sectioning or being unequally fixed in the slide holder, may lead to systematic local biases in signal intensity and calibration across the tissue.20 Optical mechanisms have been developed, which can correct for coarse height differences on-the-fly.21
Section-to-Section Batch Effects
Similar to the position of a pixel within a section, sections at different positions on the slide can also be exposed differently to batch effects of the measurement itself (e.g., due to increasing matrix sublimation in the source or fading detector sensitivity) (Figure 2d). While a randomized measurement sequence of the sections may decrease these effects, this measure is not able to compensate for artifacts introduced during sample preparation.
It has been shown that differences in section thickness can be related to spatially different signal intensities.22 Furthermore, the orientation of the slide in the sample preparation instrument may be related to observed differences; an example would be an inhomogeneous matrix coating as observed in matrix deposition systems based on lateral-operating vibrational vaporization.23 It has also been show that the duration of warming from sectioning until further processing on a subminute time scale can cause noticeable intersection variation through degradation.24 Finally, for tissue processing at harvesting, its fixation as well as storage type and time might cause systematic variation to individual or sets of samples and therefore sections of them.24
Multivariate classification at a pixel level is an example, which might be confounded by section-to-section batch effects, since a classifier might learn based on section-specific properties (Figure 3). Only a section-aware cross-validation can uncover this batch effect.
Figure 3.

Possible consequences of section-level batch effects for multivariate per-pixel classification. An example is shown for a pixel-based classification of 32 cancer tissues with two different clinical characteristics (red, black) (a). A random forest classifier was assessed twice, once using a patient-unaware tenfold cross-validation (CV) where 10% of all pixels are left out for training (b, left) and once using a leave-one-patient-out-cross-validation (LOPOCV), where at every iteration, all pixels belonging to one patient are left out (b, right). The different colors in (b) show the data that is left out for testing in each cross-validation phase. This revealed a significantly higher accuracy (P = 5.8 × 10⁻⁴; Mann–Whitney U test) for the tenfold CV (c), which is an unrealistic scenario since in clinical practice new MSI data will be unknown to the classifier.
Slide-to-Slide Batch Effects
A glass slide can be considered a batch since all pixels on that slide, either belonging to one or several tissue sections, undergo the same sample preparation and MS run (Figure 2d). In sample preparation, the type of slide wash can significantly determine the molecular information that can be retrieved by MSI.25 Despite the importance of this step, it has not been investigated systematically how reproducible slide washes are and what technical variation can be expected from this step with small deviations in, for example, submerging times. Since slides accumulate the technical variability from the pixel and section level and might even be measured at different days (MS run-to-run variability over time), slide-to-slide variation can be considered the highest achievable variance in a MALDI-MSI study performed at a single center.
A situation, where this might become visible, is in the analysis of tissue microarrays (TMAs). Depending on the design, a TMA can contain hundreds of small tissue cores from a large number of different tissues in a single block and hence on a single slide. However, if classes of interest are not equally distributed across all investigated TMAs, it could become challenging to distinguish real biological differences from batch-related effects with the potential for false-positive biomarker discoveries (Figure 4).
Figure 4.

Possible batch effects in tissue microarrays (TMAs). Working with TMAs, where the different classes may not be distributed equally between the TMAs, can lead to false-positive results in biomarker discovery. An example is shown in (a), where the TMA #2 has more patients with metastases (pN > 0) than TMA #1. If differential signal intensities between both TMAs, e.g., m/z 1619.96 (b), are observed, it is not possible to tell if significant differences between metastatic (pN > 0) and nonmetastatic (pN = 0) patients are based on technical or biological effects (c). P values were obtained using Welch’s test.
Existing Approaches to Mitigate Batch Effects
Potentially detrimental consequences of batch effects on the reliability of MALDI-MSI results require the development and application of procedures, which are able to avoid, identify, and potentially correct batch effects. So far, outlier detection, data transformation, robust data statistics, and appropriate study designs are the most powerful means, which will be discussed subsequently.
Study Design
An appropriate study design is the most powerful instrument to prevent systematic bias by batch effects at a section, slide, and time level. Vitek et al. proposed experimental designs for quantitative proteomics and emphasized the importance of randomization, technical replicates, and blocking to reduce technical artifacts.26 While a complete randomization can certainly remove systematic bias in a study, “blocking” allows removing known technical variation where a blocking factor is a known major source of variability, such as the slide in MALDI-MSI. Consequently, a slide should ideally contain a random selection but equal number of samples from every population positioned randomly on the slide (Figure 5a). Such an experimental setup can be exploited statistically by the use of more sensitive paired testing or mixed-effect models.27 Also, the use of technical replicates, especially in the case of TMAs, can decrease the influence of single measurements and therefore increase the sensitivity for identifying true biological differences.26
Figure 5.
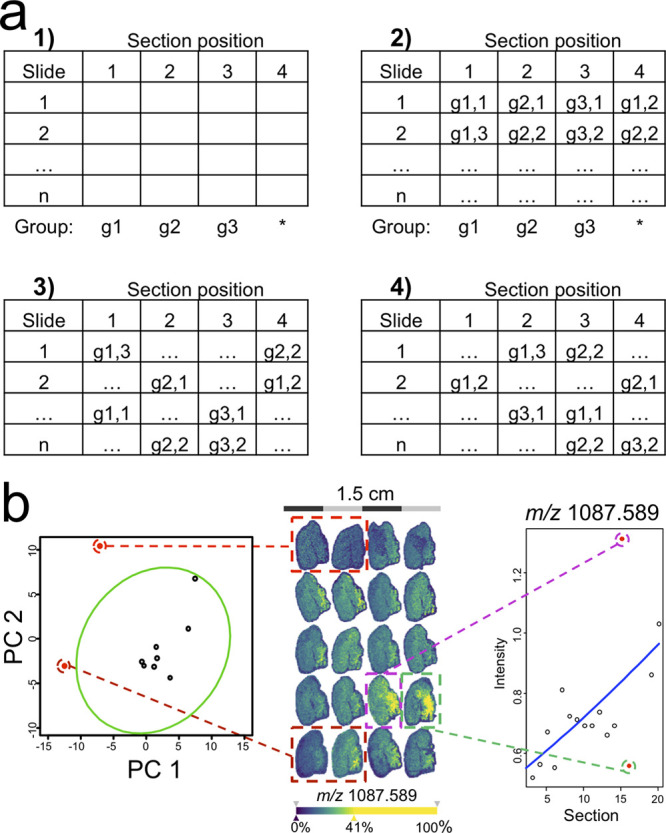
Mitigating batch effects by experimental setup and outlier detection. (a) Blocking can be used to remove the bias of known nuisance factors, such as the slide in MSI studies. For this, every group (here g1–g3) is first assigned a fixed position on every slide (a,1). Then, the positions are filled with single samples of every group including the variable position with a sample free of choice (a,2). Then, samples are shuffled vertically within each slide position (a,3) and then horizontally within each slide (a,4). To detect slide outliers (b, left), a principal component analysis of the molecular profiles from quality controls, which are spotted on every slide, such as intact cytochrome C to monitor digestion efficiency, can be used (red points outside green 95% error ellipse). In three-dimensional (3D)-MSI, a regression analysis can be used to spot outlier sections that do not match the expected gradient in signal intensity across the third dimension (b, right). Taken from ref (30) under a Creative Commons CC BY license.
While experimental design strategies offer an effective solution for dealing with known sources of technological variation, they are mostly ineffective when it comes to batch effects on a pixel level and reducing the detrimental influence of extreme measurements (outliers), which requires other measures to be taken.
Outlier Detection, Data Transformation, and Robust Data Statistics: Pixel Level
Outlier detection is a useful addition to a correct experimental design, since it allows increasing sensitivity for finding differences between classes by excluding extreme data, which is based on unusual experimental conditions.27
Outlier detection at the pixel level is already implemented in most MSI software packages where a defined quantile of pixels with extreme intensities are removed. Another option to reduce technical variation at the pixel level is by the use of variance stabilizing transformations by, for example, calculating the logarithm of the intensities.11 Wehrli et al. have shown the benefits of variance stabilization for principal component analysis (PCA) and orthogonal projections to latent structures discriminant analysis (OPLS-DA) models to more accurately identify anatomical regions in MSI data sets.28 When calculating multivariate-based distances between pixels, more robust distance metrics, such as the cosine distance or the correlation coefficient, should be used.29 These have shown to be less sensitive for additive and/or multiplicative effects, which can be caused by fluctuations in baseline levels or detector gains, respectively.
Commonly, the intensity values of a defined tissue region or the entire tissue section are summarized into a representative value such as mean intensity and standard deviation. More robust summary statistics such as the median or interquantile range can reduce the influence of extreme intensities on the final result.
Outlier Detection: Section, Slide, and Location Level
These univariate summary statistics can be used to identify potential outliers, e.g., via boxplots. However, given the multivariate nature of MSI data, the use of a PC analysis may be preferable to identify outliers, e.g., by using error ellipses in the two-dimensional (2D) or 3D PC space (Figure 5b, left).30 In 3D-MSI, regression analysis can be used to identify outlier sections typically deviating from the trend in the 3D stack (Figure 5b, right).30
Since all sections on a slide undergo the same sample preparation and MSI measurement, it might be necessary to assess the MS instrument performance through regular measurement of spotted quality control standards.31 Slide preparation, however, involves many different steps such as washes, digestion, derivatization, matrix coating, drying, rehumidification, and so on. A quality control standard that covers all of these aspects does not exist at this moment, but for on-tissue digestion-based experiments, an efficiency-oriented quality metric has been proposed.32
Current Challenges
Multicenter Studies of Clinical Samples
One way to have a sufficiently large number of biological replicates for clinical studies is to combine findings across different centers. Such a study design has a higher chance to identify true biological differences despite the potential presence of batch effects related to “location” and “time”. Promising attempts in that direction have already been undertaken showing that standardized MALDI-MSI workflows can achieve comparable results at different sites.33
Robust Experimental Workflows
In MALDI-MSI experiments, the development of standardized methods remains challenging due to the multiparameter nature of the experimental setup. Many studies have focused on optimizing the experimental workflow to achieve higher sensitivities, less delocalization, or more reliable identifications.34,35 However, quantifiable variance and reproducibility should become target parameters of every method development, as suggested by Erich et al.32 and Abbassi-Ghadi et al. for MALDI- and desorption electrospray ionization (DESI)-MSI,36 respectively.
It is important to quantify the technical variation introduced at every step of the experiment, similar to what Piehowski et al. proposed for LC–MS proteomics experiments.37 This facilitates calculating the magnitude of the propagated error to the final results and identifying the most crucial experimental steps. However, in contrast to LC–MS experiments, MSI does not allow pooling or aliquoting of samples and therefore lacks true identical technical replicates. Quality control standards are crucial to aid in this process.
Quality Controls
Quality controls for MS instrument performance31 or on-tissue digestion30 exist, which can act on a slide, date, and location level. For matrix application, tissue mimicking quality controls are preferred and are still being investigated.38 In that context, Condina et al. recently proposed homogenized egg white as slide-based quality control, whose chemical setup would allow the assessment of virtually any sample preparation sequence and measurement.39 But there are still quality controls missing which would allow addressing batch effects on a pixel and section level in the target sample when untargeted MALDI-MSI is performed.
While current slide-, date-, and location-level quality controls help identifying outliers, they fail so far to correct the intensities of the data caused by the different batch effects. This requires new normalization methods at the different levels.
New Normalization Methods
At pixel level, a few normalization methods can correct ion intensities using the intrinsic information on the spectra.17 While it has been shown that normalization is better than no normalization,11 clear guidelines and studies are still missing to make a correct choice.
At the tissue region level, Taylor et al. extended the determination of TECs from organs to regions as identified by unsupervised clustering, although application of this suggestion is currently limited to exogenous molecules with off-tissue intensity.12
At the section level, Veselkov et al. proposed a general intersample normalization in the MSI data analysis pipeline “BASIS” (Figure 6a).40 Using scaling factors, MSI data sets can be normalized to their mean or median or by the ratio of its median to reference (control) data (Figure 6b).
Figure 6.

Adjusting for batch effects by intersample normalization. In order to ensure comparability between multiple sets of samples, a variety of methods can be used to estimate scaling factors, which are applied uniformly for all spectra of a given sample (a). Taken from ref (40) under a Creative Commons CC BY license. A TMA batch effect can be revealed if pairs of control tissues (colored circles in Figure 4a) do not cluster together but cluster according to the TMA (b, above). Correcting the batch effect by a scaling factor, such that the signals from the controls in the wall of the TMA (white circles in Figure 4a) are equalized, appear to mitigate this effect (b, below). Such corrections, however, need to be rigorously validated, since they might be destructive and remove potential true differences (c, as compared to Figure 4c).
It is important to note that every alteration to the data can potentially also obscure the information content (Figure 6c). All proposed methods therefore require rigorous validation in independent data sets to ascertain that they increase sensitivity for detecting actual biological differences and do not create new artificial effects.
Outlook
Initial technical limitations of MALDI-MSI have been largely overcome, which have repositioned MALDI-MSI as a powerful and label-free technology for biomedical research. Now, the MSI community has to invest in research that guides development and validation of the next generation of instruments, software, and experimental workflows, to better understand, avoid, and/or mitigate batch effects that occur at various levels in MSI. Consortia within the MSI scientific community that are dedicated to quality assurance and standardization, such as MALDISTAR (www.maldistar.org) or METASPACE (www.metaspace2020.eu), may play a key role for more focused work in this direction. Only this will pave the way for MALDI-MSI to extract relevant findings from mid- and large-scale clinical studies.
Acknowledgments
We thank Jian Hua Cao (M4i), Michele Genangeli (M4i), and Annika Kuhn (MUMC+) for providing the mass spectrometry imaging datasets. In this context, all patient data shown has been obtained with ethical approval and with patient consent. All animal data has been obtained in compliance with the EU regulations for animal experimentation. B.B., T.P.S., and R.M.A.H. are financially supported by the Dutch Province of Limburg as part of the LINK program. B.B. received financial support from the Dutch Cancer Foundation (KWF) and European Union (ERA-NET TRANSCAN 2; Grant No. 643638). C.H. received funding from the Klaus-Tschira-Foundation (Project MALDISTAR; grant 00.010.2019).
The authors declare no competing financial interest.
References
- Buchberger A. R.; DeLaney K.; Johnson J.; Li L. Mass Spectrometry Imaging: A Review of Emerging Advancements and Future Insights. Anal. Chem. 2018, 90 (1), 240–265. 10.1021/acs.analchem.7b04733. [DOI] [PMC free article] [PubMed] [Google Scholar]
- Vaysse P. M.; Heeren R. M. A.; Porta T.; Balluff B. Mass spectrometry imaging for clinical research - latest developments, applications, and current limitations. Analyst 2017, 142 (15), 2690–2712. 10.1039/C7AN00565B. [DOI] [PubMed] [Google Scholar]
- Yanagisawa K.; Shyr Y.; Xu B. J.; Massion P. P.; Larsen P. H.; White B. C.; Roberts J. R.; Edgerton M.; Gonzalez A.; Nadaf S.; Moore J. H.; Caprioli R. M.; Carbone D. P. Proteomic patterns of tumour subsets in non-small-cell lung cancer. Lancet 2003, 362 (9382), 433–439. 10.1016/S0140-6736(03)14068-8. [DOI] [PubMed] [Google Scholar]
- Chaurand P.; Sanders M. E.; Jensen R. A.; Caprioli R. M. Proteomics in diagnostic pathology: profiling and imaging proteins directly in tissue sections. Am. J. Pathol. 2004, 165 (4), 1057–1068. 10.1016/S0002-9440(10)63367-6. [DOI] [PMC free article] [PubMed] [Google Scholar]
- Cole L. M.; Clench M. R. Mass spectrometry imaging for the proteomic study of clinical tissue. Proteomics: Clin. Appl. 2015, 9 (3–4), 335–341. 10.1002/prca.201400103. [DOI] [PubMed] [Google Scholar]
- Heeren R. M.; Smith D. F.; Stauber J.; Kukrer-Kaletas B.; MacAleese L. Imaging mass spectrometry: hype or hope?. J. Am. Soc. Mass Spectrom. 2009, 20 (6), 1006–1014. 10.1016/j.jasms.2009.01.011. [DOI] [PubMed] [Google Scholar]
- Goh W. W. B.; Wang W.; Wong L. Why Batch Effects Matter in Omics Data, and How to Avoid Them. Trends Biotechnol. 2017, 35 (6), 498–507. 10.1016/j.tibtech.2017.02.012. [DOI] [PubMed] [Google Scholar]
- Janowczyk A.; Zuo R.; Gilmore H.; Feldman M.; Madabhushi A. HistoQC: An Open-Source Quality Control Tool for Digital Pathology Slides. JCO Clinical Cancer Informatics. 2019, (3), 1–7. 10.1200/CCI.18.00157. [DOI] [PMC free article] [PubMed] [Google Scholar]
- Kuligowski J.; Perez-Guaita D.; Lliso I.; Escobar J.; Leon Z.; Gombau L.; Solberg R.; Saugstad O. D.; Vento M.; Quintas G. Detection of batch effects in liquid chromatography-mass spectrometry metabolomic data using guided principal component analysis. Talanta 2014, 130, 442–448. 10.1016/j.talanta.2014.07.031. [DOI] [PubMed] [Google Scholar]
- Svensson M.; Boren M.; Skold K.; Falth M.; Sjogren B.; Andersson M.; Svenningsson P.; Andren P. E. Heat stabilization of the tissue proteome: a new technology for improved proteomics. J. Proteome Res. 2009, 8 (2), 974–981. 10.1021/pr8006446. [DOI] [PubMed] [Google Scholar]
- Deininger S. O.; Cornett D. S.; Paape R.; Becker M.; Pineau C.; Rauser S.; Walch A.; Wolski E. Normalization in MALDI-TOF imaging datasets of proteins: practical considerations. Anal. Bioanal. Chem. 2011, 401 (1), 167–181. 10.1007/s00216-011-4929-z. [DOI] [PMC free article] [PubMed] [Google Scholar]
- Taylor A. J.; Dexter A.; Bunch J. Exploring Ion Suppression in Mass Spectrometry Imaging of a Heterogeneous Tissue. Anal. Chem. 2018, 90 (9), 5637–5645. 10.1021/acs.analchem.7b05005. [DOI] [PubMed] [Google Scholar]
- Hamm G.; Bonnel D.; Legouffe R.; Pamelard F.; Delbos J. M.; Bouzom F.; Stauber J. Quantitative mass spectrometry imaging of propranolol and olanzapine using tissue extinction calculation as normalization factor. J. Proteomics 2012, 75 (16), 4952–4961. 10.1016/j.jprot.2012.07.035. [DOI] [PubMed] [Google Scholar]
- Schulz S.; Becker M.; Groseclose M. R.; Schadt S.; Hopf C. Advanced MALDI mass spectrometry imaging in pharmaceutical research and drug development. Curr. Opin. Biotechnol. 2019, 55, 51–59. 10.1016/j.copbio.2018.08.003. [DOI] [PubMed] [Google Scholar]
- Källback P.; Vallianatou T.; Nilsson A.; Shariatgorji R.; Schintu N.; Pereira M.; Barré F.; Wadensten H.; Svenningsson P.; Andrén P. E. Cross-validated Matrix-Assisted Laser Desorption/Ionization Mass Spectrometry Imaging Quantitation Protocol for a Pharmaceutical Drug and Its Drug-Target Effects in the Brain Using Time-of-Flight and Fourier Transform Ion Cyclotron Resonance Analyzers. Anal. Chem. 2020, 92 (21), 14676–14684. 10.1021/acs.analchem.0c03203. [DOI] [PMC free article] [PubMed] [Google Scholar]
- Takeo E.; Shimma S. Development of quantitative imaging mass spectrometry (q-IMS) for drug visualization using animal tissues. Surf. Interface Anal. 2019, 51 (1), 21–26. 10.1002/sia.6537. [DOI] [Google Scholar]
- Fonville J. M.; Carter C.; Cloarec O.; Nicholson J. K.; Lindon J. C.; Bunch J.; Holmes E. Robust data processing and normalization strategy for MALDI mass spectrometric imaging. Anal. Chem. 2012, 84 (3), 1310–1319. 10.1021/ac201767g. [DOI] [PubMed] [Google Scholar]
- Heijs B.; Tolner E. A.; Bovee J. V.; van den Maagdenberg A. M.; McDonnell L. A. Brain Region-Specific Dynamics of On-Tissue Protein Digestion Using MALDI Mass Spectrometry Imaging. J. Proteome Res. 2015, 14 (12), 5348–5354. 10.1021/acs.jproteome.5b00849. [DOI] [PubMed] [Google Scholar]
- Jackson S. N.; Muller L.; Roux A.; Oktem B.; Moskovets E.; Doroshenko V. M.; Woods A. S. AP-MALDI Mass Spectrometry Imaging of Gangliosides Using 2,6-Dihydroxyacetophenone. J. Am. Soc. Mass Spectrom. 2018, 29 (7), 1463–1472. 10.1007/s13361-018-1928-8. [DOI] [PMC free article] [PubMed] [Google Scholar]
- McDonnell L. A.; Piersma S. R.; Altelaar A. F. M.; Mize T. H.; Luxembourg S. L.; Verhaert P. D. E. M.; van Minnen J.; Heeren R. M. A. Subcellular imaging mass spectrometry of brain tissue. J. Mass Spectrom. 2005, 40 (2), 160–168. 10.1002/jms.735. [DOI] [PubMed] [Google Scholar]
- Kompauer M.; Heiles S.; Spengler B. Autofocusing MALDI mass spectrometry imaging of tissue sections and 3D chemical topography of nonflat surfaces. Nat. Methods 2017, 14 (12), 1156–1158. 10.1038/nmeth.4433. [DOI] [PubMed] [Google Scholar]
- Longuespee R.; Kriegsmann K.; Cremer M.; Zgorzelski C.; Casadonte R.; Kazdal D.; Kriegsmann J.; Weichert W.; Schwamborn K.; Fresnais M.; Schirmacher P.; Kriegsmann M. In MALDI-Mass Spectrometry Imaging on Formalin-Fixed Paraffin-Embedded Tissue Specimen Section Thickness Significantly Influences m/z Peak Intensity. Proteomics: Clin. Appl. 2019, 13 (1), 1800074. 10.1002/prca.201800074. [DOI] [PubMed] [Google Scholar]
- SunChrom Wissenschaftliche Geräte GmbH. Sample preparation for MALDI-MS. https://sunchrom.de/maldi-imaging-3/.
- Goodwin R. J. A. Sample preparation for mass spectrometry imaging: Small mistakes can lead to big consequences. J. Proteomics 2012, 75 (16), 4893–4911. 10.1016/j.jprot.2012.04.012. [DOI] [PubMed] [Google Scholar]
- Seeley E. H.; Oppenheimer S. R.; Mi D.; Chaurand P.; Caprioli R. M. Enhancement of protein sensitivity for MALDI imaging mass spectrometry after chemical treatment of tissue sections. J. Am. Soc. Mass Spectrom. 2008, 19 (8), 1069–1077. 10.1016/j.jasms.2008.03.016. [DOI] [PMC free article] [PubMed] [Google Scholar]
- Oberg A. L.; Vitek O. Statistical design of quantitative mass spectrometry-based proteomic experiments. J. Proteome Res. 2009, 8 (5), 2144–2156. 10.1021/pr8010099. [DOI] [PubMed] [Google Scholar]
- Bemis K. A.; Guo D.; Harry A. J.; Thomas M.; Lanekoff I.; Stenzel-Poore M. P.; Stevens S. L.; Laskin J.; Vitek O. Statistical detection of differentially abundant ions in mass spectrometry-based imaging experiments with complex designs. Int. J. Mass Spectrom. 2019, 437, 49–57. 10.1016/j.ijms.2018.07.006. [DOI] [Google Scholar]
- Wehrli P. M.; Michno W.; Blennow K.; Zetterberg H.; Hanrieder J. Chemometric Strategies for Sensitive Annotation and Validation of Anatomical Regions of Interest in Complex Imaging Mass Spectrometry Data. J. Am. Soc. Mass Spectrom. 2019, 30 (11), 2278–2288. 10.1007/s13361-019-02327-y. [DOI] [PMC free article] [PubMed] [Google Scholar]
- Dexter A.; Race A. M.; Styles I. B.; Bunch J. Testing for Multivariate Normality in Mass Spectrometry Imaging Data: A Robust Statistical Approach for Clustering Evaluation and the Generation of Synthetic Mass Spectrometry Imaging Data Sets. Anal. Chem. 2016, 88 (22), 10893–10899. 10.1021/acs.analchem.6b02139. [DOI] [PubMed] [Google Scholar]
- Vos D. R. N.; Jansen I.; Lucas M.; Paine M. R. L.; de Boer O. J.; Meijer S. L.; Savci-Heijink C. D.; Marquering H. A.; de Bruin D. M.; Heeren R. M. A.; Ellis S. R.; Balluff B. Strategies for managing multi-patient 3D mass spectrometry imaging data. J. Proteomics 2019, 193, 184–191. 10.1016/j.jprot.2018.10.008. [DOI] [PubMed] [Google Scholar]
- Buck A.; Heijs B.; Beine B.; Schepers J.; Cassese A.; Heeren R. M. A.; McDonnell L. A.; Henkel C.; Walch A.; Balluff B. Round robin study of formalin-fixed paraffin-embedded tissues in mass spectrometry imaging. Anal. Bioanal. Chem. 2018, 410 (23), 5969–5980. 10.1007/s00216-018-1216-2. [DOI] [PMC free article] [PubMed] [Google Scholar]
- Erich K.; Sammour D. A.; Marx A.; Hopf C. Scores for standardization of on-tissue digestion of formalin-fixed paraffin-embedded tissue in MALDI-MS imaging. Biochim. Biophys. Acta, Proteins Proteomics 2017, 1865 (7), 907–915. 10.1016/j.bbapap.2016.08.020. [DOI] [PubMed] [Google Scholar]
- Ly A.; Longuespee R.; Casadonte R.; Wandernoth P.; Schwamborn K.; Bollwein C.; Marsching C.; Kriegsmann K.; Hopf C.; Weichert W.; Kriegsmann J.; Schirmacher P.; Kriegsmann M.; Deininger S. O. Site-to-Site Reproducibility and Spatial Resolution in MALDI-MSI of Peptides from Formalin-Fixed Paraffin-Embedded Samples. Proteomics: Clin. Appl. 2019, 13 (1), 1800029. 10.1002/prca.201800029. [DOI] [PMC free article] [PubMed] [Google Scholar]
- Judd A. M.; Gutierrez D. B.; Moore J. L.; Patterson N. H.; Yang J.; Romer C. E.; Norris J. L.; Caprioli R. M. A recommended and verified procedure for in situ tryptic digestion of formalin-fixed paraffin-embedded tissues for analysis by matrix-assisted laser desorption/ionization imaging mass spectrometry. J. Mass Spectrom. 2019, 54 (8), 716–727. 10.1002/jms.4384. [DOI] [PMC free article] [PubMed] [Google Scholar]
- Velickovic D.; Zhang G.; Bezbradica D.; Bhattacharjee A.; Pasa-Tolic L.; Sharma K.; Alexandrov T.; Anderton C. R.; et al. Response Surface Methodology As a New Approach for Finding Optimal MALDI Matrix Spraying Parameters for Mass Spectrometry Imaging. J. Am. Soc. Mass Spectrom. 2020, 31 (3), 508–516. 10.1021/jasms.9b00074. [DOI] [PMC free article] [PubMed] [Google Scholar]
- Abbassi-Ghadi N.; Jones E. A.; Veselkov K. A.; Huang J.; Kumar S.; Strittmatter N.; Golf O.; Kudo H.; Goldin R. D.; Hanna G. B.; Takats Z. Repeatability and reproducibility of desorption electrospray ionization-mass spectrometry (DESI-MS) for the imaging analysis of human cancer tissue: a gateway for clinical applications. Anal. Methods 2015, 7 (1), 71–80. 10.1039/C4AY01770F. [DOI] [Google Scholar]
- Piehowski P. D.; Petyuk V. A.; Orton D. J.; Xie F.; Moore R. J.; Ramirez-Restrepo M.; Engel A.; Lieberman A. P.; Albin R. L.; Camp D. G.; Smith R. D.; Myers A. J. Sources of technical variability in quantitative LC–MS proteomics: human brain tissue sample analysis. J. Proteome Res. 2013, 12 (5), 2128–2137. 10.1021/pr301146m. [DOI] [PMC free article] [PubMed] [Google Scholar]
- Barry J. A.; Groseclose M. R.; Castellino S. Quantification and assessment of detection capability in imaging mass spectrometry using a revised mimetic tissue model. Bioanalysis 2019, 11 (11), 1099–1116. 10.4155/bio-2019-0035. [DOI] [PubMed] [Google Scholar]
- Condina M. R.; Mittal P.; Briggs M. T.; Oehler M. K.; Klingler-Hoffmann M.; Hoffmann P. Egg White as a Quality Control in Matrix-Assisted Laser Desorption/Ionization Mass Spectrometry Imaging (MALDI-MSI). Anal. Chem. 2019, 91 (23), 14846–14853. 10.1021/acs.analchem.9b03091. [DOI] [PubMed] [Google Scholar]
- Veselkov K.; Sleeman J.; Claude E.; Vissers J. P. C.; Galea D.; Mroz A.; Laponogov I.; Towers M.; Tonge R.; Mirnezami R.; Takats Z.; Nicholson J. K.; Langridge J. I. BASIS: High-performance bioinformatics platform for processing of large-scale mass spectrometry imaging data in chemically augmented histology. Sci. Rep. 2018, 8 (1), 4053. 10.1038/s41598-018-22499-z. [DOI] [PMC free article] [PubMed] [Google Scholar]
- Vos D. R. N.; Ellis S. R.; Balluff B.; Heeren R. M. A. Experimental and Data Analysis Considerations for Three-Dimensional Mass Spectrometry Imaging in Biomedical Research. Molecular Imaging and Biology. 2020, 10.1007/s11307-020-01541-5. [DOI] [PMC free article] [PubMed] [Google Scholar]