

Abstract
Diet-induced obesity (DIO) is associated with glucose intolerance, insulin resistance (IR), and an increase in intramyocellular lipids (IMCL), which may lead to disturbances in glucose and protein metabolism. To this matter, it has been speculated that chronic obesity and elevated IMCL may contribute to skeletal muscle loss and deficits in muscle function and growth capacity. Thus, we hypothesized that diets with elevated fat content would induce obesity and insulin resistance, leading to a decrease in muscle mass and an attenuated growth response to increased external loading in adult male mice. Male C57BL/6 mice (8 wk of age) were subjected to five different diets, namely, chow, low-dat-diet (LFD), high-fat-diet (HFD), sucrose, or Western diet, for 28 wk. At 25 wk, HFD and Western diets induced a 60.4% and 35.9% increase in body weight, respectively. Interestingly, HFD, but not Western or sucrose, induced glucose intolerance and insulin resistance. Measurement of isometric torque (ankle plantar flexor and ankle dorsiflexor muscles) revealed no effect of DIO on muscle function. At 28 wk of intervention, muscle area and protein synthesis were similar across all diet groups, despite insulin resistance and increased IMCL being observed in HFD and Western diet groups. In response to 30 days of functional overload, an attenuated growth response was observed in only the HFD group. Nevertheless, our results show that DIO alone is not sufficient to induce muscle atrophy and contractile dysfunction in adult male C57BL/6 mice. However, diet composition does have an impact on muscle growth in response to increased external loading.
NEW & NOTEWORTHY The effects of diet-induced obesity on skeletal muscle mass are complex and dependent on diet composition and diet duration. The present study results show that chronic exposure to high levels of fatty acids does not affect muscle mass, contractile function, or protein synthesis in obese C57BL/6 mice compared with the consumption of chow. Obesity did result in a delay in load-induced growth; however, only a 45% HFD resulted in attenuated growth following 30 days of functional overload.
Keywords: atrophy, hypertrophy, insulin resistance, intramuscular lipids, muscle function, obesity, skeletal muscle atrophy
INTRODUCTION
Obesity has become a major public health problem, and today, it is estimated that one-third of the world’s population is classified as overweight or obese (1). In the United States alone, the estimated cost of obesity-related medical care was $147 billion/year in 2008, representing over 9% of all medical expenditures (2, 3). Diet-induced obesity (DIO) is associated with several chronic diseases including type 2 diabetes (T2D), hypertension, and certain types of cancers (1, 4, 5). Further, obesity can increase the likelihood of musculoskeletal-related disabilities, such as a decrease in mobility leading to reductions in muscle function and strength that can contribute to complications such as an increased risk of falls, decreased quality of life, and increased mortality (1, 6).
Recent studies suggest that obesity has the potential to negatively affect multiple properties of skeletal muscle including glucose disposal, oxidative metabolism, muscle quality (i.e., force per cross-sectional area), and growth capacity (7–10). Skeletal muscle represents ∼40% of total body mass and plays an important role in glucose uptake (∼80%) following the postprandial period or under insulin stimulation (11–13). Chronic exposure to high levels of fatty acids, especially saturated fatty acids, can increase the amount of intramyocellular lipids (IMCLs) in skeletal muscle. Increased levels of IMCLs have been associated with insulin resistance (IR) and glucose intolerance, which could contribute to reductions in muscle protein synthesis (MPS) and oxidative capacity, leading to reduced exercise capacity and inactivity (12). The consequence of elevated triglyceride content (TAG) on skeletal muscle and the impact on function and muscle mass is not fully known (14, 15). It has been suggested that diet-induced obesity can lead to the loss of skeletal muscle mass and weakness, possibly because of a decrease in MPS, activation of protein degradation, and/or inactivity (16–19).
Obesity has also been suggested to stimulate skeletal muscle hypertrophy and an increase in maximum isometric force because of chronic increased loading, especially of weight-bearing muscles (20–23). It has also been reported that when absolute muscle force is normalized to body mass, muscle strength in obese individuals is lower than that measured in nonobese individuals (1, 22). The impact of diet-induced obesity on muscle mass and function is difficult to discern, as studies differ greatly in their design. For example, factors such as rodent strain, animal age, diet composition, diet duration, and muscles studied vary considerably across studies and could influence the outcomes.
The aim of the current study was to examine the effect of a long duration (28 wk) of diet-induced obesity on muscle mass and function, as well as the ability of muscle to respond to increased external loading. A previous study by our group showed that 15 wk on a 45% HFD attenuated load-induced muscle hypertrophy, but it had no effect on baseline muscle mass (8). In the current study, we set the duration of the diet intervention at 28 wk to examine the chronic effects of obesity on muscle mass and the response to increased external loading. In this instance, increased external loading was induced by functional overload (FO) and also diet-induced obesity. We compared the effect of five commonly utilized diets that vary in the amount of saturated fats and sucrose (Chow, LFD, HFD, Sucrose, and Western) on the development of obesity and multiple properties of muscle including muscle mass, muscle contractile function, and muscle growth response in male C57BL/6 mice. We selected C57BL6 mice, as this is a commonly used mouse strain and has been shown to be susceptible to diet-induced obesity (24, 25). Our study was limited to males, as female C57BL6 mice are resistant to diet-induced obesity (26).
METHODS
Animals
Male C57BL/6 mice (n = 100), 6 wk old, were ordered from Charles River Labs and housed on a 12 h light-dark cycle in ventilated cages (Thoren Caging System), with five mice/cage. Mice were allowed access to standard chow (NIH-31/7013) and water ad libitum. At 8 wk of age, mice were randomly assigned into one of five diet groups: chow (Envigo 7013 NIH-31 Modified), low-fat-diet (LFD; RD D12450H), high-fat-diet (HFD; RD D12451, fat source: lard), high-sucrose-diet (HS, RD 98121701), or Western diet (WD, RD D12079B, fat source: milk fat) (Table 1). Mice were maintained on their respective diet for 28 wk. Body weights were measured weekly for 25 wk. At 25 wk, half the numbers of mice were assigned to a group that would be subjected to surgery and functional overload of the plantaris muscle. All animal procedures were approved by the Institutional Animal Care and Use Committee at the University of Iowa.
Table 1.
Diet composition
| Composition | Chow (NIH-31) | LFD | HFD | Sucrose | Western |
|---|---|---|---|---|---|
| g/kg | |||||
| Casein | 200 | 200 | 195 | 195 | |
| DL-Methionine | 0 | 0 | 3 | 0 | |
| L-Cystine | 3 | 3 | 3 | 3 | |
| Corn starch | 452.2 | 72.5 | 404.4 | 50 | |
| Maltodextrin 10 | 75 | 100 | 100 | 100 | |
| Sucrose | 172.8 | 172.8 | 341 | 341 | |
| Cellulose | 50 | 50 | 50 | 50 | |
| Soybean oil | 25 | 25 | 25 | 25 | |
| Milk fat | 0 | 0 | 0 | 200 | |
| Corn oil | 0 | 0 | 52.5 | 10 | |
| Lard | 20 | 177.5 | 0 | 0 | |
| Ethoxyquin | 0 | 0 | 0.04 | 0.04 | |
| Mineral mix | 10 | 10 | 35 | 35 | |
| DiCalcium Phosphate | 13 | 13 | 0 | 0 | |
| Calcium carbonate | 5.5 | 5.5 | 4 | 4 | |
| Potassium citrate, 1 H2O | 16.5 | 16.5 | 0 | 0 | |
| Vitamin mix | 10 | 10 | 10 | 10 | |
| Choline bitartrate | 2 | 2 | 2 | 2 | |
| Cholesterol | 1.36 | 1.95 | 0 | 1.5 | |
| Kcal, % | |||||
| Protein | 18 | 20 | 20 | 17 | 20 |
| Carbohydrate | 45 | 70 | 35 | 71 | 50 |
| Fat | 6.2 | 10 | 45 | 4 | 21 |
| Total, kcal/g | 3.1 | 3.85 | 4.73 | 3.91 | 4.7 |
Glucose and Insulin Tolerance Tests
After 21 wk on the diet, a glucose tolerance test (GTT was performed on a subset of mice. Briefly, mice were fasted for 6 h starting 2 h into the light cycle (∼8 AM). Mice were transferred to clean cages without food at the beginning of the fasting period, and the test was initiated with a baseline assessment of glucose and insulin levels. Blood was collected from the tail vein. Glucose levels were measured using a Contour Next EZ glucometer (Ascensia Diabetes Care Inc., Parsippany, NJ). For measurement of insulin, blood was collected from the tail vein with a heparinized capillary tube (Fisherbrand). Samples were kept on ice for at least 30 min and then centrifuged at 4°C for 20 min at 2,000 g, after which serum was transferred to an Eppendorf tube, and insulin levels were determined using the Ultra sensitive mouse insulin ELISA kit (Crystal Chem, Downers Grove, IL) following the supplier's recommended assay. Plasma glucose disappearance rate (Kitt, %/min) during the insulin tolerance test was calculated as described by Festuccia et al. (27) using time 0 (basal glucose) and 30 min after insulin injection. Briefly, the slope of linear regression was calculated and used in the equation (slope × 100)/glucose time 0) to derive Kitt.
The glucose tolerance test was initiated with an intraperitoneal injection of a glucose solution prepared in saline (2 g/kg body wt). Blood samples were collected from the tail vein at 15, 30, 45, 60, and 120 min post injection, and glucose levels were determined as described previously. One week later, the insulin tolerance tests (ITTs) were performed in the same mice. Mice were transferred to clean cages without food for the duration of ITT. ITT started with a baseline assessment of blood glucose, followed by an intraperitoneal injection of insulin solution prepared in saline (1 U/kg insulin; Novolin R, Novo Nordisk A/S, Bagsvaerd, Denmark). Insulin assessments were performed as described for GTTs. Blood glucose was collected through the tail vein at 0, 15, 30, 45, and 60 min after injection.
Muscle Contractile Function Protocol
After 24 wk on diet, isometric torque of the ankle plantar flexors [gastrocnemius, soleus (SOL), and plantaris] and dorsiflexors [tibialis anterior (TA) and extensor digitorum longus (EDL)] muscles was assessed in vivo as previously described (28). Essentially, after 24 wk on diet, muscle function was assessed by stimulating either the tibial (plantar flexors) or common peroneal (dorsiflexors) nerve to induce maximal isometric force. During the protocol, mice were anesthetized with 2%–4% isoflurane (inhaled) and placed in a supine position on a warming platform set to 35°C. Once anesthetized, the knee was secured between pivots and the foot was secured to a footplate attached to a force transducer. Ankle plantar flexor torque was measured from the left leg and ankle dorsiflexor torque from the right leg. Optimal voltage and ankle angle was set for each. Nerves were stimulated by two needle electrodes (monopolar polytetrafluoroethylene-coated stainless steel; Chalgren Enterprises, Gilroy, CA) to allow for complete muscle contraction. Needles were inserted subcutaneously, midway between the knee and ankle. Maximal contraction of ankle plantar flexors via tibial nerve stimulation was achieved by placing needles in posterior compartment, maximal contraction of ankle dorsiflexors via common peroneal nerve stimulation was achieved by placing needles in anterior compartment. Tetanic isometric contractions were achieved by stimulating the nerve at 150 Hz for 300 ms. Maximal isometric torque was measured from a minimum of three maximal contractions, with 15 s rest between each contraction. All muscle function testing was performed using the 1300 A: 3-in-1 Whole Animal System from Aurora Scientific Instruments (1300 A, Aurora Scientific Inc., Aurora, ON, Canada) and data were collected and analyzed with Dynamic Muscle Analysis software (ASI 611 A v.5.321, Aurora Scientific Inc.).
Nuclear Magnetic Resonance
Body composition was measured at week 24 of the diet using a Bruker LF-9011 BCA-Analyzer (Bruker Optics, Inc., Billerica, MA). Without sedation, mice were placed in a ventilated plastic canister, held immobile, and placed in the machine. The procedure takes ∼1 min per animal (29, 30).
Functional Overload
All surgeries were performed under aseptic conditions. All tools were autoclaved before first use and sterilized using a glass bead sterilizer between surgeries. Before surgery, animals were weighed and given a 0.03 mg/kg dose of buprenex. Animals were anesthetized under 2.5% isoflurane, hair was removed from both hind limbs, and the surgical sites were cleaned three times using alternating alcohol and iodine swabs. Artificial tear ointment as used to keep the eyes moist while under anesthesia. A small incision was made along the lateral side of the lower hind limb along the border of the tibialis anterior and the gastrocnemius. Using small forceps, the soleus was gently separated from the gastrocnemius complex and removed. Next, the Achilles tendon was cut and the lower two-thirds of the medial and lateral gastrocnemius muscles were removed, with care taken to not disturb the blood supply or innervation to the plantaris. The incision site was closed using absorbable Vicryl sutures, and the animals were allowed to recover from anesthesia in a warm place before being placed in a clean cage. Analgesic was given up to 48 h after surgery and animals were monitored daily for pain and discomfort for 5 days following surgery. Plantaris muscles were collected at 14 and 30 days post surgery under isoflurane anesthesia.
Tissue Collection
Thirty minutes before tissue collection, animals were injected intraperitoneally with puromycin (0.02 µmol/g body wt). Tissues (soleus, plantaris, tibialis anterior, gastrocnemius, quadriceps, blood, and liver) were extracted from mice under isoflurane (2.5% inhaled) anesthesia. Upon completion of the tissue extraction, mice were euthanized by decapitation in accordance with guidelines approved by the American Veterinary Medical Association (AVMA). Tissues to be used for biochemical analyses were frozen directly in liquid nitrogen and stored at −80°C. For histology, muscles were weighed, pinned on cork at resting length, and frozen in liquid nitrogen-cooled isopentane for 1 min, and then stored at −80°C.
Histology
Frozen muscles were cut into 10-μm-thick sections from the belly of the gastrocnemius and plantaris muscles using a cryostat (Leica Microtome Cryostat HM505E). Muscle cross-sections were stained with anti-laminin (Sigma Aldrich 1:1,000) to determine fiber cross-sectional area (31). Laminin images with ×100 total magnification were captured using a Zeiss LSM710 Confocal digital camera (NIH: 1 S10 RR025439-01). Images were quantified using Myovision analysis software (Myovision software, University of Kentucky) (32).
Triglyceride Content
Triglyceride (TAG) content was determined in the gastrocnemius, quadriceps and liver following 28 wk of treatment. The triglyceride content was measured using the triglyceride quantification colorimetric/fluorometric kit (BioVision #K622-100). Briefly, 25 mg of tissue were powdered, and homogenized in 1.5 mL Eppendorf tube containing 100 µL of 5% NP-40 lysis buffer, and then samples were heated to 100°C for 5 min. Samples were centrifuged at the highest speed (21 g) for 2 min to remove any insoluble material, and then the supernatant was collected and immediately frozen at −80°C until further processed. Following manufacturer instructions, a standard curve was generated using known triglyceride standards. Spectrophotometer readings at 570 nm for standards and samples were taken, and sample concentrations were calculated from the standard curve. The resulting concentration values were divided by mg of tissue analyzed, to yield results in mmol triglyceride per mg of tissue.
Oil Red O Staining
Sections were stained with Oil Red O (ORO) as described by Mehlem et al. (33). Briefly, 12-μm-thick sections were cut from the mid-belly of the gastrocnemius muscle using a cryostat (Leica Microtome Cryostat, HM505E). The slides were equilibrated for 10 min at room temperature before starting the staining protocol. Sections were incubated for 7 min in ORO solution (Sigma, 00625) and washed for 40 min in running tap water. ORO images at ×100 total magnification were captured using an Olympus BX-61 microscope with digital camera. Images were quantified using ImageJ analysis software (National Institutes of Health, Bethesda, MD). Approximately 300 muscle fibers from the same regions of medial and lateral gastrocnemius were analyzed per animal.
Immunoblot Analysis
Immunoblots of gastrocnemius muscle homogenates from all five groups were performed as described by Baehr et al. using 10 μg of protein (31). Briefly, gastrocnemius muscles were powdered, and homogenized in sucrose lysis buffer (50 mM Tris, 150 mM NaCl, 5 mM MgCl2, 1 mM EDTA, and 0.5 mM DTT at pH 7.5). The supernatant was collected following centrifugation at 8,000 g for 10 min, and protein concentrations were determined in triplicate using the Pierce 660 nm protein assay reagent method (Pierce 22660). Ten micrograms of protein were separated via SDS-PAGE on 4%–20% Criterion TGX stain-free gels (Cat. No. 5678095; Bio-Rad) at 200 V for 45 min. After activation of gel by using UV transillumination for 60 sec (Bio-Rad ChemiDoc Image), protein was transferred onto PVDF membranes (Cat. No. IPVH00010; EMD Millipore) at 100 V for 1 h. Membranes were washed in 1X Tris-buffered saline with 0.1% Tween-20 (TBST), for three times (10 min each; wash step), and then blocked in 3%–5% nonat dairy milk or BSA for 1 h and then probed with primary antibody against puromycin (1:1,000, Millipore, 12D10), overnight at 4°C. After a wash step, membranes were incubated with peroxidase-conjugated secondary (1:10,000) for 1 h at room temperature, washed, and incubated in Western ECL substrate detection system for 5 min before image acquisition (Clarity TM, Bio-Rad, Hercules, CA). Image acquisition and band quantification was performed using the Azure c400 system and Image Lab 6.1 software for Mac and the macOS Mojave version 10.14.6. All bands were normalized to total protein (Stain Free).
Statistics
All statistical analyses were performed using the GraphPad Prism 8.4.2 software. The Shapiro–Wilk test was used to verify the normality of the data distribution for each group. For those experiments where the data were not normally distributed, the Kruskal–Wallis test (nonparametric test) was used to test for significant differences between groups. For those experiments where the data were normally distributed, a one-way analysis of variance (ANOVA) was conducted followed by the Dunnett’s test for multiple comparisons. Two-way analysis of variance (ANOVA) was performed to detect differences on ITT and functional overload in different time points. When applicable, Tukey post hoc test was conducted for multiple comparisons across groups. Statistical significance was set at P ≤ .05.
RESULTS
Diets High in Fat Induced an Increase in Whole Body Weight and Fat Content
Male C57BL6 mice were fed one of five diets (chow, LFD, HFD, sucrose, or Western) for a duration of 28 wk starting at 8 wk of age (i.e., from initiation of the diet at 8 wk of age to termination at 36 wk of age). Body weight was measured weekly over the 25-wk experimental duration and shown in Fig. 1 for each of the diet groups. Figure 1B shows body weight gain from initial weight (mean ± SD) for mice fed each of the diets and reveals that mice consuming an HFD (29.87 ± 1.32 g) and a WD (25.31 ± 2.40 g) gained significantly more weight than mice on a chow (18.62 ± 3.93 g), LFD (18.09 ± 2.93 g), or sucrose (16.87 ± 3.25 g) diet. Of the five diet groups, mice on the HFD gained the most body weight. Measurement of body composition at 24 wk using nuclear magnetic resonance (NMR) showed that the differences between the groups could be explained by a differential gain in body fat. Following 24 wk on the diet, mice that consumed an HFD had higher fat content (25.33 ± 0.98 g) than those that consumed chow (16.52 ± 2.38 g), LFD (15.95 ± 2.38 g), sucrose (15.70 ± 2.10 g), and Western diets (22.29 ± 2.78 g) (Fig. 1B). No differences in lean mass or fluid content were measured across the groups (Fig. 1, C and D).
Figure 1.

Consumption of diets with elevated fat content lead to increased weight gain and elevated fat composition. body weight (A) and grams of body weight gain (B) for 25 wk. Data were analyzed by one-way ANOVA. P < 0.05. *HFD versus Chow; #Western versus Chow; γWestern versus HFD. Values are means ± SD; n = 20 per group. lean and fat mass composition in grams (C) and percent (D) at 24 wk. Data were analyzed by one-way ANOVA. P < 0.05. *HFD versus chow; #Western versus chow; γWestern versus HFD. Values are means ± SD, n = 8–12 mice per group. ANOVA, analysis of variance; HFD, high-fat diet; LFD, low-fat diet.
Diet-Specific Increases of Fat Content in Skeletal Muscle and Liver
Increased whole body fat content is often associated with an increase in intramyocellular lipids (16, 17, 34); thus, we examined the TAG content in gastrocnemius, quadriceps, and liver across the diet groups using a commercially available colorimetric kit. The analysis showed that TAG content increased significantly in the liver of mice fed the diets high in saturated fats (HFD and Western) (Fig. 2A). Skeletal muscle triglyceride content was highly variable and the degree to which TAG content increased was diet-dependent. TAG content increased in the gastrocnemius of mice on HFD, while TAG content increased in the quadriceps of mice on the Western diet (Fig. 2, B and C).
Figure 2.
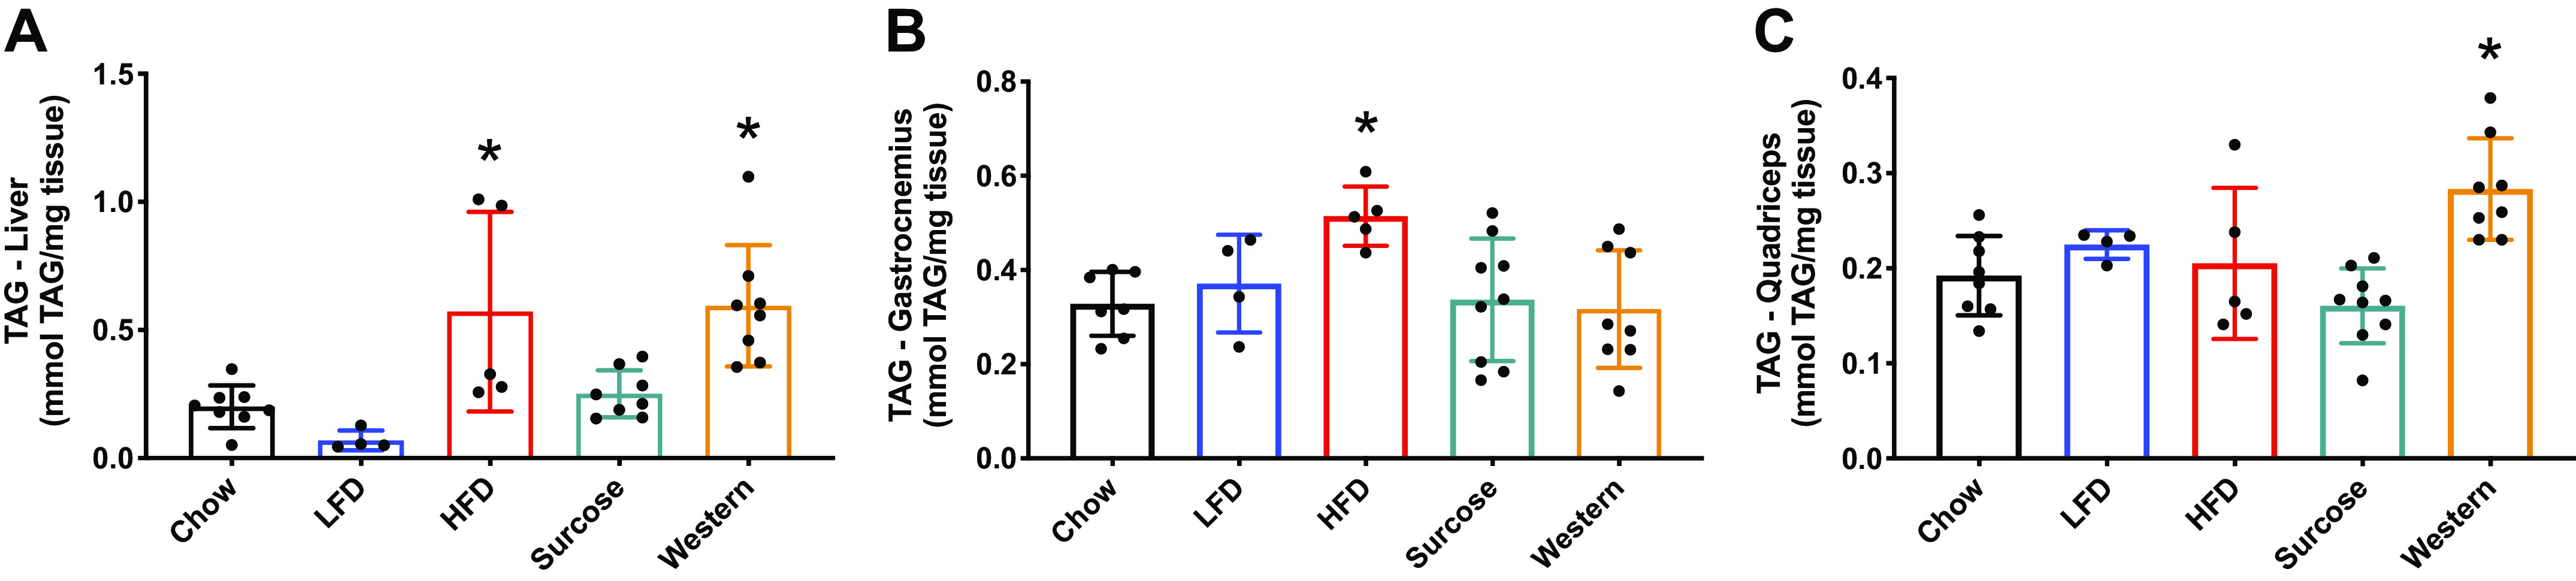
Twenty-eight weeks under various diet compositions affected muscle TAG content in a muscle/liver specific manner. Liver (A), gastrocnemius (B), and quadriceps triglyceride content (C). Data were analyzed by one-way ANOVA. P < 0.05. Asterisk (*) denotes significant difference from chow group. Values are means ± SD; n = 4–8 mice per group. ANOVA, analysis of variance; HFD, high-fat diet; LFD, low-fat diet; TAG, triglyceride.
Intramyocellular lipid content was also measured in the gastrocnemius muscle using Oil Red O, which stains for neutral lipids. Following 28 wk, both diets rich in saturated fat increased the neutral lipid content in the muscle compared with the chow diet (Fig. 3). The difference in the results obtained using TAG and Oil Red O can be explained, in part, by the different types of lipids measured by each method (33, 35). Briefly, Oil Red O identifies the most hydrophobic and neutral lipids (i.e., triglycerides, diacylglycerols, and cholesterol esters), but not biological membranes (i.e., phospholipids, sphingolipids, and ceramides), while the TAG assay identifies triglycerides, monoglycerides, and diglycerides, but not other lipids.
Figure 3.

Neutral lipids in gastrocnemius muscle after 28 wk on different diets. Gastrocnemius lipids quantification (A) and representative images of the gastrocnemius myofibers following Oil Red O stain (B). Data were analyzed by one-way ANOVA. P < 0.05. * versus chow. Values are means ± SD; n = 4–5 mice per group. ANOVA, analysis of variance; HFD, high-fat diet; LFD, low-fat diet.
Diet-Specific Changes in Glucose Tolerance and Insulin Insensitivity
It has been suggested that increases in intramyocellular lipids (neutral lipids) are associated with insulin resistance and suppression of muscle protein synthesis, leading to decreases in muscle function (17, 36–38). The effect of diet composition on glucose intolerance and insulin sensitivity was measured by GTT and ITT (Fig. 4). Fasting blood glucose and insulin were significantly elevated in only the HFD group relative to the chow group after 21 wk on the diets (Fig. 4, A and B). GTT revealed that only the HFD demonstrated glucose intolerance compared with chow (Fig. 4, C and D). Further, ITT revealed a decreased sensitivity to insulin in only the HFD group relative to the chow group (Fig. 4E). In addition to inducing glucose intolerance, HFD reduced the rate of glucose disappearance rate (Kitt) during ITT, indicating a reduced responsiveness to insulin (Fig. 4F).
Figure 4.
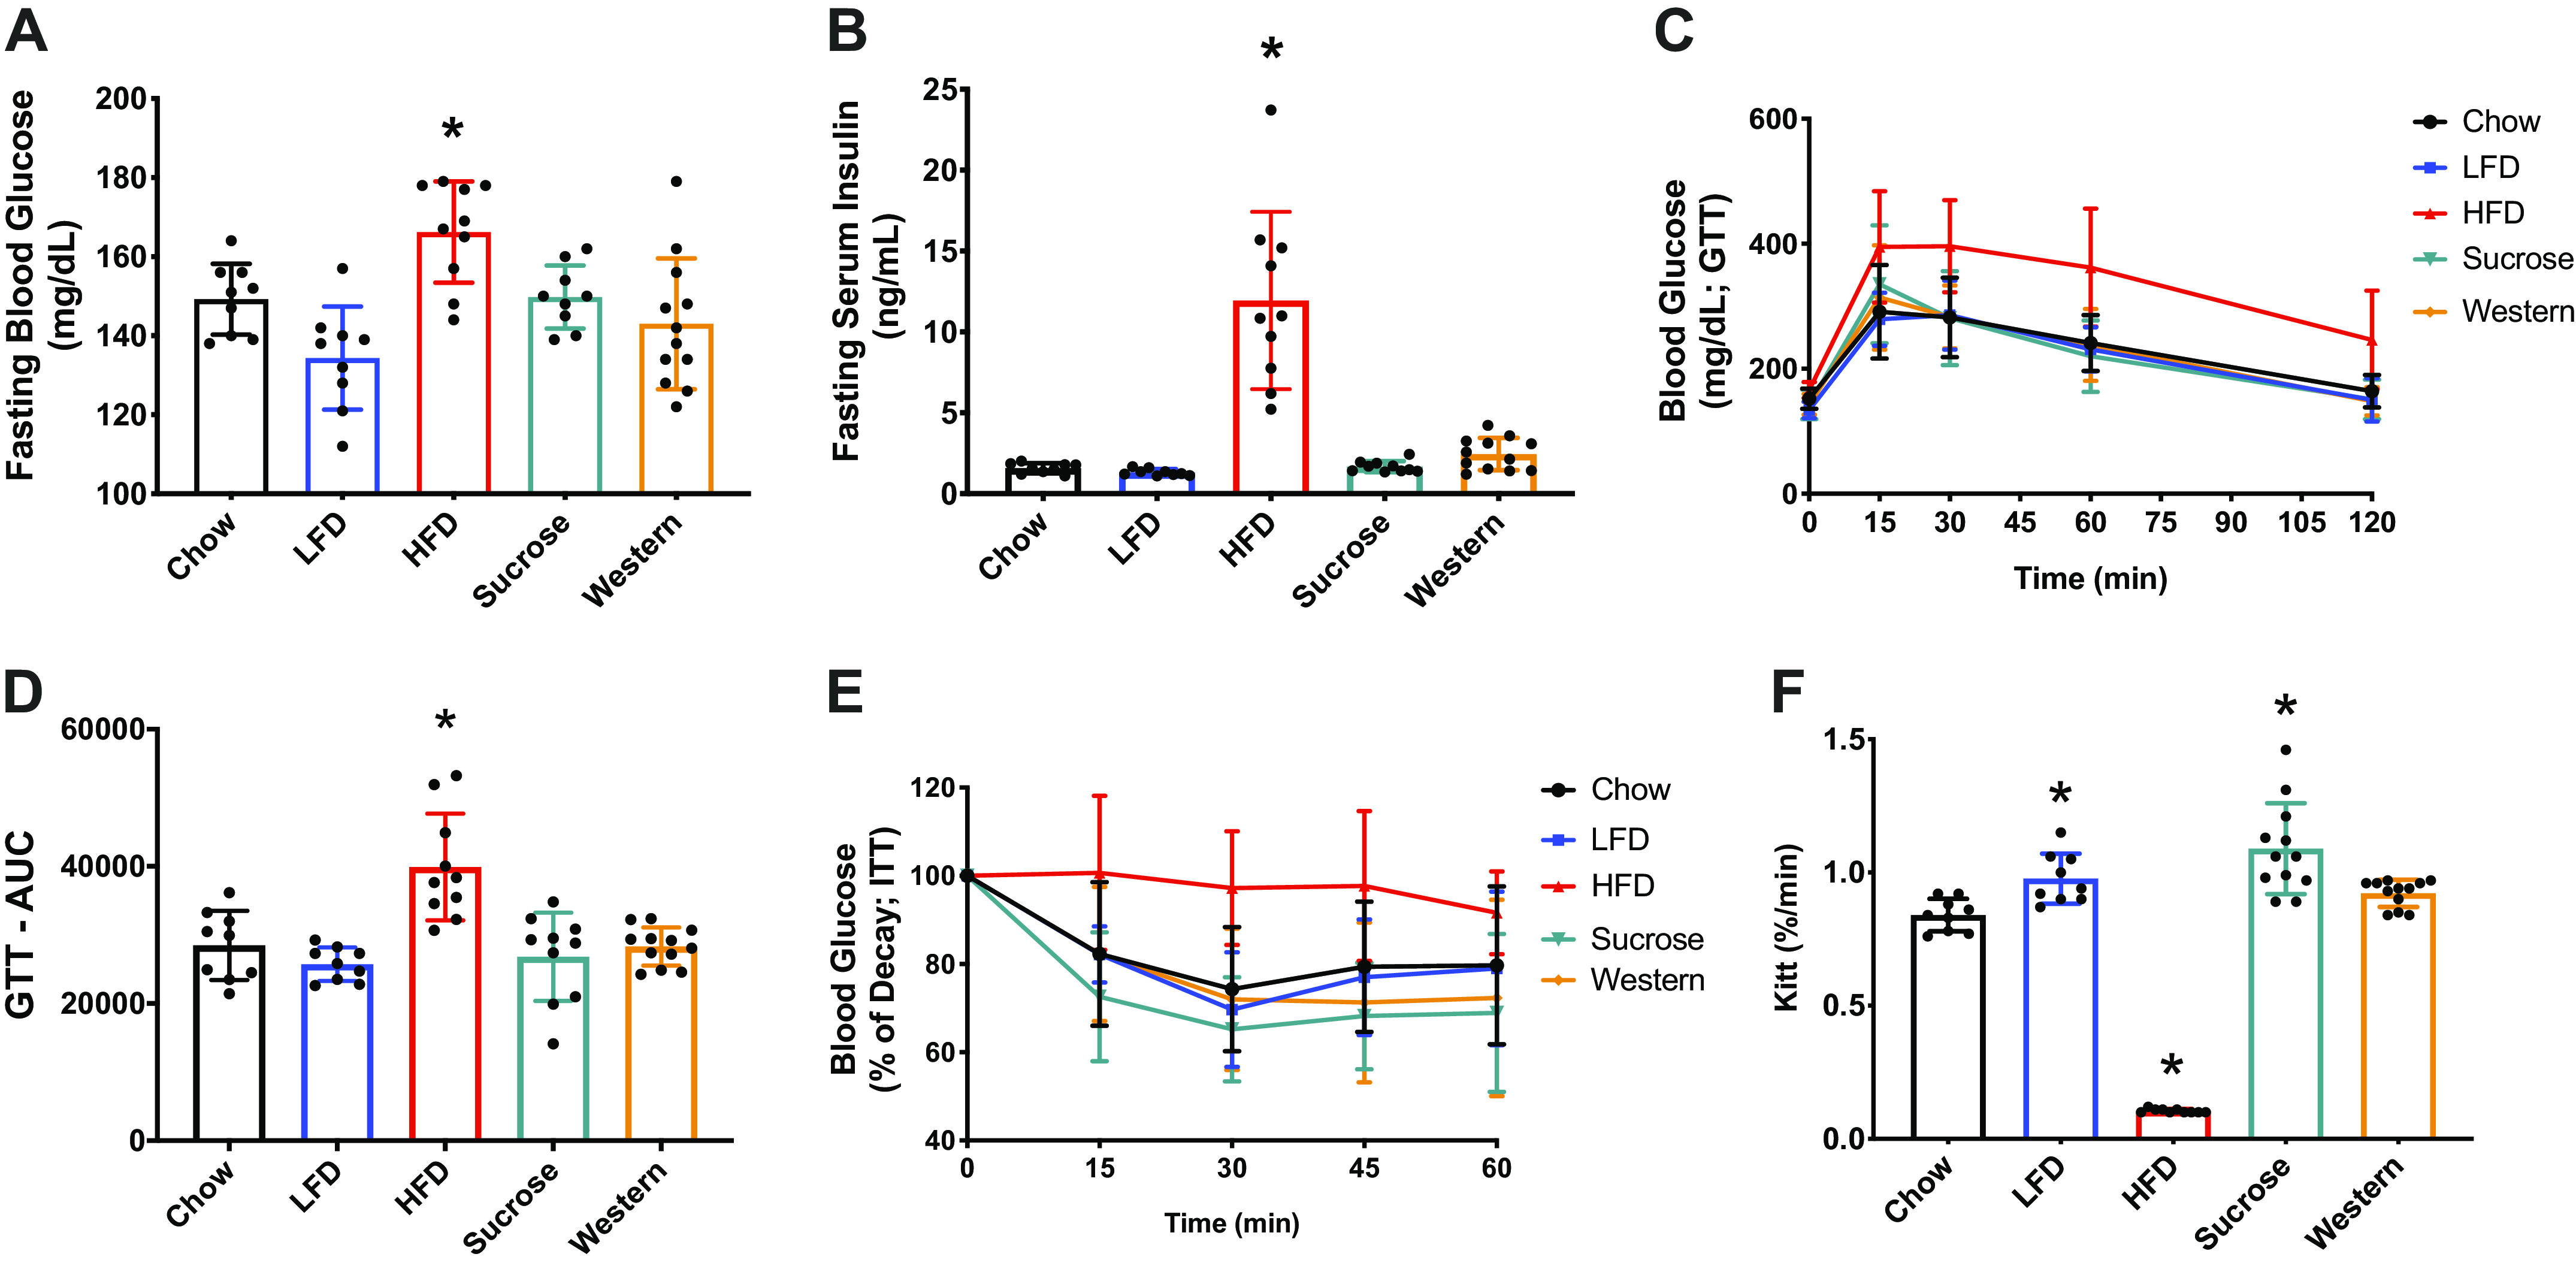
Long-term high-fat diet, not sucrose or Western diet, promotes glucose intolerance and insulin resistance. Fasting blood glucose (A), fasting plasma insulin (B), glucose tolerance test (GTT) performed after 21 wk on each diet (C), GTT area under the curve (D), insulin tolerance test (ITT) (E), and KITT (%/min) (F), plasma glucose disappearance rate in the insulin tolerance test performed after 22 wk on each diet. Data were analyzed by one-way ANOVA. P < 0.05. Asterisk (*) denotes significant difference from chow group. Values are means ± SD; n = 9–10 mice per group. insulin tolerance test (ITT) performed after 22 wk on each diet (E). ANOVA, analysis of variance; HFD, high-fat diet; LFD, low-fat diet.
Interesting, despite the diet-induced obesity, mice on the Western diet were neither glucose-intolerant nor insulin-resistant. However, when a shorter diet period was examined (14 wk), mice fed an HFD and a Western diet developed higher basal glucose and insulin levels (Fig. 5, A and B), glucose intolerance (Fig. 5, C and D), and insulin sensitivity as demonstrated by Kitt (%/min) (Fig. 5F).
Figure 5.

Short-term high-fat diet and Western diet, promotes glucose intolerance and insulin resistance. Fasting blood glucose (A), fasting serum insulin (B), glucose tolerance test (GTT) performed after 9 wk on each diet (C), GTT area under the curve (D), insulin tolerance test (ITT) (E), and KITT (%/min) (F), plasma glucose disappearance rate in the insulin tolerance test were performed after 10 wk on each diet. Data were analyzed by one-way ANOVA. P < 0.05. Asterisk (*) denotes significant difference from chow group. Values are means ± SD; n = 8 mice per group. ANOVA, analysis of variance; HFD, high-fat diet; LFD, low-fat diet.
Diet-Induced Obesity Does Not Induce Muscle Atrophy or Contractile Dysfunction
It has been postulated that diet-induced obesity and accumulation of intramyocellular lipids could reduce muscle strength and lead to muscle atrophy (15, 17). However, NMR analysis of body composition did not show changes in lean mass resulting from the different diet innervations. To more directly address the possibility of diet effects on muscle size and function, we first assessed muscle contractile function after 24 wk on the diet (Fig. 6). No differences were observed in the maximal isometric torque of the ankle plantar flexors (Fig. 6A) or ankle dorsiflexors (Fig. 6D) across diet groups. When normalized to body weight, maximal isometric torque decreased in the HFD group (Fig. 6, B and E). However, when normalized to lean muscle mass obtained from NMR, no differences were observed in the isometric torque across the groups (Fig. 6, C and F).
Figure 6.
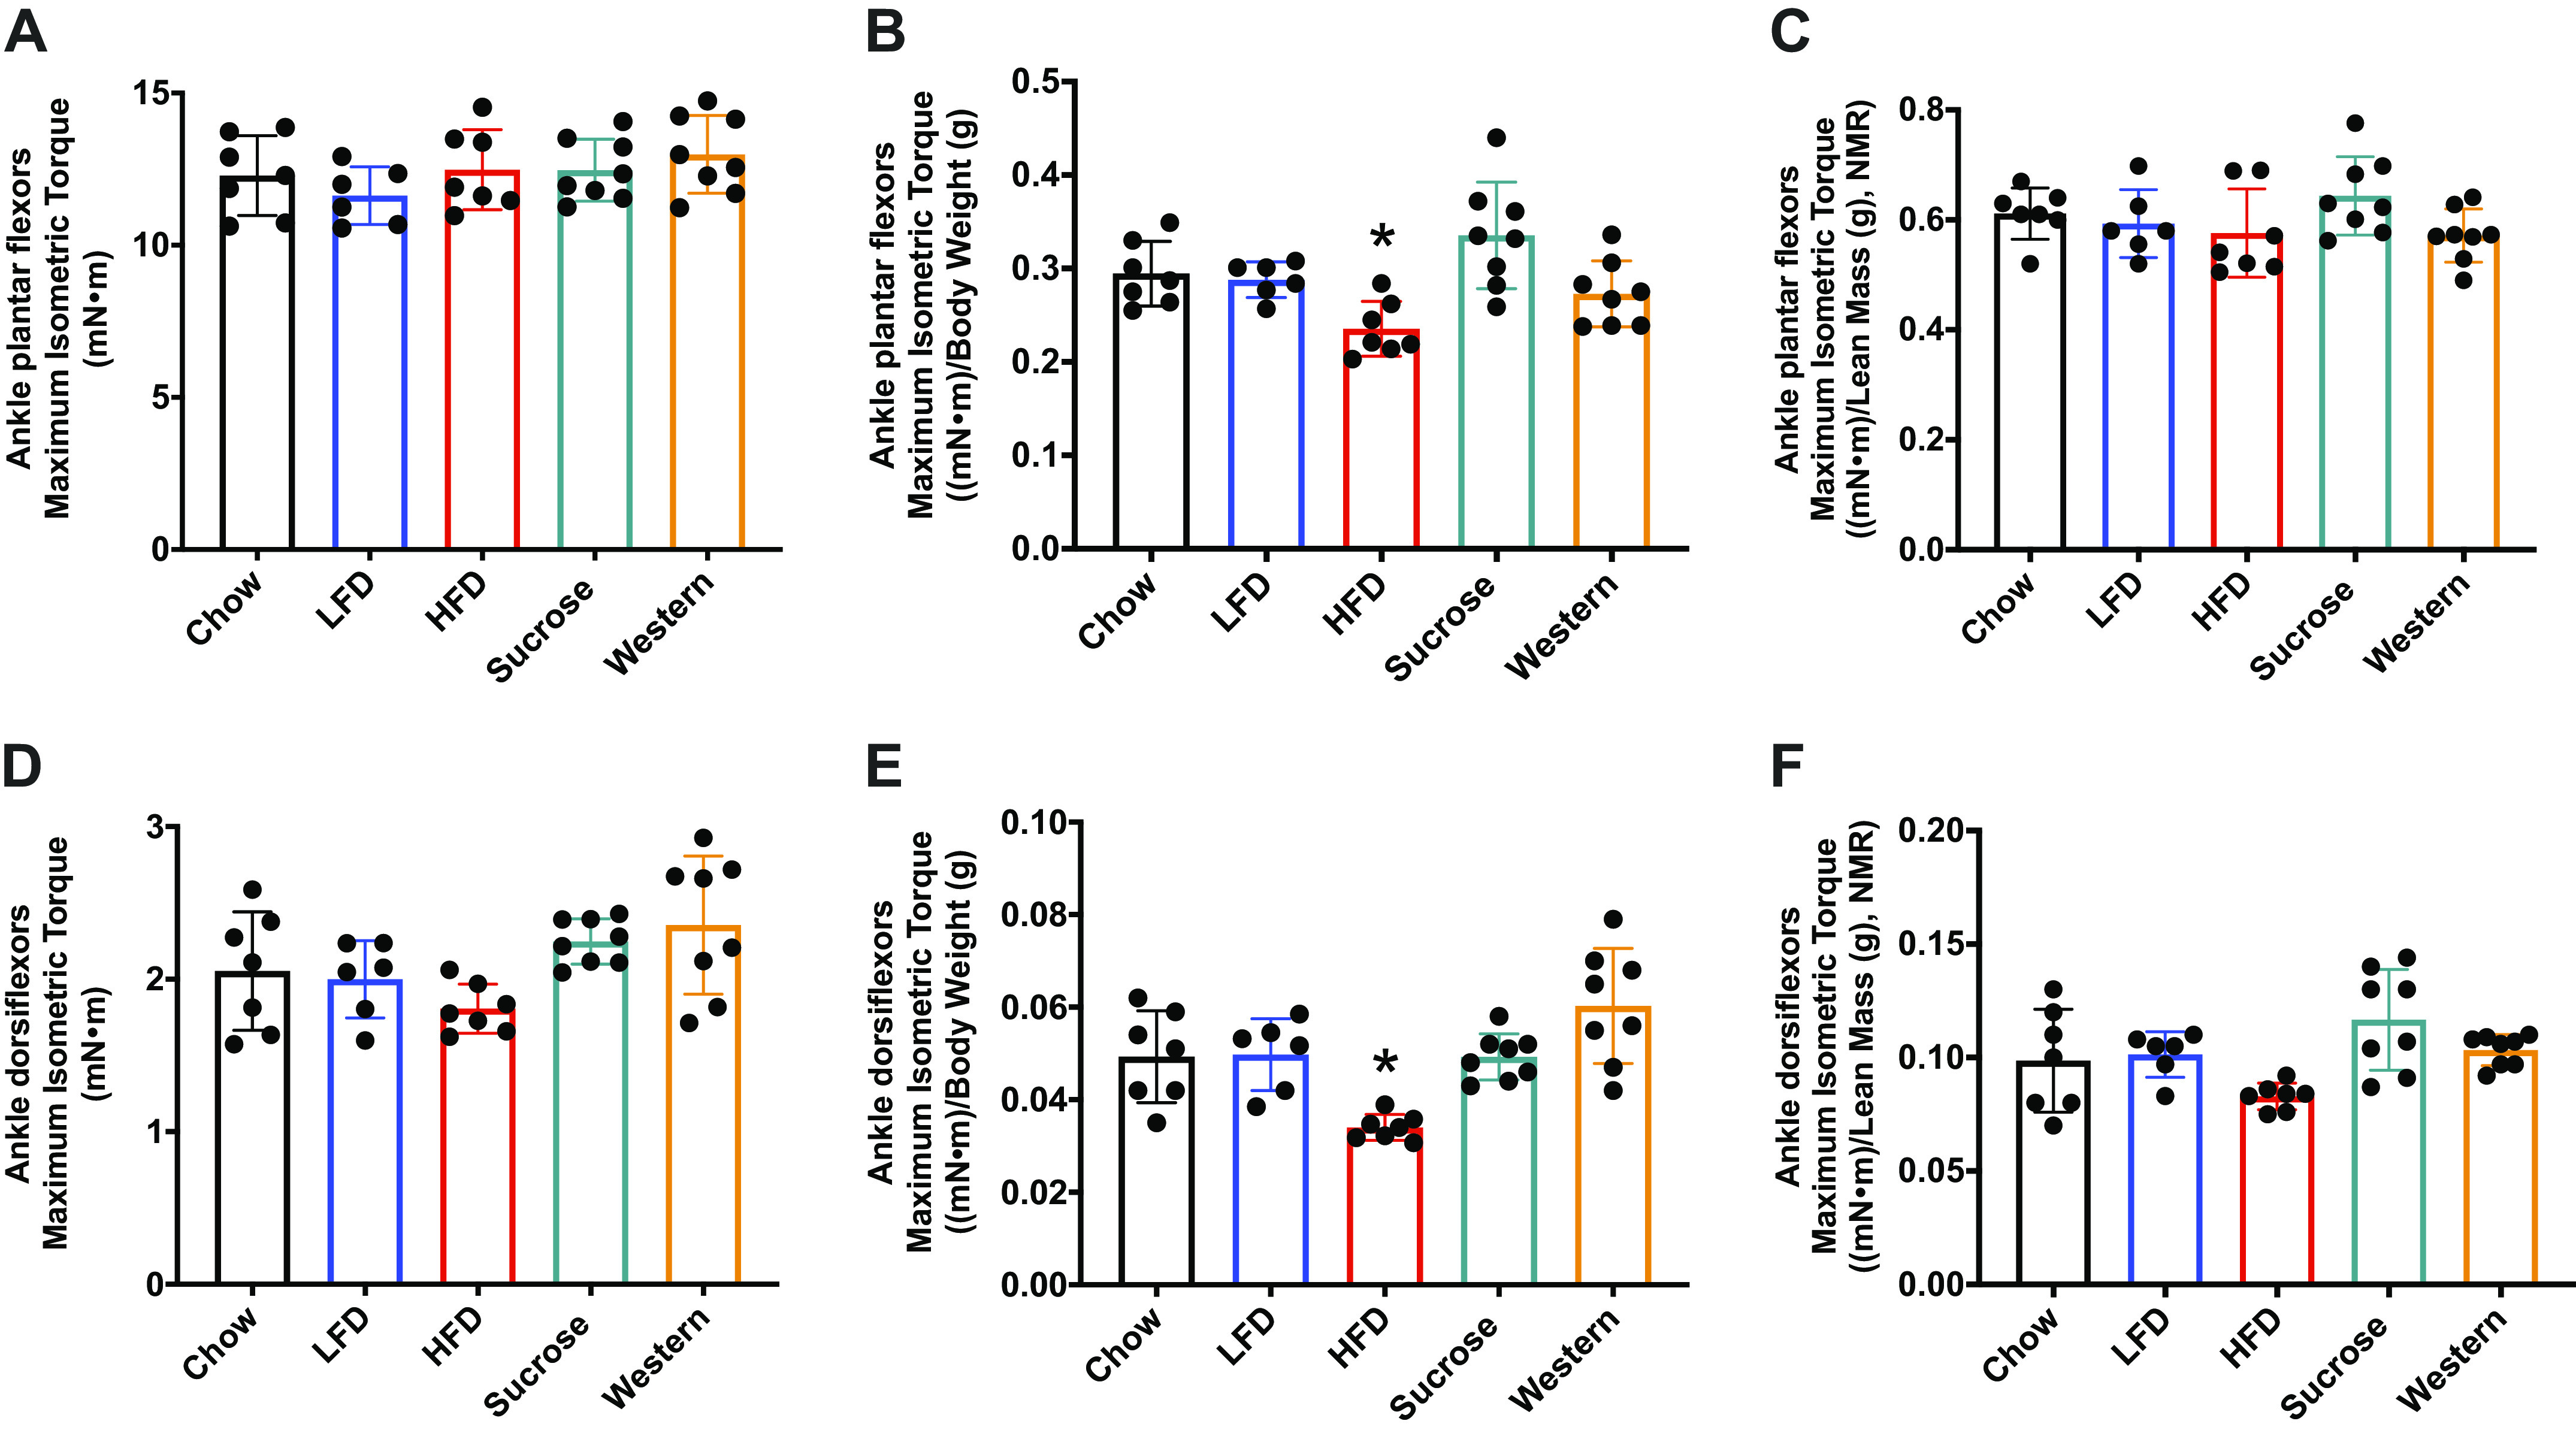
Muscle contractile function is not impacted by diet fat content. A: maximum isometric torque (mN·m) on ankle plantar flexors (A) and ankle dorsiflexors muscles (D) after 24 wk of diet compared with chow group. Muscle strength normalized by body weight [(mN·m)/body weight (g)] (B and E). Muscle strength normalized by lean muscle mass from NMR [(mN·m)/lean mass (g), NMR] (C and F). Data were analyzed by one-way ANOVA. P < 0.05. Asterisk (*) denotes significant difference from chow group. Values are means ± SD; n = 6–8 mice per group. ANOVA, analysis of variance; HFD, high-fat diet; LFD, low-fat diet; NMR, nuclear magnetic resonance.
Second, we measured the wet weight of multiple muscles upon termination of the experiment at 28 wk on diet. As shown in Fig. 7, no differences were found in the mass of the soleus, tibialis anterior, and gastrocnemius muscles across the groups as measured by absolute wet weight (mean ± SD). However, we found an increase in wet muscle weight for the plantaris and quadriceps muscles (Fig. 7, D and N). Muscle mass was also examined in relationship to whole body weight, lean mass as derived from NMR (Fig. 7), and tibia length (Supplemental Fig. S1; see https://doi.org/10.6084/m9.figshare.13046102.v1). When wet weight was normalized to whole body weight, a decrease in muscle size was found for the tibialis anterior, gastrocnemius, and quadriceps muscles. In contrast, when wet weight was normalized to lean mass as derived from the NMR measurements or tibia length (Supplemental Fig. S1), no muscles decreased in size because of diet when compared with chow; the plantaris muscle in the HFD group increased in size relative that in the chow group. Overall, the data suggest that none of the diets resulted in a loss of muscle mass, and the only muscle to show an increase in muscle mass was the plantaris.
Figure 7.

High-fat, sucrose, or Western diet, do not cause muscle atrophy. Soleus (mg) (A), soleus (mg/g body weight) (B), soleus (mg/g lean mass (C), NMR), plantaris (mg) (D) plantaris (mg/g body weight) (E), plantaris (mg/g lean mass, NMR) (F), tibialis anterior (mg) (G), tibialis anterior (mg/g body weight) (H), tibialis anterior (mg/g lean mass, NMR) (I), gastrocnemius (mg) (J), gastrocnemius (mg/g body weight) (K), gastrocnemius (mg/g lean mass, NMR) (L), quadriceps (mg) (M), quadriceps (mg/g body weight) (N), and quadriceps (mg/g lean mass, NMR) (O), after 28 wk on different diets. Data were analyzed by one-way ANOVA. P < 0.05. Asterisk (*) denotes significant difference from chow group. Values are means ± SD; n = 4–9 mice per group. ANOVA, analysis of variance; HFD, high-fat diet; LFD, low-fat diet; NMR, nuclear magnetic resonance.
Next, we measured cross-sectional area (CSA) of fibers in the mid-belly of the gastrocnemius muscle and plantaris muscles (Fig. 8). For the medial gastrocnemius, histograms of the frequency distribution of fiber CSAs revealed no shift toward smaller fibers, and in fact the two high-fat diet groups (i.e., HFD and Western presented a leftward shift, indicating a higher proportion of fibers with CSA > 2,000 µm2 (Fig. 8A). No significant differences were observed across diet groups (Fig. 8B). For the plantaris, a muscle that showed an increase in wet weight in the HFD group, no significant differences in mean fiber CSA or distribution of fiber CSAs were observed across the diet groups (Fig. 8, C and D).
Figure 8.

Fiber cross section area in unaffected by diets with high fat content. Frequency distribution of fiber cross section area in the MG (A) and plantaris (C). Mean cross section area of the MG (B) and plantaris (D) across the diets. Data were analyzed by one-way ANOVA. Values are means ± SD; n = 4–8 mice per group. ANOVA, analysis of variance; CA, cross-sectional area; HFD, high-fat diet; LFD, low-fat diet.
Finally, puromycin incorporation revealed no changes in muscle basal protein synthesis across the diet groups (Fig. 9). These results suggest that diet-induced obesity does not induce muscle atrophy or the loss of muscle function.
Figure 9.
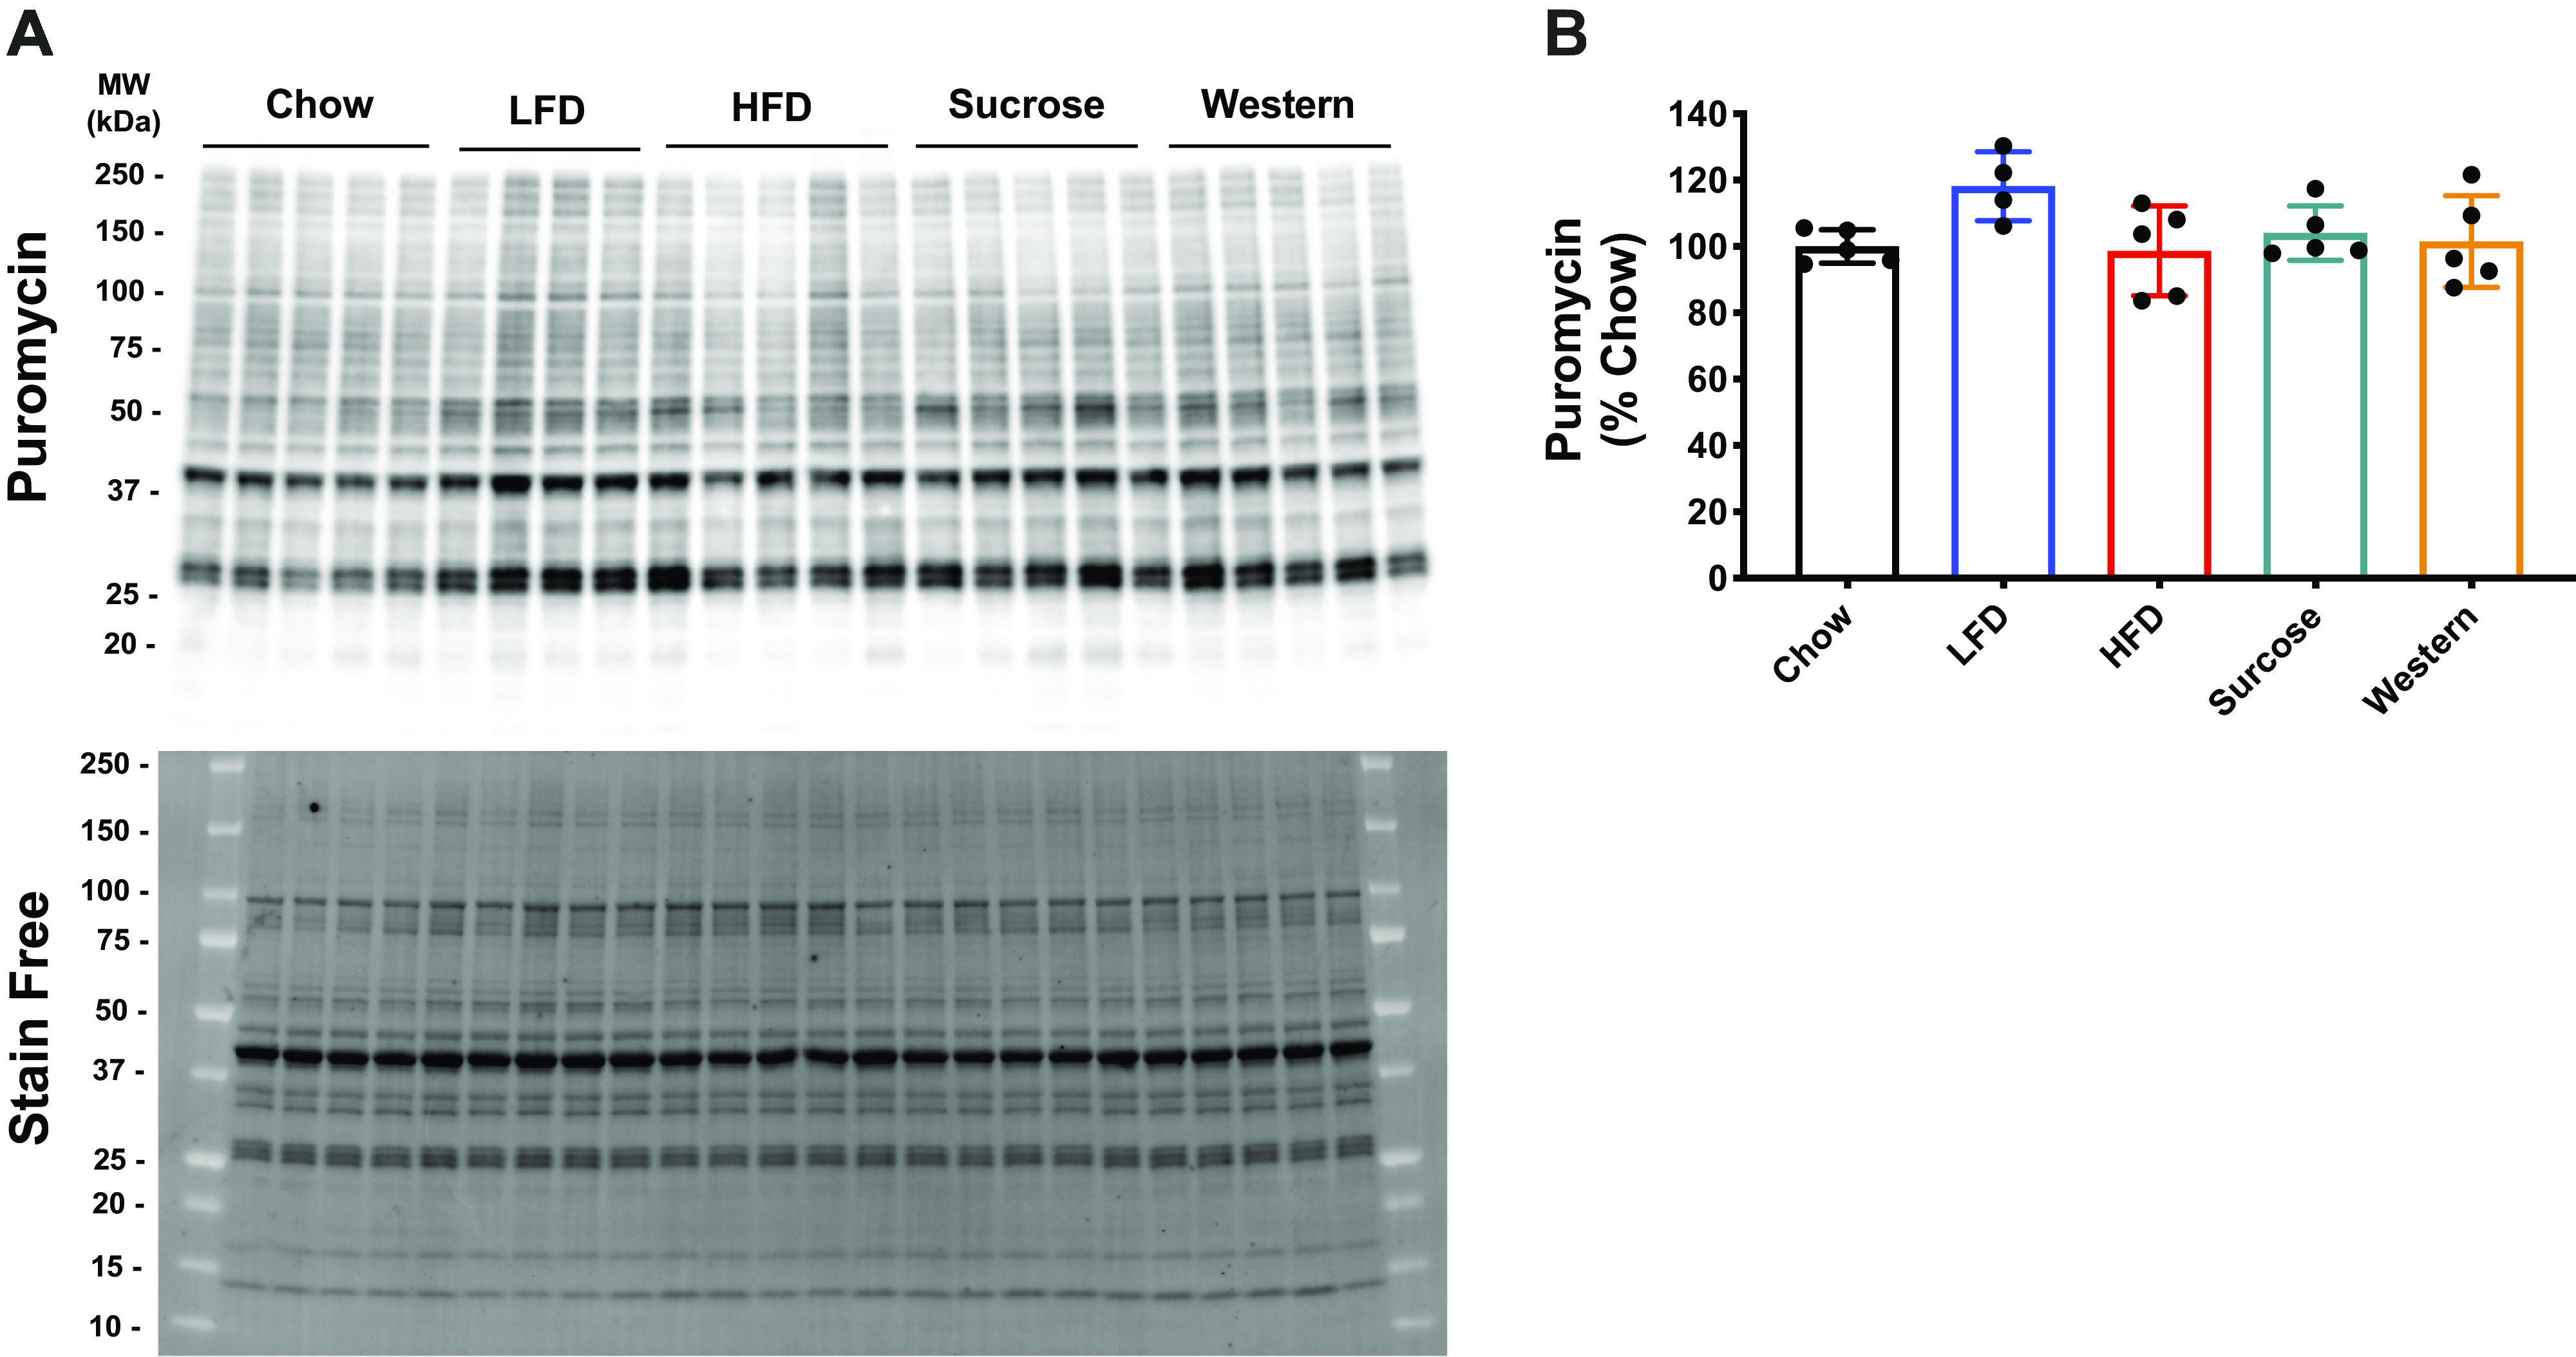
Muscle protein synthesis in mice after 28 wk on various diets. Puromycin and stain free representative image of Western blot (A). Stain free was utilized to do the total protein expression normalization. Quantification of the puromycin Western blot (B). Data were analyzed by one-way ANOVA. Values are means ± SD; n = 4–5 mice per group. ANOVA, analysis of variance; HFD, high-fat diet; LFD, low-fat diet.
Effect of Diet Composition on Skeletal Muscle Growth
Previously, we showed that 15 wk on a 45% HFD resulted in attenuated growth of the plantaris muscle in response to functional overload. In the current study we examined the impact of diet composition and a longer diet intervention on the growth response to an increase in external loading that was imposed on the plantaris by synergist ablation (i.e., functional overload). For each diet group, growth was expressed as percent increase relative to the respective diet control. In response to 14 days of FO, the plantaris wet weight significantly increased in all diet groups. However, the growth response in the HFD (132%) and Western (133%) groups was significantly less than that observed in the chow group (156%). At 30 days of FO, however, the Western (165%) diet group showed similar growth as the chow (161%) group, while the HFD (134%) group continued to show attenuated growth (Fig. 10). All groups showed similar increases in protein synthesis, as measured by puromycin, at 14 and 30 days post functional overload (Fig. 11).
Figure 10.
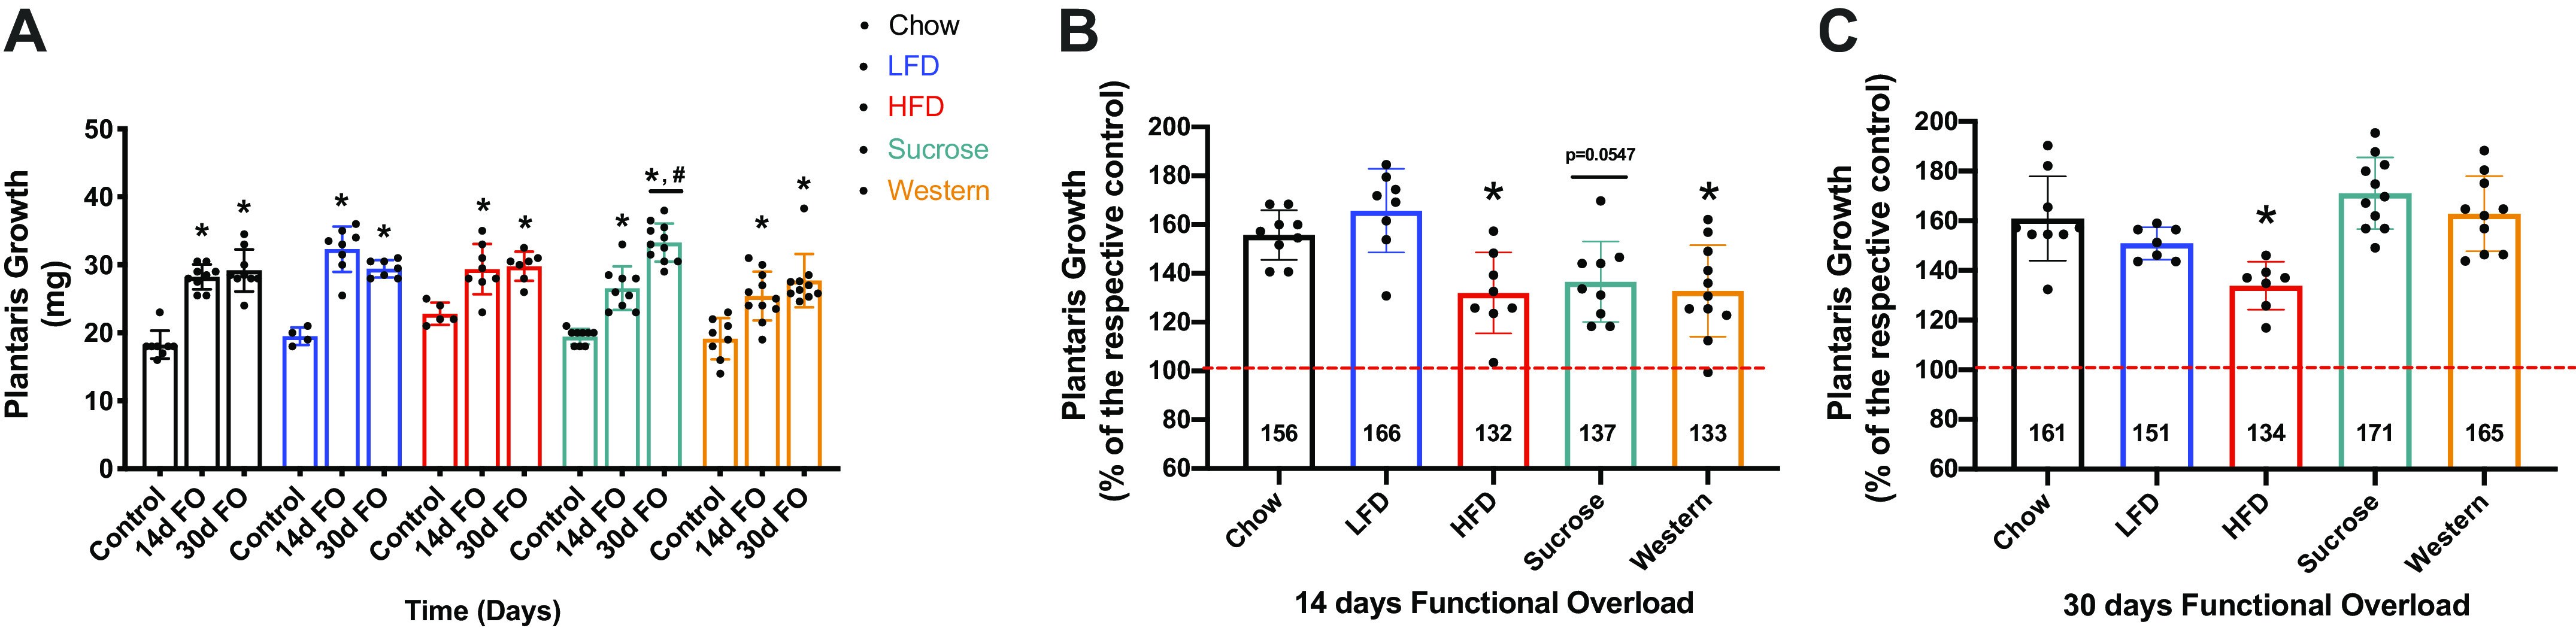
Plantaris growth (absolute and relative) in mice after 14 and 30 days of functional overload. Plantaris growth (mg) after 14 and 30 days of functional overload (A). Data were analyzed by two-way ANOVA. P < 0.05. Asterisk (*) denotes significant difference from respective control. Pound (#) denotes significant difference from sucrose 14 days FO. Values are means ± SD; n = 4–11 mice per group. Plantaris growth after 14 days FO (B) and (C) 30 days FO. Data were analyzed by one-way ANOVA. P < 0.05. Asterisk (*) denotes significant difference from chow 14 days FO (B) or chow 30 days FO (C). Values are means ± SD; n = 4–11 mice per group. ANOVA, analysis of variance; FO, functional overload; HFD, high-fat diet; LFD, low-fat diet.
Figure 11.

Muscle protein synthesis in mice after 14 and 30 days of functional overload. Puromycin and stain free representative image of Western blot. Stain free was utilized to do the total protein expression normalization (A and B). Quantification of the puromycin Western blot for 14 days FO (C) and 30 days FO (D) groups. Data were analyzed by one-way ANOVA. P < 0.05. Asterisk (*) denotes significant difference from chow group. Values are means ± SD; n = 4–8 mice per group. ANOVA, analysis of variance; FO, functional overload; HFD, high-fat diet; LFD, low-fat diet.
DISCUSSION
To the best of our knowledge, the current study is the first to directly compare the effects of multiple diets, with different fat sources (lard versus milk fat) on weight gain, muscle function and growth response, as well as glucose homeostasis, in male C57BL6 mice. As expected, diets rich in calories coming from fat promoted significantly greater weight gain than diets low in saturated fats (i.e, chow, LFD, and high sucrose diets). Examination of the mass of multiple hind limb muscles revealed that diet-induced obesity had no negative effect on muscle mass. We did find that in response to 28 wk on the HFD, selected muscles (quadriceps and plantaris) showed an increase in wet weight, but not fiber cross-sectional area. Thus, the increase in body weight in the HFD and Western diet groups, coupled with normal cage activity, did not appear to be sufficient to induce muscle hypertrophy. To test if these mice could respond to a growth cue, such as increased external loading, we exposed the plantaris muscle to functional overload for a duration up to 30 days. Mice in all diet groups showed significant hypertrophy in response to functional overload. Interestingly, mice on the Western diet showed delayed growth at 14 days, but by 30 days, their growth was comparable to growth of the mice in the chow group. However, only mice in the HFD group showed attenuated growth at 30 days post functional overload. A major difference between the HFD group and the other diet groups was the finding that only the HFD group developed glucose intolerance and insulin resistance. The development of insulin resistance and glucose intolerance in the HFD mice had no apparent negative effect on baseline muscle mass or contractile function; however, it may have had a negative impact on the ability of muscle to hypertrophy. In the current study, we found no differences across the groups in protein synthesis measured at 14 and 30 days post functional overload by puromycin. It is possible, that differences in protein synthesis may have been apparent at earlier time points. In our previous study, we did find significant differences in the polysome profiles of chow and 15-wk HFD mice at 3 and 7 days post functional overload (8). It is also possible that puromycin was not sensitive enough to pick up differences in protein synthesis, especially the synthesis of proteins that have a slow turnover.
In the present study we also wanted to examine the impact of chronic obesity on baseline muscle mass, as a few studies have reported muscle atrophy (18, 39–41). The impact of diet-induced obesity on the mass of limb muscles has been examined in previous rodent studies (7, 9, 23); however, the majority of studies limit their analysis to one or two muscles, and the muscles most often studied are the soleus (SOL, a predominately slow twitch, load-bearing muscle) and the extensor digitorum longus (EDL, a predominantly fast twitch, nonload-bearing muscle). The choice of these two muscles is influenced by the fact that the contractile properties of SOL and EDL can be tested in vitro, at least in mice. It is often difficult to compare the results of diet-induced obesity studies because of significant differences in experimental design, such as, diet composition, duration of diet intervention, mouse strain tested, and age of the mice at the initiation of the diet. For example, Ciapaite et al. (42) examined the effects of a 45% lard-based high-fat diet on EDL and SOL of 12-wk-old male C57BL6 mice. After 5 wk on the diets, there was a significant increase in the absolute mass of SOL, but not in that of EDL. Normalization of muscle mass to body weight showed no change in the soleus and a decrease in the EDL. Messa et al. (23) fed female CD1 mice a 63% HFD, with sunflower as the fat source, and found no change in the absolute mass of SOL or EDL after 8 wk, but they noticed an increase in the mass of both muscles after 16 wk. Interestingly, after 16 wk of HFD they found an increase in fiber cross-sectional area in SOL but no change in the fiber CSA in EDL. An important difference between the 8- and 16-wk diet groups was that the mice fed the HFD for 16 wk started the diet at 4 wk of age, while the mice fed the diet for 8 wk started the diet at 8 wk of age. A long-term study in C57BL/6 mice was performed by DeNies et al. (43) who fed a 60% HFD (lard as the fat source) to 21-day-old C57BLK/6J mice for approximately 1 yr and found no difference in absolute muscle mass (mg) of the soleus, plantaris, and gastrocnemius. These data show that the timing of the diet, the composition of the diet (60% vs. 45% fat), and the mouse strain utilized can influence the study outcomes, making comparisons across studies difficult.
In this study we found that long-term diet-induced obesity did not induce muscle atrophy or weakness in C57BL6 mice, as has been reported in other studies (18, 39–41). The differences between our results and those of previous publications can be explained, at least in part, by the different methods used to report muscle mass. Those studies that have reported muscle atrophy have based their conclusions on absolute muscle mass normalized to body weight (mass in mg/body weight in grams) (18, 39–41). This is problematic, particularly in a diet-induced obesity model because body weight tends to increase dramatically because of increased body fat content. In the present study, we report absolute muscle mass (i.e., wet weight in mg), as well as relative muscle mass normalized to tibial length, lean body mass (as determined by NMR), and whole body weight. We found no evidence of a loss of muscle mass based on absolute muscle mass or muscle mass normalized to lean body mass or tibial length. We did find an increase in the absolute mass of the plantaris and quadriceps in response to the HFD, but not in response to the Western diet, both of which induced a significant gain in body weight. The HFD did induce a greater gain in body weight than the Western diet, and thus, it could have resulted in greater loading of the hind limb muscles and acted as a stimulus for muscle growth. However, the extent to which the gain in muscle wet weight is related to hypertrophy is unclear. Examination of fiber cross-sectional area in the plantaris and gastrocnemius muscles revealed no change in mean fiber cross-sectional area. Further, assessment of body composition by NMR also found no evidence for a change in lean body mass in mice that became obese by consuming an HFD or Western diet. It might be argued that lean mass should have increased in the HFD and WD groups owing to the significant increase in body mass. This presumes that the external loading on the limb muscles significantly increased because of the added body weight and that the lean body mass was inadequate, resulting in functional impairment, and thus a stimulus to hypertrophy. We would suggest that the diet-induced obesity in the HFD and WD groups did not impair normal cage activity of the mice, and thus, there was not a chronic load-induced growth stimulus. When these mice were challenged with a strong growth stimulus, i.e., functional overload, the plantaris muscle was able to produce a growth response. However, the growth response was attenuated, especially in the HFD group. These data show that diet composition and obesity can contribute to impairments in muscle hypertrophy and suggest that chronic morbid obesity could lead to functional impairments owing to inadequate muscle mass and strength.
An increase in muscle wet weight following diet-induced obesity could be related to an increase in intramuscular triglycerides. Diets rich in fatty acids are associated with increased plasma levels of triglycerides (TAG) and free fat acids (FFAs). Adipose tissue has a limited capacity to store fatty acids, and according to the lipid overflow hypothesis, when this limit is exceeded, excess triglycerides will be directed to other tissues, such as liver and skeletal muscle (lipid overflow hypothesis) (44). This is considered a beneficial adaptation to compensate for the excess of lipids in plasma. However, chronic elevation of lipids in liver and skeletal muscle, a phenomenon known as ectopic fat storage, leads to insulin resistance (6, 45). Both the HFD and Western diets, which induced obesity, increased TAG content in liver compared with chow control (Fig. 2A). TAG content was significantly increased in the gastrocnemius of mice on an HFD (Fig. 2B), while mice fed a Western diet showed a significant increase of TAG in the quadriceps (Fig. 2C). The Oil Red O stain was used to detect neutral lipids in the gastrocnemius muscle, and it was revealed that both the HFD and Western diets increased lipid content in skeletal muscle fibers (Fig. 3, A and B). The increase in intramyocellular lipids did not appear to have had a significant effect on fiber cross-sectional area or mean fiber size in the gastrocnemius muscle. Similar results were shown by Pincu et al. (46) who found no change in fiber size in the gastrocnemius following 12 wk on a 60% HFD.
Skeletal muscle expresses a high amount of cytoskeleton proteins prone to misfolding and aggregation, thereby relying on a dynamic balance between protein synthesis and degradation (47, 48). Although, it has been postulated that high levels of lipids may impair muscle protein synthesis leading to a reduction in muscle mass (18, 39, 40), it remains unclear whether increases of intramyocellular lipids directly affects protein synthesis, muscle mass, and contractile function in humans (49, 50) or animals (51, 52). To this matter, we found that neither the HFD nor the Western diet resulted in a decrease in basal protein synthesis, as measured by puromycin. Furthermore, muscle contractile function was preserved in mice on these diets as measured by in vivo isometric torque (absolute) of ankle extensor and flexor muscles. However, when normalized by body weight, maximal isometric torque is lower in the HFD group. Some human studies show that obese individuals have higher absolute strength in their lower limbs than nonobese individuals (1, 53, 54). It is postulated that greater body mass places an increased external load on the lower limb muscles, especially during locomotion, contributing to a gain of strength and muscle mass. On the other hand, when absolute torque is normalized to body weight, the relative strength is lower in the obese than in the nonobese in different populations (22, 23, 55, 56). A more appropriate normalization for torque would be muscle mass, but it is difficult to obtain measurements of muscle mass in humans. One alternative is to use lean body mass, as measured by the dual-energy X-ray absorptiometry (DEXA). In our study we obtained a measure of lean body mass using NMR. Normalization of torque to lean body mass revealed that neither the HFD nor the Western diet resulted in a decrease in isometric torque. Studies evaluating specific strength (force produced per cross-sectional area) in isolated muscles (SOL and EDL) show a reduction in obese animals (7, 9). These studies suggest that the reduction in relative strength is related to a possible reduction in locomotor activity in these obese animals. In our studies we did not make a direct measurement of cage activity so we cannot comment on whether the obese animals were more sedentary during their active period (i.e., the dark cycle).
Diets high in saturated fats have been shown to induce insulin resistance in mice after only 4 wk (57); thus, we measured glucose homeostasis in our five diet groups. We found that only the HFD group displayed insulin resistance and glucose intolerance at 28 wk post diet intervention. We were surprised to find that the group fed the Western diets for 28 wk did not have insulin resistance or glucose intolerance given previous reports (58, 59). One possible explanation for the difference observed between the HFD and Western diets could be the source of fat in the two diets; lard being the source of the saturated fat in the HFD and milk fat being the source of the saturated fat in the Western diet. An alternative explanation is that the mice on the Western diet became insulin-resistant in the short term, but they adapted over the 28-wk diet intervention. In fact, when we performed GTT and ITT after 9 and 10 wk of diet, respectively, we found that mice on either the HFD or Western diet had developed glucose intolerance and insulin resistance. A similar result was demonstrated when animals were subjected to a 45% HFD for 5 wk using two different fat sources (lard vs. palm oil) (42). However, in our study, only the HFD group remained intolerant to glucose and resistant to insulin after 21 (GTT) and 22 (ITT) wk of diet. A recent study has demonstrated that animals subjected to Western diet, (i.e., high fat, high sucrose diet) beyond 24 wk become obese without developing major metabolic complications. This adaptation was related to the improvement of β-cell function and leptin secretion, which potentiated the insulin secretion in the obese C57BL6 mice (59).
In conclusion, our study demonstrated that diet-induced obesity alone is not sufficient to cause muscle atrophy in mice irrespective of the development of insulin resistance and glucose intolerance. This observation is not necessarily in conflict with what is observed in humans. There are limited data showing that obesity alone or coupled with insulin resistance induces muscle atrophy in otherwise healthy people (6). In most cases, muscle atrophy associated with obesity and insulin resistance is coupled with other comorbidities such as age, heart disease, renal failure, or nerve injury (6, 60). Furthermore, in contrast to some animal and human studies (20–23), our study did not find that diet-induced obesity caused an increase in baseline muscle mass, especially of load-bearing muscles. One interpretation of this result is that the added body weight was not enough to provide an adequate increase signal to induce hypertrophy, especially when the mice were not challenged beyond normal cage activity. To examine their growth capacity, functional overload of the plantaris muscle was induced in mice in all diet groups. An attenuated growth response was found in only the HFD group, and it appears to be associated with diet composition as opposed to diet-induced obesity. Further study is needed to determine how diet composition, especially fat source, influences growth capacity. Other studies have shown that the 60% HFD can attenuate muscle regeneration following injury (61, 62). The results of our study reveal that our understanding of how obesity influences muscle mass and function requires further study, and that many variables need to be considered when designing and interpreting diet studies such as the impact of mouse strain, fat source, length of time on the diets, and the presence of comorbidities such as age, activity level, and disease.
GRANTS
This research was supported by a Grant from the National Institutes of Health (NIH/NIAMS R01 AR-070031).
DISCLOSURES
S.C.B. holds equity in Emmyon, Inc., and serves on the Scientific Advisory Board. None of the other authors has any conflicts of interest, financial or otherwise, to disclose.
AUTHOR CONTRIBUTIONS
L.G.O.S., A.G.M., J.E.N., J.C.R., and S.C.B. conceived and designed research; L.G.O.S., A.G.M., and J.D.F. performed experiments; L.G.O.S., A.G.M., J.E.N., J.D.F., V.A.L., J.C.R., and S.C.B. analyzed data; L.G.O.S., A.G.M., J.E.N., J.D.F., V.A.L., J.C.R., and S.C.B. interpreted results of experiments; L.G.O.S., A.G.M., J.E.N., J.D.F., V.A.L., J.C.R., and S.C.B. prepared figures; L.G.O.S., J.E.N., J.D.F., V.A.L., J.C.R., and S.C.B. drafted manuscript; L.G.O.S., A.G.M., J.E.N., J.D.F., V.A.L., J.C.R., and S.C.B. edited and revised manuscript; L.G.O.S., A.G.M., J.E.N., J.D.F., V.A.L., J.C.R., and S.C.B. approved final version of manuscript.
REFERENCES
- 1.Tomlinson DJ, Erskine RM, Morse CI, Winwood K, Onambele-Pearson G. The impact of obesity on skeletal muscle strength and structure through adolescence to old age. Biogerontology 17: 467–483, 2016. doi: 10.1007/s10522-015-9626-4. [DOI] [PMC free article] [PubMed] [Google Scholar]
- 2.Finkelstein EA. How big of a problem is obesity? Surg Obes Relat Dis 10: 569–570, 2014. doi: 10.1016/j.soard.2014.02.028. [DOI] [PubMed] [Google Scholar]
- 3.Finkelstein EA, Trogdon JG, Cohen JW, Dietz W. Annual medical spending attributable to obesity: payer-and service-specific estimates. Health Aff (Millwood) 28: w822–w831, 2009. doi: 10.1377/hlthaff.28.5.w822. [DOI] [PubMed] [Google Scholar]
- 4.Pahlavani M, Ramalingam L, Miller EK, Scoggin S, Menikdiwela KR, Kalupahana NS, Festuccia WT, Moustaid-Moussa N. Eicosapentaenoic acid reduces adiposity, glucose intolerance and increases oxygen consumption independently of uncoupling protein 1. Mol Nutr Food Res 63: e1800821, 2019. doi: 10.1002/mnfr.201800821. [DOI] [PMC free article] [PubMed] [Google Scholar]
- 5.Stenholm S, Sallinen J, Koster A, Rantanen T, Sainio P, Heliovaara M, Koskinen S. Association between obesity history and hand grip strength in older adults–exploring the roles of inflammation and insulin resistance as mediating factors. J Gerontol A Biol Sci Med Sci 66A: 341–348, 2011. doi: 10.1093/gerona/glq226. [DOI] [PMC free article] [PubMed] [Google Scholar]
- 6.Meex RCR, Blaak EE, van Loon LJC. Lipotoxicity plays a key role in the development of both insulin resistance and muscle atrophy in patients with type 2 diabetes. Obes Rev 20: 1205–1217, 2019. doi: 10.1111/obr.12862. [DOI] [PMC free article] [PubMed] [Google Scholar]
- 7.Hurst J, James RS, Cox VM, Hill C, Tallis J. Investigating a dose-response relationship between high-fat diet consumption and the contractile performance of isolated mouse soleus, EDL and diaphragm muscles. Eur J Appl Physiol 119: 213–226, 2019. doi: 10.1007/s00421-018-4017-6. [DOI] [PubMed] [Google Scholar]
- 8.Sitnick M, Bodine SC, Rutledge JC. Chronic high fat feeding attenuates load-induced hypertrophy in mice. J Physiol 587: 5753–5765, 2009. doi: 10.1113/jphysiol.2009.180174. [DOI] [PMC free article] [PubMed] [Google Scholar]
- 9.Tallis J, Hill C, James RS, Cox VMSeebacher F. The effect of obesity on the contractile performance of isolated mouse soleus, EDL, and diaphragm muscles. J Appl Physiol (1985) 122: 170–181, 2017. doi: 10.1152/japplphysiol.00836.2016. [DOI] [PubMed] [Google Scholar]
- 10.Thomas MM, Trajcevski KE, Coleman SK, Jiang M, Di Michele J, O'Neill HM, Lally JS, Steinberg GR, Hawke TJ. Early oxidative shifts in mouse skeletal muscle morphology with high-fat diet consumption do not lead to functional improvements. Physiol Rep 2: e12149, 2014. doi: 10.14814/phy2.12149. [DOI] [PMC free article] [PubMed] [Google Scholar]
- 11.DeFronzo RA, Jacot E, Jequier E, Maeder E, Wahren J, Felber JP. The effect of insulin on the disposal of intravenous glucose. Results from indirect calorimetry and hepatic and femoral venous catheterization. Diabetes 30: 1000–1007, 1981. doi: 10.2337/diab.30.12.1000. [DOI] [PubMed] [Google Scholar]
- 12.Egan B, Zierath JR. Exercise metabolism and the molecular regulation of skeletal muscle adaptation. Cell Metab 17: 162–184, 2013. doi: 10.1016/j.cmet.2012.12.012. [DOI] [PubMed] [Google Scholar]
- 13.Zurlo F, Larson K, Bogardus C, Ravussin E. Skeletal muscle metabolism is a major determinant of resting energy expenditure. J Clin Invest 86: 1423–1427, 1990. doi: 10.1172/JCI114857. [DOI] [PMC free article] [PubMed] [Google Scholar]
- 14.Gemmink A, Daemen S, Brouwers B, Huntjens PR, Schaart G, Moonen-Kornips E, Jörgensen J, Hoeks J, Schrauwen P, Hesselink MKC. Dissociation of intramyocellular lipid storage and insulin resistance in trained athletes and type 2 diabetes patients; involvement of perilipin 5? J Physiol 596: 857–868, 2018. doi: 10.1113/JP275182. [DOI] [PMC free article] [PubMed] [Google Scholar]
- 15.Kalyani RR, Corriere M, Ferrucci L. Age-related and disease-related muscle loss: the effect of diabetes, obesity, and other diseases. Lancet Diabetes Endocrinol 2: 819–829, 2014. doi: 10.1016/S2213-8587(14)70034-8. [DOI] [PMC free article] [PubMed] [Google Scholar]
- 16.Lipina C, Hundal HS. Lipid modulation of skeletal muscle mass and function. J Cachexia Sarcopenia Muscle 8: 190–201, 2017. doi: 10.1002/jcsm.12144. [DOI] [PMC free article] [PubMed] [Google Scholar]
- 17.Masgrau A, Mishellany-Dutour A, Murakami H, Beaufrère AM, Walrand S, Giraudet C, Migné C, Gerbaix M, Metz L, Courteix D, Guillet C, Boirie Y. Time-course changes of muscle protein synthesis associated with obesity-induced lipotoxicity. J Physiol 590: 5199–5210, 2012. doi: 10.1113/jphysiol.2012.238576. [DOI] [PMC free article] [PubMed] [Google Scholar]
- 18.Sishi B, Loos B, Ellis B, Smith W, Du Toit EF, Engelbrecht AM. Diet-induced obesity alters signalling pathways and induces atrophy and apoptosis in skeletal muscle in a prediabetic rat model. Exp Physiol 96: 179–193, 2011. doi: 10.1113/expphysiol.2010.054189. [DOI] [PubMed] [Google Scholar]
- 19.Tsintzas K, Jones R, Pabla P, Mallinson J, Barrett DA, Kim Dh Cooper S, Davies A, Taylor T, Gaffney C, Chee C, van Loon LJC, Stephens FB. Effect of acute and short-term dietary fat ingestion on postprandial skeletal muscle protein synthesis rates in middle-aged, overweight and obese men. Am J Physiol Endocrinol Metab 318: E417–E429, 2020. doi: 10.1152/ajpendo.00344.2019. [DOI] [PubMed] [Google Scholar]
- 20.Duché P, Ducher G, Lazzer S, Doré E, Tailhardat M, Bedu M. Peak power in obese and nonobese adolescents: effects of gender and braking force. Med Sci Sports Exerc 34: 2072–2078, 2002. doi: 10.1097/00005768-200212000-00031. [DOI] [PubMed] [Google Scholar]
- 21.Hulens M, Vansant G, Lysens R, Claessens AL, Muls E, Brumagne S. Study of differences in peripheral muscle strength of lean versus obese women: an allometric approach. Int J Obes 25: 676–681, 2001. doi: 10.1038/sj.ijo.0801560. [DOI] [PubMed] [Google Scholar]
- 22.Maffiuletti NA, Jubeau M, Munzinger U, Bizzini M, Agosti F, De Col A, Lafortuna CL, Sartorio A. Differences in quadriceps muscle strength and fatigue between lean and obese subjects. Eur J Appl Physiol 101: 51–59, 2007. doi: 10.1007/s00421-007-0471-2. [DOI] [PubMed] [Google Scholar]
- 23.Messa GAM, Piasecki M, Hurst J, Hill C, Tallis J, Degens H. The impact of a high-fat diet in mice is dependent on duration and age, and differs between muscles. J Exp Biol 223: jeb217117, 2020. doi: 10.1242/jeb.217117. [DOI] [PMC free article] [PubMed] [Google Scholar]
- 24.Montgomery MK, Hallahan NL, Brown SH, Liu M, Mitchell TW, Cooney GJ, Turner N. Mouse strain-dependent variation in obesity and glucose homeostasis in response to high-fat feeding. Diabetologia 56: 1129–1139, 2013. doi: 10.1007/s00125-013-2846-8. [DOI] [PubMed] [Google Scholar]
- 25.Wang CY, Liao JK. A mouse model of diet-induced obesity and insulin resistance. Methods Mol Biol 821: 421–433, 2012. doi: 10.1007/978-1-61779-430-8_27. [DOI] [PMC free article] [PubMed] [Google Scholar]
- 26.Dakin RS, Walker BR, Seckl JR, Hadoke PW, Drake AJ. Estrogens protect male mice from obesity complications and influence glucocorticoid metabolism. Int J Obes 39: 1539–1547, 2015. doi: 10.1038/ijo.2015.102. [DOI] [PMC free article] [PubMed] [Google Scholar]
- 27.Festuccia WT, Blanchard PG, Belchior T, Chimin P, Paschoal VA, Magdalon J, Hirabara SM, Simões D, St-Pierre P, Carpinelli A, Marette A, Deshaies Y. PPARγ activation attenuates glucose intolerance induced by mTOR inhibition with rapamycin in rats. Am J Physiol Endocrinol Metab 306: E1046–E1054, 2014. doi: 10.1152/ajpendo.00683.2013. [DOI] [PubMed] [Google Scholar]
- 28.Fuqua JD, Mere CP, Kronemberger A, Blomme J, Bae D, Turner KD, Harris MP, Scudese E, Edwards M, Ebert SM, de Sousa LGO, Bodine SC, Yang L, Adams CM, Lira VA. ULK2 is essential for degradation of ubiquitinated protein aggregates and homeostasis in skeletal muscle. FASEB J 33: 11735–11745, 2019. doi: 10.1096/fj.201900766R. [DOI] [PMC free article] [PubMed] [Google Scholar]
- 29.de Greef JC, Hamlyn R, Jensen BS, O'Campo Landa R, Levy JR, Kobuke K, Campbell KP. Collagen VI deficiency reduces muscle pathology, but does not improve muscle function, in the gamma-sarcoglycan-null mouse. Hum Mol Genet 25: 1357–1369, 2016. doi: 10.1093/hmg/ddw018. [DOI] [PMC free article] [PubMed] [Google Scholar]
- 30.Littlejohn NK, Keen HL, Weidemann BJ, Claflin KE, Tobin KV, Markan KR, Park S, Naber MC, Gourronc FA, Pearson NA, Liu X, Morgan DA, Klingelhutz AJ, Potthoff MJ, Rahmouni K, Sigmund CD, Grobe JL. Suppression of resting metabolism by the angiotensin AT2 Rreceptor. Cell Rep 16: 1548–1560, 2016. doi: 10.1016/j.celrep.2016.07.003. [DOI] [PMC free article] [PubMed] [Google Scholar]
- 31.Baehr LM, West DW, Marcotte G, Marshall AG, De Sousa LG, Baar K, Bodine SC. Age-related deficits in skeletal muscle recovery following disuse are associated with neuromuscular junction instability and ER stress, not impaired protein synthesis. Aging (Albany NY ) 8: 127–146, 2016. doi: 10.18632/aging.100879. [DOI] [PMC free article] [PubMed] [Google Scholar]
- 32.Wen Y, Murach KA, Vechetti IJ, Fry CS, Vickery C, Peterson CA, McCarthy JJ, Campbell KS. MyoVision: software for automated high-content analysis of skeletal muscle immunohistochemistry. J Appl Physiol (1985) 124: 40–51, 2018. doi: 10.1152/japplphysiol.00762.2017. [DOI] [PMC free article] [PubMed] [Google Scholar]
- 33.Mehlem A, Hagberg CE, Muhl L, Eriksson U, Falkevall A. Imaging of neutral lipids by oil red O for analyzing the metabolic status in health and disease. Nat Protoc 8: 1149–1154, 2013. doi: 10.1038/nprot.2013.055. [DOI] [PubMed] [Google Scholar]
- 34.Guillet C, Masgrau A, Walrand S, Boirie Y. Impaired protein metabolism: interlinks between obesity, insulin resistance and inflammation. Obes Rev 13: 51–57, 2012. doi: 10.1111/j.1467-789X.2012.01037.x. [DOI] [PubMed] [Google Scholar]
- 35.Fam TK, Klymchenko AS, Collot M. Recent advances in fluorescent probes for lipid droplets. Materials (Basel) 11: 1768, 2018. doi: 10.3390/ma11091768. [DOI] [PMC free article] [PubMed] [Google Scholar]
- 36.Duvigneaud N, Matton L, Wijndaele K, Deriemaeker P, Lefevre J, Philippaerts R, Thomis M, Delecluse C, Duquet W. Relationship of obesity with physical activity, aerobic fitness and muscle strength in Flemish adults. J Sports Med Phys Fitness 48: 201–210, 2008. [PubMed] [Google Scholar]
- 37.Falk B, Sadres E, Constantini N, Zigel L, Lidor R, Eliakim A. The association between adiposity and the response to resistance training among pre- and early-pubertal boys. J Pediatr Endocrinol Metab 15: 597–606, 2002. doi: 10.1515/jpem.2002.15.5.597. [DOI] [PubMed] [Google Scholar]
- 38.Fogelholm M, Malmberg J, Suni J, Santtila M, Kyröläinen H, Mäntysaari M. Waist circumference and BMI are independently associated with the variation of cardio-respiratory and neuromuscular fitness in young adult men. Int J Obes 30: 962–969, 2006. doi: 10.1038/sj.ijo.0803243. [DOI] [PubMed] [Google Scholar]
- 39.Abrigo J, Rivera JC, Aravena J, Cabrera D, Simon F, Ezquer F, Ezquer M, Cabello-Verrugio C. High fat diet-induced skeletal muscle wasting is decreased by mesenchymal stem cells administration: implications on oxidative stress, ubiquitin proteasome pathway activation, and myonuclear apoptosis. Oxid Med Cell Longev 2016: 9047821, 2016. doi: 10.1155/2016/9047821. [DOI] [PMC free article] [PubMed] [Google Scholar]
- 40.Tong T, Kim M, Park T. α-Ionone attenuates high-fat diet-induced skeletal muscle wasting in mice via activation of cAMP signaling. Food Funct 10: 1167–1178, 2019. doi: 10.1039/C8FO01992D. [DOI] [PubMed] [Google Scholar]
- 41.Zhang D, Lee JH, Kwak SE, Shin HE, Zhang Y, Moon HY, Shin DM, Seong JK, Tang L, Song W. Effect of a single bout of exercise on autophagy regulation in skeletal muscle of high-fat high-sucrose diet-fed mice. JOMES 28: 175–185, 2019. doi: 10.7570/jomes.2019.28.3.175. [DOI] [PMC free article] [PubMed] [Google Scholar]
- 42.Ciapaite J, van den Berg SA, Houten SM, Nicolay K, van Dijk KW, Jeneson JA. Fiber-type-specific sensitivities and phenotypic adaptations to dietary fat overload differentially impact fast- versus slow-twitch muscle contractile function in C57BL/6J mice. J Nutr Biochem 26: 155–164, 2015. doi: 10.1016/j.jnutbio.2014.09.014. [DOI] [PubMed] [Google Scholar]
- 43.Denies MS, Johnson J, Maliphol AB, Bruno M, Kim A, Rizvi A, Rustici K, Medler S. Diet-induced obesity alters skeletal muscle fiber types of male but not female mice. Physiol Rep 2: e00204, 2014. doi: 10.1002/phy2.204. [DOI] [PMC free article] [PubMed] [Google Scholar]
- 44.Frayn KN. Adipose tissue as a buffer for daily lipid flux. Diabetologia 45: 1201–1210, 2002. doi: 10.1007/s00125-002-0873-y. [DOI] [PubMed] [Google Scholar]
- 45.van Hees AM, Saris WH, Hul GB, Schaper NC, Timmerman BE, Lovegrove JA, Roche HM, Blaak EE, for the LIPGENE Consortium. Effects of dietary fat modification on skeletal muscle fatty acid handling in the metabolic syndrome. Int J Obes 34: 859–870, 2010. doi: 10.1038/ijo.2010.6. [DOI] [PubMed] [Google Scholar]
- 46.Pincu Y, Linden MA, Zou K, Baynard T, Boppart MD. The effects of high fat diet and moderate exercise on TGFβ1 and collagen deposition in mouse skeletal muscle. Cytokine 73: 23–29, 2015. doi: 10.1016/j.cyto.2015.01.013. [DOI] [PubMed] [Google Scholar]
- 47.Balchin D, Hayer-Hartl M, Hartl FU. In vivo aspects of protein folding and quality control. Science 353: aac4354, 2016. doi: 10.1126/science.aac4354. [DOI] [PubMed] [Google Scholar]
- 48.Gavriilidis C, Laredj L, Solinhac R, Messaddeq N, Viaud J, Laporte J, Sumara I, Hnia K. The MTM1-UBQLN2-HSP complex mediates degradation of misfolded intermediate filaments in skeletal muscle. Nat Cell Biol 20: 198–210, 2018. doi: 10.1038/s41556-017-0024-9. [DOI] [PubMed] [Google Scholar]
- 49.Kouw IWK, van Dijk JW, Horstman AMH, Kramer IF, Goessens JPB, van Dielen FMH, Verdijk LB, van Loon LJC. Basal and postprandial myofibrillar protein synthesis rates do not differ between lean and obese middle-aged men. J Nutr 149: 1533–1542, 2019. doi: 10.1093/jn/nxz104. [DOI] [PMC free article] [PubMed] [Google Scholar]
- 50.Tuttle LJ, Sinacore DR, Mueller MJ. Intermuscular adipose tissue is muscle specific and associated with poor functional performance. J Aging Res 2012: 1–7, 2012. doi: 10.1155/2012/172957. [DOI] [PMC free article] [PubMed] [Google Scholar]
- 51.Eshima H, Tamura Y, Kakehi S, Kurebayashi N, Murayama T, Nakamura K, Kakigi R, Okada T, Sakurai T, Kawamori R, Watada H. Long-term, but not short-term high-fat diet induces fiber composition changes and impaired contractile force in mouse fast-twitch skeletal muscle. Physiol Rep 5: e13250, 2017. doi: 10.14814/phy2.13250. [DOI] [PMC free article] [PubMed] [Google Scholar]
- 52.Shortreed KE, Krause MP, Huang JH, Dhanani D, Moradi J, Ceddia RB, Hawke TJ. Muscle-specific adaptations, impaired oxidative capacity and maintenance of contractile function characterize diet-induced obese mouse skeletal muscle. PLoS One 4: e7293, 2009. doi: 10.1371/journal.pone.0007293. [DOI] [PMC free article] [PubMed] [Google Scholar]
- 53.Abdelmoula A, Martin V, Bouchant A, Walrand S, Lavet C, Taillardat M, Maffiuletti NA, Boisseau N, Duché P, Ratel S. Knee extension strength in obese and nonobese male adolescents. Appl Physiol Nutr Metab 37: 269–275, 2012. doi: 10.1139/h2012-010. [DOI] [PubMed] [Google Scholar]
- 54.Garcia-Vicencio S, Coudeyre E, Kluka V, Cardenoux C, Jegu AG, Fourot AV, Ratel S, Martin V. The bigger, the stronger? Insights from muscle architecture and nervous haracteristics in obese adolescent girls. Int J Obes 40: 245–251, 2016. doi: 10.1038/ijo.2015.158. [DOI] [PubMed] [Google Scholar]
- 55.Lee S, Kim Y, White DA, Kuk JL, Arslanian S. Relationships between insulin sensitivity, skeletal muscle mass and muscle quality in obese adolescent boys. Eur J Clin Nutr 66: 1366–1368, 2012. doi: 10.1038/ejcn.2012.142. [DOI] [PMC free article] [PubMed] [Google Scholar]
- 56.Zoico E, Di Francesco V, Guralnik JM, Mazzali G, Bortolani A, Guariento S, Sergi G, Bosello O, Zamboni M. Physical disability and muscular strength in relation to obesity and different body composition indexes in a sample of healthy elderly women. Int J Obes 28: 234–241, 2004. doi: 10.1038/sj.ijo.0802552. [DOI] [PubMed] [Google Scholar]
- 57.Lee HY, Jeong KH, Choi CS, Consortium IMP, International Mouse Phenotyping Consortium. In-depth metabolic phenotyping of genetically engineered mouse models in obesity and diabetes. Mamm Genome 25: 508–521, 2014. doi: 10.1007/s00335-014-9520-4. [DOI] [PubMed] [Google Scholar]
- 58.Buettner R, Schölmerich J, Bollheimer LC. High-fat diets: modeling the metabolic disorders of human obesity in rodents. Obesity (Silver Spring) 15: 798–808, 2007. doi: 10.1038/oby.2007.608. [DOI] [PubMed] [Google Scholar]
- 59.Burchfield JG, Kebede MA, Meoli CC, Stöckli J, Whitworth PT, Wright AL, Hoffman NJ, Minard AY, Ma X, Krycer JR, Nelson ME, Tan SX, Yau B, Thomas KC, Wee NKY, Khor EC, Enriquez RF, Vissel B, Biden TJ, Baldock PA, Hoehn KL, Cantley J, Cooney GJ, James DE, Dj F. High dietary fat and sucrose results in an extensive and time-dependent deterioration in health of multiple physiological systems in mice. J Biol Chem 293: 5731–5745, 2018. doi: 10.1074/jbc.RA117.000808. [DOI] [PMC free article] [PubMed] [Google Scholar]
- 60.Adams JM, 2nd,Pratipanawatr T, Berria R, Wang E, DeFronzo RA, Sullards MC, Mandarino LJ. Ceramide content is increased in skeletal muscle from obese insulin-resistant humans. Diabetes 53: 25–31, 2004. doi: 10.2337/diabetes.53.1.25. [DOI] [PubMed] [Google Scholar]
- 61.Geiger AE, Daughtry MR, Yen CN, Kirkpatrick LT, Shi H, Gerrard DE. Dual effects of obesity on satellite cells and muscle regeneration. Physiol Rep 8: e14511, 2020. doi: 10.14814/phy2.14511. [DOI] [PMC free article] [PubMed] [Google Scholar]
- 62.Hu Z, Wang H, Lee IH, Modi S, Wang X, Du J, Mitch WE. PTEN inhibition improves muscle regeneration in mice fed a high-fat diet. Diabetes 59: 1312–1320, 2010. doi: 10.2337/db09-1155. [DOI] [PMC free article] [PubMed] [Google Scholar]