



Abstract
We examined whether sleep quality and quantity are associated with cortical and memory changes in cognitively healthy participants across the adult lifespan. Associations between self-reported sleep parameters (Pittsburgh Sleep Quality Index, PSQI) and longitudinal cortical change were tested using five samples from the Lifebrain consortium (n = 2205, 4363 MRIs, 18–92 years). In additional analyses, we tested coherence with cell-specific gene expression maps from the Allen Human Brain Atlas, and relations to changes in memory performance. “PSQI # 1 Subjective sleep quality” and “PSQI #5 Sleep disturbances” were related to thinning of the right lateral temporal cortex, with lower quality and more disturbances being associated with faster thinning. The association with “PSQI #5 Sleep disturbances” emerged after 60 years, especially in regions with high expression of genes related to oligodendrocytes and S1 pyramidal neurons. None of the sleep scales were related to a longitudinal change in episodic memory function, suggesting that sleep-related cortical changes were independent of cognitive decline. The relationship to cortical brain change suggests that self-reported sleep parameters are relevant in lifespan studies, but small effect sizes indicate that self-reported sleep is not a good biomarker of general cortical degeneration in healthy older adults.
Keywords: aging, atrophy, cortex, sleep
Introduction
Older adults with poor sleep are more likely to develop neurodegenerative disease (Prinz et al. 1982; Hatfield et al. 2004; Videnovic et al. 2014; Mander et al. 2016; Shi et al. 2018; Fan et al. 2019; Irwin and Vitiello 2019; Xu et al. 2020), and in a recent meta-analysis, it was argued that 15% of Alzheimer’s Disease (AD) diagnoses in the population may be attributed to aspects of sleep (Bubu et al. 2017). It is, however, not known whether the relationship between sleep and neurodegeneration is causal, and little is known about the mechanisms that could mediate such a connection. For instance, the association might be bidirectional or reflect the operation of mechanisms (e.g., Raz and Daugherty 2018) affecting both sleep and brain change in normal and pathological aging. Also, older adults without dementia show differences in sleep patterns compared to younger adults (Ohayon et al. 2004; Scullin and Bliwise 2015; Mander et al. 2017), so it is important to know whether natural variations in sleep quality and quantity are related to brain changes across adult life. Here, we examine the relationship between multiple self-reported sleep variables, including sleep disturbances and sleep duration, and cortical changes across the adult lifespan. Participants from the Lifebrain consortium assessed repeatedly (up to 7 assessments over 11 years) with MRIs were studied (Fjell et al. 2018a). In additional analyses, we tested coherence with cell-specific gene expression maps from the Allen Human Brain Atlas (AHBA), and with changes in memory performance.
Several studies have reported cross-sectional relationships between self-reported sleep parameters and structural properties of the cerebral cortex. Poor sleep tends to be associated with thinner cortex or smaller cortical volume (Table 1), but there is little agreement about which self-reported sleep measures and cortical regions thar are involved. The largest study to date found daytime sleepiness to be associated with thinner cortices in all lobes (Carvalho et al. 2017) but did not report results for other sleep variables. Three studies tested associations with longitudinal cortical change. In one, lower global sleep quality was related to greater cortical volume reduction in frontal, temporal, and parietal regions (Sexton et al. 2014) in participants above 60 years of age. Sleep duration was not associated with atrophy, in accordance with a recent study where duration measured five times over 28 years (Zitser et al. 2020) in 613 participants did not relate to global or regional gray matter volume measured at follow-up. In contrast, a second study found that sleep duration of more or fewer than 7 h was associated with frontotemporal cortical thinning (Spira et al. 2016). A third study of middle-aged and older adults reported shorter sleep duration to be related to more ventricular expansion, whereas no relationship was observed between a global sleep score and volumetric change in total cerebral, inferior or superior frontal volume (Lo et al. 2014). Thus, poor self-reported sleep tends to be modestly related to unfavorable cortical changes, but with little consistency across studies with regard to sleep parameters and brain regions.
Table 1.
Overview of representative studies testing self-reported sleep, sleep disturbances, and cortical volume or thickness
| Reference | N | Population | Result | Comment |
|---|---|---|---|---|
| Patients with sleep disorders (patients/controls) | ||||
| Altena et al. (2010) | 24/13 | Chronic insomnia | + | Patients had a smaller volume of the left orbitofrontal cortex and in the anterior and posterior precuneus. VBM using SPM |
| Joo et al. (2013) | 27/27 | Chronic primary insomnia | − | Tendencies for reduced GM volume in patients, but no effects survived corrections. VBM using SPM8 |
| Suh et al. (2016) | 57/40 | Persistent insomnia symptoms | + | Thinner cortex in anterior cingulate, precentral, and lateral prefrontal cortex in patients. Vertex-wise analyses using CIVET. PSQI for sleep |
| Spiegelhalder et al. (2013) | 28/38 | Primary insomnia | − | No significant relationships. ROI analyses using FreeSurfer (thickness and volume), and VBM using SPM8 |
| Winkelman et al. (2013) | 20/15 and 21/20 | Chronic primary insomnia | − | Larger normalized rostral anterior cingulate volume in patients in both sub-studies. Analyses using FreeSurfer |
| Morrell et al. (2003) | 7/7 | Obstructive sleep apnea | − | No differences outside hippocampus. VBM using SPM |
| Riemann et al. (2007) | 8/8 | Chronic insomnia | − | No differences outside hippocampus. Analyses of manual ROIs |
| Moon et al. (2018) | 37 | Heart failure | − | No relationship between PSQI global score and brain volume. VBM using SPM. |
| Normal controls | ||||
| Cross-sectional | ||||
| Alperin et al. (2019) | 69 | Older | + | Smaller left superior parietal lobule volume and thinner right frontal pole, superior frontal, and lateral orbitofrontal cortex in poor sleepers as measured by PSQI global score. Lower sleep duration was most highly correlated with cortical volume and thickness reductions among all subjects. ROI analyses using FreeSurfer (thickness and volume) |
| Branger et al. (2016) | 51 | Older | + | Number of nocturnal awakenings was negatively correlated with volume in the bilateral insula and inferior frontal gyri. VBM using SPM8. Custom made self-reported sleep instrument based on PSQI (sleep latency, duration, quality, and number of nocturnal awakenings) |
| Del Brutto et al. (2016) | 290 | Older (≥60 years) | + | PSQI global score was related to globally wider sulci based on qualitative ratings, especially in participants >67 years |
| Carvalho et al. (2017) | 1374 | Middle-aged/ older (>50 years) | + | Daytime sleepiness was associated with thinner cortex in the four lobes. Epworth Sleepiness Scale used for sleep. ROI analyses using FreeSurfer (four lobar ROIs) |
| Grau-Rivera et al. (2020) | 366 | Middle-aged/ older | + | Insomnia is associated with lower volume (left orbitofrontal, right middle temporal, bilateral precuneus, posterior cingulate), but did not survive FWE multiple comparison correction. World Health Organization Composite International Diagnostic Interview used for sleep. VBM using SPM12 |
| Helfrich et al. (2018) | 52 | Young and old | + | GM volume in mPFC positively correlated with directional slow oscillation-spindle coupling. VBM using SPM8 |
| Lim et al. (2016) | 141 | Older (mean age 82.9 years) | + | Sleep fragmentation is related to lower total cortical GM volume, and volume in lateral orbitofrontal and inferior frontal gyri pars orbitalis. Actigraphy. Analyses using FreeSurfer |
| Reinhard et al. (2014) | 38 | Unknown age | + | Positive association between EEG beta2 power and left caudal anterior cingulate cortex thickness. ROI analyses using FreeSurfer (thickness and volume) |
| Stoffers et al. (2012) | 65 | Adults (18–56) | + | Early morning awakenings were negatively related to orbitofrontal volume, but not relationships for initiating or maintain sleep. VBM using SPM. WHIIRS and MCTQ for sleep |
| Zitser et al. (2020) | 613 | Adults (mean age 42.3 years) | − | No relationship between global GM volume and sleep duration measured over several years. Voxel-based analyses using FSL |
| Taki et al. (2012) | 290 | Children/adolescents | − | No relationship between sleep duration and GM outside the hippocampus. VBM DARTEL for volume analyses |
| Aribisala et al. (2020) | 457 | Older (LBC) | ± | Weekend daytime sleep associated with reduced total brain volume, but no relationship to night-time sleep duration or daytime sleeping during weekdays |
| Longitudinal | ||||
| Sexton et al. (2014) | 147 | Adult lifespan, 3.5 years interval | + | PSQI global score is related to more volume reduction in widespread frontal, temporal, and parietal regions. Relationships were largely driven by older (>60 years) participants, and were stronger in longitudinal than cross-sectional analyses. Of PSQI sub-scores, efficiency and latency showed significant associations in post hoc analyses, while duration did not. Vertex-wise analyses using FreeSurfer |
| Lo et al. (2014) | 119 | Middle-aged/older (>55 years), longitudinal | − | No relationship with volumetric change in total cerebral, inferior, or superior frontal volume. Vertex-wise analyses using FreeSurfer. PSQI (duration and Global score) for sleep |
| Spira et al. (2016) | 122 | Older (56–86 years), 8 years interval | ± | Sleep durations of <7 h and >7 h associated with more frontotemporal gray matter loss. Vertex-wise analyses using FreeSurfer |
Note: Main result: “- “indicates no relationship between cortical volume/ thickness and sleep or an inverse relationship (e.g., higher volume in patients). “+” indicates the expected relationship between cortical volume/ thickness and sleep, for example, smaller volume in patients or a negative correlation between sleep problems and volume. Only results of cortical analyses are included in the table. ROI: Region of interest. SPM: Statistical Parametric Mapping (https://www.fil.ion.ucl.ac.uk/spm/). FSL: FMRIB Software Library (https://fsl.fmrib.ox.ac.uk/fsl/fslwiki/FSL). GM: Gray matter. WHIIRS: Women’s Health Initiative Insomnia Rating. MCTQ: Munich Chronotype Questionnaire. VBM: Voxel-based morphometry. DARTEL: Diffeomorphic Anatomical Registration using Exponentiated Lie Algebra.
Here we took advantage of five longitudinal MRI studies from the Lifebrain consortium (Fjell et al. 2018a) to examine which self-reported sleep parameters were related to cortical changes and whether these associations were stable through adult life or increased in strength with age. We hypothesized stronger relationships between sleep and cortical changes in older compared to younger adults, mainly in frontal and temporal cortices. These hypotheses were speculative due to few longitudinal studies and highly divergent findings in previous publications. In additional analyses, we tested whether sleep and cortical thinning were preferentially associated in regions characterized by high rates of natural age changes, and whether such relationships were stronger in cortical regions characterized by higher expression of genes related to specific cell types—so-called “virtual histology” (Shin et al. 2018). Guided by results from animal experiments, overlap with regions of high expression of microglia, astrocytes, and oligodendrocyte genes could be expected. We also examined whether there was a relationship with memory decline. Longitudinal sleep observations were available only for a smaller subset of the data, and we were, therefore, not able to test change–change relationships directly. Note that sleep was measured based on self-reports, which is not always aligned with physiological recordings of sleep.
Materials and Methods
Sample
The sample was derived from the European Lifebrain project (http://www.lifebrain.uio.no/) (Fjell et al. 2018a), including participants from the Berlin Aging Study II (BASE-II) (Bertram et al. 2014; Gerstorf et al. 2016), the BETULA project (Nilsson et al. 1997), the Cambridge Centre for Ageing and Neuroscience study (Cam-CAN) (Shafto et al. 2014), the Center for Lifespan Changes in Brain and Cognition longitudinal studies (LCBC) (Walhovd et al. 2016; Fjell et al. 2018b), and the University of Barcelona brain studies (Vidal-Pineiro et al. 2014; Rajaram et al. 2016; Abellaneda-Perez et al. 2019). Self-reported sleep and structural MRIs from 2205 participants (18.5–91.9 years) yielding a total of 4363 observations were included (Table 2). Screening criteria were not identical across studies but participants were in general cognitively healthy and did not suffer from neurological conditions known to affect brain function, such as mild cognitive impairment/dementia, major stroke, and multiple sclerosis (Fjell et al. 2019b, and Supplementary Material). Depression symptoms were mapped using the Beck Depression Inventory (Beck and Steer 1984) (LCBC, except MADRS for n = 91), the Geriatric Depression Scale (Yesavage et al. 1982) 15 item version (BASE-II), the Center for Epidemiologic Studies Depression Scale (Radloff 1977) (Betula), and the Hospital Anxiety and Depression Scale (Zigmond and Snaith 1983) (Cam-CAN).
Table 2.
Descriptive variables of the Lifebrain samples providing data on self-reported sleep
| Study | Unique participants | Observations | Mean follow-up length in years(SD) | Range of max follow-up length | Age range at baseline | Sex (female/male) |
|---|---|---|---|---|---|---|
| Barcelona | 39 | 114 | 4.2 (0.5) | 1.9–4.9 | 64.5–80.6 | 27/12 |
| BASE-II | 315 | 627 | 1.9 (0.7) | 0.6–3.1 | 24.2–83.2 | 112/203 |
| Betula | 266 | 385 | 4.0 (0.3) | 3–5 | 25–85 | 135/131 |
| CamCAN | 639 | 901 | 1.4 (0.7) | 0.3–3.5 | 18.5–91.7 | 327/312 |
| LCBC | 946 | 2336 | 4.6 (2.7) | 0.2–11.0 | 19.5–91.9 | 635/311 |
| Total | 2205 | 4363 | 3.2 (2.3) | 0.2–11.0 | 18.5–91.9 | 1236/969 |
Note: Follow-up time is between MRIs.
Associations between sleep parameters and longitudinal memory change were tested in 1419 participants (2702 observations; Betula [n = 138/276 observations, baseline-age = 65, 55–85 years], LCBC [n = 730/1480 observations, baseline-age = 49, 19–89 years], BASE-II [n = 512/830 observations, baseline-age = 62, 24–92 years], Barcelona [n = 39/116 observations, baseline-age = 69, 64–81 years]), by 30 min delayed free recall from the Verbal Learning and Memory Test (BASE-II), 30 min free recall from the California Verbal Learning Test (LCBC) (Delis et al. 1988), word recall (immediate free recall of words and sentences, and delayed cued recall of words from the previously learned sentences, Betula) (Nilsson et al. 1997; Pudas and Ronnlund 2019) and 30 min delayed recall from the Rey Auditory Verbal Learning Test (Ryan and Geisser 1986) (Barcelona).
Self-Reported Sleep Assessment
Sleep was assessed using the Pittsburgh Sleep Quality Index (PSQI) (Buysse et al. 1989) representing self-reported sleep quality for the previous month. This assessed 7 domains (sleep quality, latency, duration, efficiency, disturbances, medication, and daytime tiredness) each scored from 0 to 3 and a global score (see Table 3 for an overview). High scores indicate worse sleep. Duration was also tested using the number of hours instead of the 0–3 scale. The sleep medication item was not analyzed, as most samples were screened for use of medications. The Karolinska Sleep Questionnaire (Nordin et al. 2013; Westerlund et al. 2014) was used for Betula and converted to PSQI (Supplementary Material, Fjell et al. 2019b). Although lifespan changes in sleep are pronounced (Gadie et al. 2017; Fjell et al. 2019b), mean changes as well as individual differences in change over a few years are rather small (Pillai et al. 2015; Zitser et al. 2020) and considered negligible here. PSQI was administered at baseline concurrently with the first MRI, or at a time between the first and the last MRI. If multiple observations were available, the mean value was used. Multiple administrations of the sleep inventory were only available for a small subsample of the participants only, and from only two sub-studies. Specifically, 94 LCBC participants had 2 and 19 had 3 sleep observations, and 119 Betula participants had 2. Mean interval between these PSQI time points was 3.54 years (SD 1.11 years). We calculated the intraclass correlation for PSQI global, which was 0.556, with sub-scales ranging from 0.25 (PSQI #7 Daytime dysfunction) to 0.49 (PSQI #2 Latency).
Table 3.
PSQI sub-scales
| Number | Name | Description |
|---|---|---|
| 1 | Subjective sleep quality | From «very good» (0) to «very bad» (3) |
| 2 | Sleep latency | Time taken to fall asleep (≤15 min [0] to > 60 min [3]) and how often you cannot get to sleep within 30 min |
| 3 | Sleep duration | From « > 7 h» (0) to « < 5 h» (3) |
| 4 | Habitual sleep efficiency | (Hours slept/Hours spent in bed) × 100 (> 85% [0] to < 65% [3]) |
| 5 | Sleep disturbances | Extent of nightly awakenings, need to use bathroom, uncomfortable breathing, snoring/coughing, feeling cold/hot, bad dreams, pain, other disturbances |
| 6 | Use of sleeping medication | Was not analyzed due to variance-reducing screening criteria |
| 7 | Daytime dysfunction | Trouble straying awake during driving/eating/social activities (never [0] to ≥3 times each week [3]) |
| Global | Sum of component 1–7 (total score 0–21) |
Magnetic Resonance Imaging (MRI) Acquisition and Analysis
MRI data originated from 8 different scanners (Table 4) and were processed with FreeSurfer v6.0 (https://surfer.nmr.mgh.harvard.edu/) (Dale et al. 1999; Fischl et al. 2002; Reuter et al. 2012; Jovicich et al. 2013), yielding maps of cortical thickness and volume. To avoid introducing possible site-specific biases, quality control measures were imposed and no manual editing was done. We previously have reported that across-scanner consistencies in estimated hippocampal volumes for the scanners used in Lifebrain are high. We nevertheless included “study site” as a fixed effect covariate to adjust for scanner differences (Fjell et al. 2019b). Additional post hoc analyses of Site × sleep × time were also run to test whether Site (Scanner) affected the relationship between sleep and cortical change.
Table 4.
MR acquisition parameters
| Sample | Scanner | Tesla | Sequence parameters |
|---|---|---|---|
| Barcelona | Tim Trio Siemens | 3.0 | TR: 2300 ms, TE: 2.98, TI: 900 ms, slice thickness 1 mm, flip angle: 9°, FoV 256 × 256 mm, 240 slices |
| BASE-II | Tim Trio Siemens | 3.0 | TR: 2500 ms, TE: 4.77 ms, TI: 1100 ms, flip angle: 7°, slice thickness: 1.0 mm, FoV 256 × 256 mm, 176 slices |
| Betula | Discovery GE | 3.0 | TR: 8.19 ms, TE: 3.2 ms, TI: 450 ms, flip angle: 12°, slice thickness: 1 mm, FOV 250 × 250 mm, 180 slices |
| Cam-CAN | Tim Trio Siemens | 3.0 | TR: 2250 ms, TE: 2.98 ms, TI: 900 ms, flip angle: 9°, slice thickness 1 mm, FOV 256 × 240 mm, 192 slices |
| LCBC | Avanto Siemens | 1.5 | TR: 2400 ms, TE: 3.61 ms, TI: 1000 ms, flip angle: 8°, slice thickness: 1.2 mm, FoV: 240 × 240 m, 160 slices, iPat = 2 |
| Avanto Siemens | 1.5 | TR: 2400 ms, TE = 3.79 ms, TI = 1000 ms, flip angle = 8, slice thickness: 1.2 mm, FoV: 240 x 240 mm, 160 slices | |
| Skyra Siemens | 3.0 | TR: 2300 ms, TE: 2.98 ms, TI: 850 ms, flip angle: 8°, slice thickness: 1 mm, FoV: 256 × 256 mm, 176 slices | |
| Prisma Siemens | 3.0 | TR: 2400 ms, TE: 2.22 ms, TI: 1000 ms, flip angle: 8°, slice thickness: 0.8 mm, FoV: 240 × 256 mm, 208 slices, iPat = 2 |
Note: TR = repetition time; TE = echo time; TI = inversion time; FoV = field of view; iPat = in-plane acceleration.
Virtual Histology Analyses—Relationship With Cell-Specific Gene Expression Profiles
We tested how sleep-associated cortical thinning is related to regional gene expression profiles associated with specific cell types. As described in detail elsewhere (French and Paus 2015; Shin et al. 2018), gene expression data in ex-vivo left hemisphere brains were obtained from the AHBA (http://www.brain-map.org;Hawrylycz et al. 2012), mapped to 34 cortical regions of the Desikan-Killiany Atlas (Desikan et al. 2006). Genes were required to be regionally consistent across 6 donors and 2 datasets (AHBA, the BrainSpan Atlas) (Supplementary Material and French and Paus 2015). The resulting 2511 genes with consistent expression profiles were combined with a list of cell-specific genes from Zeisel et al. (2015), yielding the following cell-type panels: S1 pyramidal neurons (n = 73), CA1 pyramidal neurons (n = 103), interneurons (n = 100), astrocytes (n = 54), microglia (n = 48), oligodendrocytes (n = 60), ependymal (n = 84), endothelial (n = 57), and mural (n = 25).
Statistical Analyses
See Supplementary Material for details.
Cortical Surface Analyses
Spatiotemporal linear mixed models (Bernal-Rusiel et al. 2013a; Bernal-Rusiel et al. 2013b) implemented in FreeSurfer v6.0.1 and running on MATLAB R2017a were used to test relationships between sleep variables and cortical thickness/volume change, accounting for the spatial correlation between residuals at neighboring vertices and the temporal correlation of residuals within repeated measurements of single participants. Surface results were tested against an empirical null distribution of maximum cluster size across 10 000 iterations using Z Monte Carlo simulations, yielding results corrected for multiple comparisons across space (P < 0.05) (Hagler et al. 2006). Baseline-age, time since baseline, site, and sex were included as covariates. Separate analyses included all two- and three-way interactions between PSQI, age, and time. The hierarchical nature of the data (repeated measurements nested within participants) was accounted for using a random intercept term. Additional analyses were conducted, using a dichotomous indicator variable for age (≥ vs. < 60 years), creating a piecewise linear model for cortical thinning with a cut-point at 60 years. All follow-up analyses were run in R (R Core Team 2019). To assess relationships between PSQI and memory change, we ran generalized additive mixed models (Wood 2017) (GAMM) with a random intercept and random effects per study for time and sleep using the package “mgcv” using smooth terms for baseline-age. Additional models were run with PSQI × time × baseline-age and age × sleep.
Virtual Histology
Pearson correlations were computed between the thinning coefficients and the median interregional profile of gene expression levels for each marker gene. Using a resampling-based approach (Shin et al. 2018), the average expression—thinning correlation for each group of cell-specific genes served as the test statistic. False discovery rate was used to account for 9 cell-types.
Results
Self-Reported Sleep is Associated With Accelerated Cortical Thinning
Associations of PSQI scales and cortical atrophy are shown in Figure 1 and Table 5. PSQI #1 Subjective sleep quality was related to cortical thinning in the right middle temporal gyrus, extending posteriorly, so that lower quality was associated with faster thinning. A similar relationship for PSQI # 5 Sleep disturbances was found in an overlapping region, bordering angular gyrus, with more disturbances being associated with faster thinning. For this subscale, extensive age-interactions were found (Fig. 2), with three large lateral clusters in the right hemisphere, located in the temporal, inferior parietal, and inferior/middle prefrontal cortex, and one cluster in the left (lateral, inferior, and medial temporal cortex). More sleep disturbances were related to accelerated cortical thinning from about 60 years of age (see below). For the remaining PSQI components and the global score, no effects were found. No relationships with cortical volume change were seen. Follow-up analyses were performed to test whether sleep duration showed a quadratic relationship with atrophy. Here, duration was measured in the number of hours instead of using the PSQI #3 Sleep duration 0–3-point scale. There were no significant quadratic relationships or age-interactions for the number of hours slept.
Figure 1.
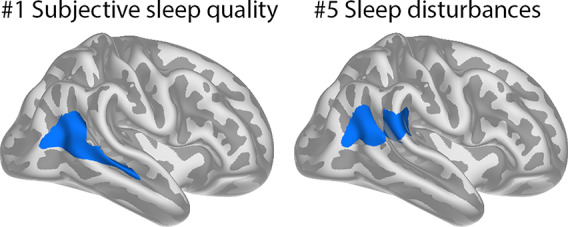
Effects of sleep on cortical thinning Clusters where PSQI #1 Subjective sleep quality and PSQI #5 Sleep disturbances were related to cortical thinning after corrections for multiple comparisons across space.
Table 5.
Cluster statistics
| PSQI subscale | Hemisphere | Cluster number | Size (mm2) | Cluster P | Peak effect location |
|---|---|---|---|---|---|
| PSQI #1 | Right | 1 | 2258 | 0.004 | Inferior parietal |
| PSQI #5 | Right | 1 | 2248 | 0.004 | Inferior parietal |
| PSQI #5 × age | Right | 1 | 2810 | 0.0007 | Middle temporal |
| Right | 2 | 2801 | 0.0007 | Middle temporal | |
| Right | 3 | 2347 | 0.003 | Precentral | |
| Left | 1 | 5329 | 0.0001 | Inferior temporal |
Note: PSQI #1 = subjective sleep quality; PSQI #5 = sleep disturbances.
Figure 2.
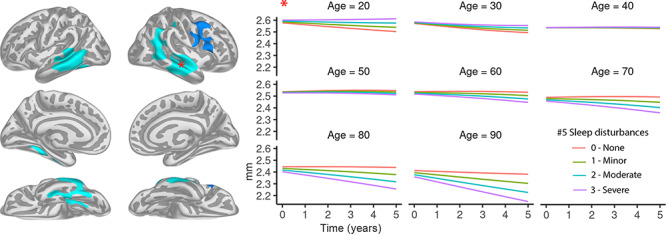
Age-interactions; left panels: clusters where PSQI #5 Sleep disturbances are significantly more strongly related to cortical thinning in older than younger adults. Average cortical thickness in the cluster in the right middle temporal gyrus—marked by the red asterisk—was extracted and used to illustrate the age-interactions in the right panels. Right panels: model predicted cortical thickness in the right middle temporal cluster in the left panel as a function of age, time, and amount of sleep disturbances (0: none, 3: severe). Participants reporting more sleep disturbances show more cortical thinning in the older age ranges but not in the younger. CIs around the curves were removed for improved viewing and are presented in the Supplementary Material, along with similar curves for the other three significant clusters. These plots are used for illustrating the effects in the surface analyses. Statistical analyses were conducted using age as a continuous variable.
As can be seen in Figure 2, the association between “PSQI #5 Sleep disturbances” and cortical thinning emerged from around 60 years of age. To assess the size of this age interaction, we calculated mean cortical thinning (Δthickness mm/year) as a function of the amount of sleep disturbances in 60 years old and 80 years old (Fig. 3). For participants with minor sleep disturbances (“PSQI #5 Sleep disturbances” = 0), annual cortical thinning was low and close to identical for 60 years old and 80 years old; ≈0.05 mm/year or − 0.20%. In contrast, for participants with severe sleep disturbances (PSQI #5 Sleep disturbances = 3), annual cortical thinning was almost twice as large in the oldest group, equal to −1.03% (0.027 mm/year) compared to −0.55% (0.014 mm/year), respectively.
Figure 3.
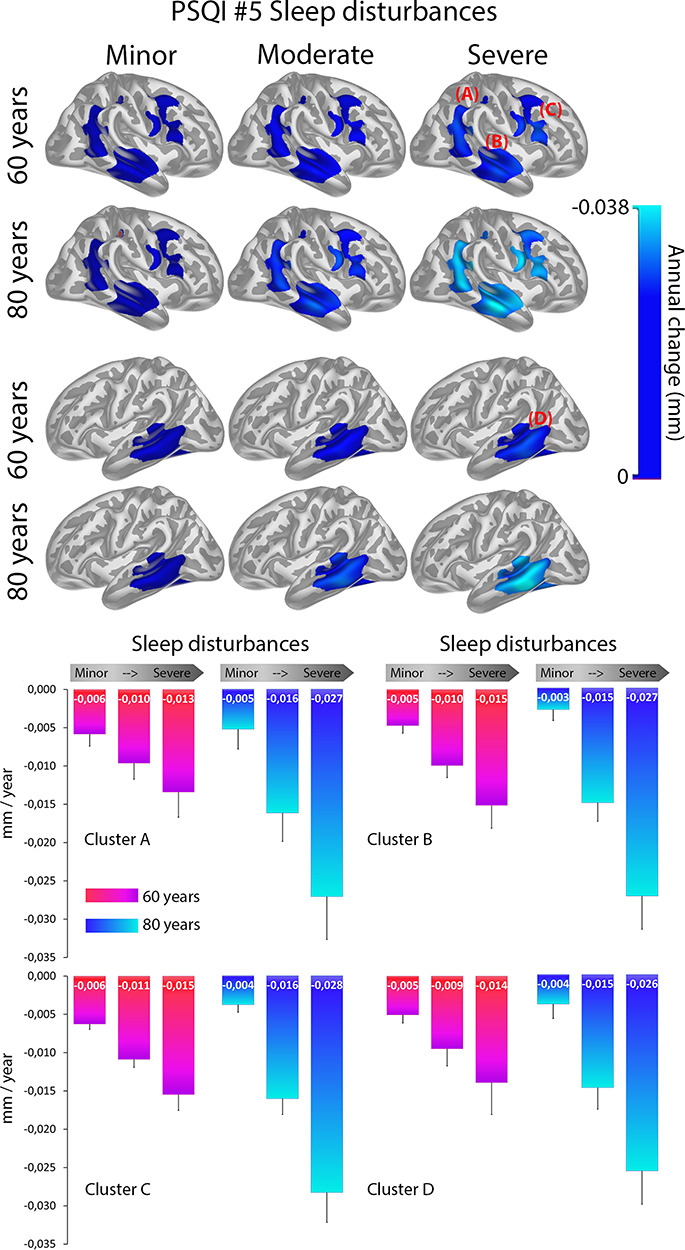
Cortical thinning as a function of sleep disturbances and age; top panel: mean cortical thinning (mm/year) in the clusters with a significant effect of age × sleep on thickness change broken up by score on PSQI #5 Sleep disturbances and age group. Bottom panel: mean cortical thinning in the same regions as a function of score on PSQI #5 Sleep disturbances and age group. Error bars denote 1 SD.
To assess the regional specificity of the effects in Figures 1 and 2, p-maps thresholded at P < 0.05 not corrected for multiple comparisons were inspected (see Supplementary Material for full results). These revealed that the apparent hemispheric differences seen in the corrected maps were exaggerated by the applied correction procedure. The uncorrected maps showed bilateral and in general less localized effects, affecting all four lobes. Thus, the results should not be interpreted as showing anatomically specific sleep–atrophy relationships.
PSQI #5 SLEEP Disturbances-Related Cortical Thinning is not Stronger in Regions Showing the Most Atrophy
To test whether the age-interactions for “PSQI #5 Sleep disturbances” were strongest in regions showing the most atrophy in aging, we calculated the vertex-wise spatial correlations between the age × “PSQI #5 Sleep disturbances” interaction coefficients and cortical thinning in participants above 60 years. The correlations were 0.04 for the left and −0.003 for the right hemisphere. These very low correlations suggest that “PSQI #5 Sleep disturbances” are not more related to cortical thinning with higher age in the regions undergoing the most thinning per se, although bootstrapping showed that the left hemisphere relationship was significantly greater than expected by chance (P < 0.001).
Sleep-Related Thinning and Expression of Oligodendrocytes and S1 Pyramidal Cell Genes
Virtual histology was used to test whether the age-dependent associations between “PSQI #5 Sleep disturbances” and cortical thinning were related to interregional gene expression profiles associated with specific cell types (Table 6, Fig. 4). The results showed overlap with regions with higher expression of genes related to oligodendrocytes and S1 pyramidal cells (Pfdr < 0.05). Note that these analyses were performed vertex-wise, and were not restricted to regions with significant sleep × time × age-interactions.
Figure 4.
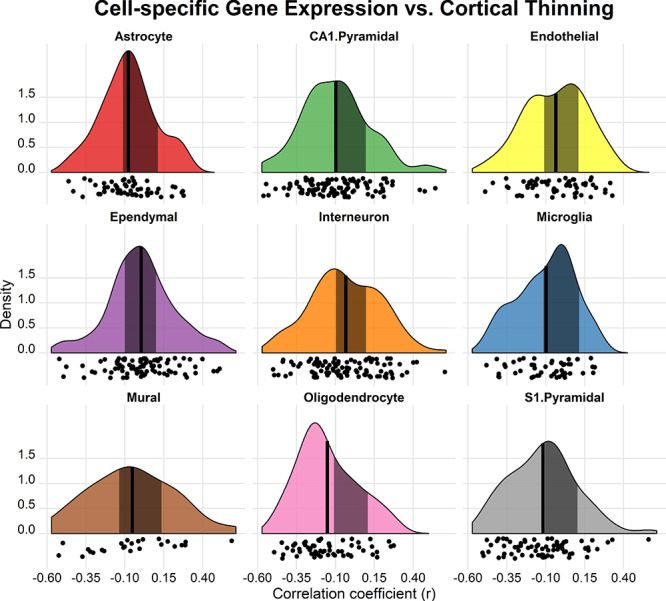
Virtual histology; significantly higher expression of genes characteristic of specific cell types (oligodendrocytes and S1 pyramidal) in vertices where the age-related association between PSQI #5 Sleep disturbances and cortical thinning are the strongest (vertex-wise thickness effects from the age × time × sleep interaction; see surface plots in Figure 2). The black vertical lines represent the mean association, and the shaded area represents the empirical null distribution for each of the 9 cell types. The x-axes indicate the coefficients of correlation between the thinning and the gene expression profiles. The y-axes indicate the estimated probability density for the correlation coefficients. Panels, where the mean of the target ROIs is outside the null distribution 95% CI, are considered to show a correlation greater or smaller than predicted. See Allen et al. (2019) for the creation of raincloud plots.
No Relationship With Memory Change
GAMMs were performed with memory score as the outcome, PSQI × time as the main term of interest, with sex and baseline-age as covariates. No significant relationships were found (all P’s ≥ 0.22). Effect estimates are presented in the Supplementary Material, showing that the largest effect was found for PSQI #4 Habitual sleep efficiency, for which the efficiency (scale 0–3) × time (in years) interaction on change in memory scores (SD) was −0.022, that is, high sleep efficiency (PSQI #4 score “0”) was associated with 0.33 SD less decline in memory score over a 5-year interval compared to low efficiency (PSQI #4 score “3”). We tested the three-way interaction PSQI × time × baseline-age, with no significant effects (all P’s ≥ 0.58). Finally, we ran models with the smooth interaction between age at testing and PSQI. Here the longitudinal and cross-sectional information is combined in the test age variable, and because chronological age has much more variance than ages at repeated measures, this analysis is skewed toward cross-sectional effects. Here, age × ”PSQI #5 Sleep disturbances” showed a weak but significant relationship with memory change (P = 0.039, uncorrected). None of the other PSQI components showed this, with “PSQI #3 Sleep duration” (P = 0.086) and “PSQI #4 Habitual sleep efficiency” (P = 0.099) scales yielding the lowest P-values, and “PSQI global score” the highest (P = 0.96).
Post Hoc Analyses: Controlling for body mass index and Depression
We performed post hoc analyses testing whether body mass index (BMI) or preclinical depression affected the observed “PSQI 5 Sleep disturbances”—cortical change relationship (see Supplementary Material for details). BMI was available at the time of analysis from the LCBC, CamCAN, and Betula datasets (n = 1717), and depression scores from the LCBC, CamCAN, Betula, and BASE-II datasets (n = 1637). As seen in Figures 5 and 6, controlling for BMI or depression symptoms did not affect the relationship between “PSQI #5 Sleep disturbances” and cortical change, except for some offset effects for BMI in the 50ties and 60ties, not affecting the actual slope.
Figure 5.
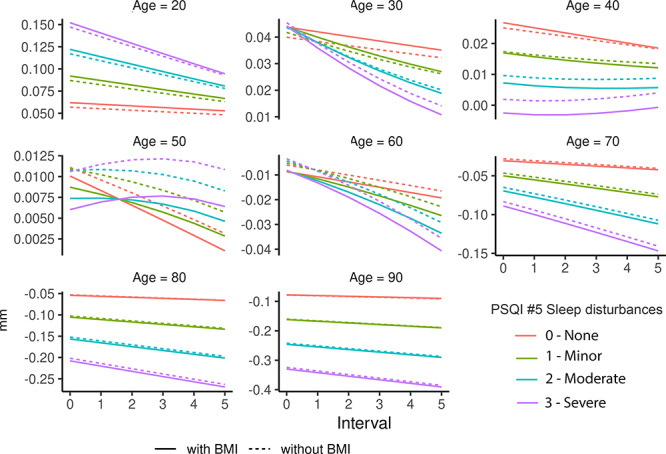
Controlling for BMI; BMI did not affect the relationship between PSQI #5 Sleep disturbances and cortical thinning across age, as can be seen from the overlapping solid and dotted lines. Plotted effects are from Cluster B (Figure 3); see Supplementary Material for additional clusters. Note that the y-axes are fitted to each plot to facilitate the detection of possible differences between curves visually, and therefore vary between plots.
Figure 6.
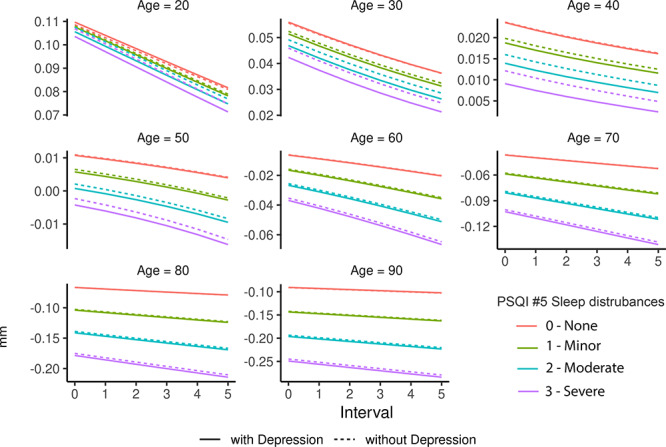
Controlling for depression; depressive symptoms did not affect the relationship between PSQI #5 Sleep disturbances and cortical thinning across age, as can be seen from the overlapping solid and dotted lines. Plotted effects are from Cluster B (Figure 3); see Supplementary Material for additional clusters. Note that the y-axes are fitted to each plot to facilitate the detection of possible differences between curves visually, and therefore vary between plots.
Post Hoc Analyses: Site Differences
Differences in MR scanners and sequences are expected to affect cortical thickness estimates. Here site was included as a covariate in all analyses, which controls for main effects of scanner/sequence (“Site”) on cortical thickness. As an additional test, for each of the identified clusters listen in Table 5, we reran the models, including a Site × Sleep × Time interaction as an additional term to directly test whether the sleep—thickness change relationship differed between sites. Only for “PSQI #5 Sleep disturbances” × Cluster 4 (left lateral temporal cortex) was the interaction significant. The estimated effect of sleep on cortical thinning had the same sign as the reported and was still significant. Thus, we cannot exclude the possibility that the relationship between sleep and thickness change is stronger for some sites than others for this specific effect, although the nature of the relationship did not change when controlling for site × sleep × time. For all other models, the site × sleep × time interaction was not significant.
Discussion
Lower self-reported sleep quality and more sleep disturbances were associated with more regional cortical thinning, independently of depressive symptoms and BMI, after the age of 60 years. These relationships were stronger in regions with higher expression of genes related to oligodendrocytes and S1 pyramidal cells. It should be noted that effect sizes were modest, there were no significant associations with PSQI Global sleep score or sleep duration measured in hours or by “PSQI #3 Sleep duration,” and there was no significant association with memory change.
Sleep Disturbances and Cortical Thinning
Lower sleep quality and more sleep disturbances were related to cortical thinning in the right middle temporal gyrus, extending posteriorly. “PSQI #1 Subjective sleep quality” is based on the participants’ overall evaluation of their sleep, whereas “PSQI #5 Sleep disturbances” includes items such as nocturnal awakenings, bad dreams, and trouble breathing. In previous work on a subsample of the current sample, we found “PSQI Global sleep score” to be related to volume reductions in overlapping regions (Sexton et al. 2014) in older adults. Although worse sleep may accelerate cortical atrophy in aging, stronger relationships were not found in the regions that showed the most cortical thinning. This suggests that worse sleep does not simply relate to general patterns of cortical atrophy that are typical in aging but more regionally specific patterns of cortical decline. Alternatively, these results, together with previously reported unspecific relationships between sleep, cognition, and neurodegeneration (Ohayon et al. 2004; Scullin and Bliwise 2015; Mander et al. 2017), suggest that worse sleep results from multiple changes in the aging brain. Sleep and brain decline are probably linked through complex interactions with multiple other factors, some involving atrophy and some not (Fjell et al. 2018b).
It is important to stress that effect sizes were small. Even with 4363 MRIs, only two aspects of self-reported sleep were significantly associated with a change in cortical thickness. Thus, the standard self-report sleep metrics do not seem to have much clinical relevance as markers of cortical atrophy. For participants in their 1960s, the transition from minor to severe sleep disturbances was weakly but reliably associated with cortical thinning. For 80-years-old participants that same transition was accompanied by a rather substantial increase in cortical thinning. However, as participants were not followed over time with repeated sleep measures, we do not know whether these group effects translate to relationships within individuals. Thus, although our findings are interesting as they demonstrate an age-dependent relationship between aspects of sleep and cortical thinning, the mechanisms driving this age dependency in the strength of the association between sleep and cortical thinning await further study. One important caveat is that sleep was observed at a one-time point or averaged across time points, and we were, thus, not able to assess whether a change in sleep was related to atrophy. Previous studies have found a change in sleep patterns to be predictive of atrophy (Fjell et al. 2018b) and declining cognition (Ferrie et al. 2011), and future studies should directly test such change–change relationship across the cortex.
Virtual Histology—A Possible Role of Oligodendrocytes
The age-dependent sleep association overlapped with regions characterized by higher expression of genes related to oligodendrocytes and S1 pyramidal cells. These results do not reveal any direct mechanistic relationships but yield useful information for interpretation of the findings, especially regarding genes related to oligodendrocytes. Several genes involved in the synthesis and maintenance of myelin are expressed at higher levels during sleep, and sleep loss may negatively impact oligodendrocyte physiology (Bellesi 2015). Specifically, genes involved in phospholipid synthesis and myelination tend to be transcribed preferentially during sleep (Bellesi et al. 2013). For instance, gene expression analysis performed on oligodendrocyte-enriched samples of mouse forebrain showed that several genes changing their expression in sleep and awake were oligodendrocyte precursor cell (OPC)-specific genes (Bellesi et al. 2013). Genes promoting OPC proliferation were mainly upregulated during sleep whereas OPC differentiation was mainly upregulated during awake. Such studies suggest that sleep is important for myelination (de Vivo and Bellesi 2019). Myelin properties around the GM/WM boundary affect cortical thickness estimates (Walhovd et al. 2017; Natu et al. 2019) and change through the lifespan (Westlye et al. 2009; Vidal-Pineiro et al. 2016). Thus, regions with higher expression of oligodendrocyte-related genes could be more vulnerable to poor sleep, explaining the overlap between the expression of oligodendrocyte-related genes and sleep-age-related cortical thinning. Although speculative, experimental, and large-scale genetic studies could address this.
No Relationship Between Cortical Thinning, Sleep Duration, and Memory Change
Sleep duration as measured in hours or by “PSQI #3 Sleep duration” was not associated with cortical thinning. Sleep duration is the most frequently investigated sleep measure in relation to health (Watson et al. 2015) and is potentially modifiable. It has been suggested that we have a “global epidemic of sleeplessness” (Lyon 2019; Walker 2019), and the United States National Sleep Foundation (NSF) provides sleep duration recommendations (Consensus Conference Panel et al. 2015; Hirshkowitz et al. 2015). Previous studies have, however, not provided conclusive evidence about a role for sleep duration in brain change (Lo et al. 2014; Sexton et al. 2014; Spira et al. 2016; Fjell et al. 2019b). We found no indication that sleep duration was related to cortical change, supporting previous Lifebrain results on hippocampal atrophy (Fjell et al. 2019b). In that study, however, participants from the UK Biobank reporting short (< 5 h) and long (> 9 h) sleep duration showed smaller hippocampal volume. Although we cannot conclude with confidence that extremely short or extremely long sleep duration is unrelated to cortical atrophy, our results demonstrate that within normal ranges of sleep duration, there is no association with cortical change.
Scores on the sleep scales were not related to changes in memory function. The only significant result was the interaction between PSQI #5 Sleep disturbances and age, which would not survive correction for multiple comparisons. Experimental studies often report negative effects of short-term sleep restriction on cognition (Lim and Dinges 2010), but it is unclear whether such effects are relevant in the long run and in a naturalistic setting. Meta-analytic studies have reported poorer episodic memory in people with insomnia (Fortier-Brochu et al. 2012), whereas epidemiological studies have yielded mixed results, and the largest study to date—based on 477.529 participants from the UK Biobank—found no relationship between insomnia and any cognitive function (Kyle et al. 2017). The possibility remains that longitudinal changes in self-reported sleep could be related to declining memory over time (Fjell et al. 2018b), and stronger relationships could potentially be seen with other measures of sleep (Cavuoto et al. 2016; Muehlroth et al. 2019). Still the present results, based on 1419 participants and 2702 memory tests, suggest that if a relationship between self-reported sleep and memory decline does exist, the effect size of this association can be expected to be small.
Limitations
Causes and appearance of age-related changes in sleep are manifold and diverse (Muehlroth and Werkle-Bergner 2020). There is no perfect way to measure sleep without disrupting routine (Lauderdale et al. 2008). Self-reports of sleep duration are only moderately correlated with actigraph measures (Regestein et al. 2004; Lauderdale et al. 2008; Wrzus et al. 2012), whereas actigraphs themselves tend to overestimate sleep duration compared to polysomnography (Ancoli-Israel et al. 2003; de Souza et al. 2003; Hedner et al. 2004; Sivertsen et al. 2006; Jackson et al. 2018). Still, self-report measures continue to be important in sleep studies, and epidemiological studies and the NSF recommendations are primarily based on self-reports (Hirshkowitz et al. 2015). Although we acknowledge the uncertainty of self-reports, this is currently the only viable option for testing sleep-brain relationships in large samples. Also, we are not able to distinguish between the effects of short- versus long-term sleep patterns, as PSQI only index sleep over the last month. Another possible limitation is that data were pooled across studies using partly different measures. Whereas this may introduce noise, it also reduces the risk of non-representative and biased samples and greatly increases statistical power. Finally, including different memory measures than delayed free recall could yield other results.
Conclusion
Worse self-reported sleep was related to an increased rate of cortical thinning in restricted regions after the age of 60 years. These regions are characterized by higher expression of genes related to oligodendrocytes and S1 pyramidal cells. This makes self-reported sleep a relevant variable in studies of brain aging. Small effect sizes and lack of relationship to episodic memory decline call for modesty in the implications drawn. Future studies should also directly test whether a change in self-reported sleep parameters over time shows stronger relationships to regional cortical atrophy.
Supplementary Material
Notes
The authors thank all research participants. Conflict of interest: C.E.S. reports consulting fees from Jazz Pharmaceuticals and is now a full-time employee of the Alzheimer’s Association. C.A.D. is a cofounder, stock-owner, board member, and consultant in the contract laboratory Vitas AS, performing personalized analyses of blood biomarkers. The rest of the authors report no conflicts of interest.
Contributor Information
Anders M Fjell, Center for Lifespan Changes in Brain and Cognition, University of Oslo, 0315 Oslo, Norway; Department of Radiology and Nuclear Medicine, Oslo University Hospital, 0188 Oslo, Norway.
Øystein Sørensen, Center for Lifespan Changes in Brain and Cognition, University of Oslo, 0315 Oslo, Norway.
Inge K Amlien, Center for Lifespan Changes in Brain and Cognition, University of Oslo, 0315 Oslo, Norway.
David Bartrés-Faz, Departament de Medicina, Facultat de Medicina i Ciències de la Salut, Institut de Neurociències, Universitat de Barcelona, 08007 Barcelona, Spain.
Andreas M Brandmaier, Center for Lifespan Psychology, Max Planck Institute for Human Development, 14195 Berlin, Germany; Max Planck UCL Centre for Computational Psychiatry and Ageing Research, Berlin, Germany, and London, UK.
Nikolaus Buchmann, Department of Cardiology, Charité - University Medicine Berlin Campus Benjamin Franklin, 12203 Berlin, Germany.
Ilja Demuth, Charité – Universitätsmedizin Berlin, corporate member of Freie Universität Berlin, Humboldt-Universität zu Berlin, and Berlin Institute of Health, Lipid Clinic at the Interdisciplinary Metabolism Center, Charité - Universitätsmedizin Berlin, BCRT - Berlin Institute of Health Center for Regenerative Therapies, 10117 Berlin, Germany.
Christian A Drevon, Vitas AS, Research Park, Gaustadalleen 21, 0349 Oslo, Norway; Department of Nutrition, Institute of Basic Medical Sciences, Faculty of Medicine, University of Oslo, 0315 Oslo, Norway.
Sandra Düzel, Center for Lifespan Psychology, Max Planck Institute for Human Development, 14195 Berlin, Germany.
Klaus P Ebmeier, Department of Psychiatry, University of Oxford, Oxford OX1 2JD UK.
Paolo Ghisletta, Faculty of Psychology and Educational Sciences, Swiss Distance University Institute, Swiss National Centre of Competence in Research LIVES, University of Geneva, 1205 Geneva, Switzerland.
Ane-Victoria Idland, Center for Lifespan Changes in Brain and Cognition, University of Oslo, 0315 Oslo, Norway; Oslo Delirium Research Group, Department of Geriatric Medicine, University of Oslo, 0315 Oslo, Norway; Institute of Basic Medical Sciences, University of Oslo, 0315 Oslo, Norway.
Tim C Kietzmann, MRC Cognition and Brain Sciences Unit, University of Cambridge, Cambridge CB2 1TN, UK; Donders Institute for Brain, Cognition and Behaviour, Radboud University, 6525 XZ Nijmegen, The Netherlands.
Rogier A Kievit, MRC Cognition and Brain Sciences Unit, University of Cambridge, Cambridge CB2 1TN, UK.
Simone Kühn, Center for Lifespan Psychology, Max Planck Institute for Human Development, 14195 Berlin, Germany; Department of Psychiatry and Psychotherapy, University Medical Center Hamburg-Eppendorf, 20251 Hamburg, Germany.
Ulman Lindenberger, Center for Lifespan Psychology, Max Planck Institute for Human Development, 14195 Berlin, Germany; Max Planck UCL Centre for Computational Psychiatry and Ageing Research, Berlin, Germany, and London, UK.
Fredrik Magnussen, Center for Lifespan Changes in Brain and Cognition, University of Oslo, 0315 Oslo, Norway.
Didac Macià, Departament de Medicina, Facultat de Medicina i Ciències de la Salut, Institut de Neurociències, Universitat de Barcelona, 08007 Barcelona, Spain.
Athanasia M Mowinckel, Center for Lifespan Changes in Brain and Cognition, University of Oslo, 0315 Oslo, Norway.
Lars Nyberg, Umeå Center for Functional Brain Imaging, Umeå University, 901 87 Umeå, Sweden.
Claire E Sexton, Department of Psychiatry, University of Oxford, Oxford OX1 2JD UK; Global Brain Health Institute, Department of Neurology, University of California, San Francisco, San Francisco, CA 94143, USA; Wellcome Centre for Integrative Neuroimaging, University of Oxford, Oxford OX1 2JD, UK.
Cristina Solé-Padullés, Departament de Medicina, Facultat de Medicina i Ciències de la Salut, Institut de Neurociències, Universitat de Barcelona, 08007 Barcelona, Spain.
Sara Pudas, Umeå Center for Functional Brain Imaging, Umeå University, 901 87 Umeå, Sweden.
James M Roe, Center for Lifespan Changes in Brain and Cognition, University of Oslo, 0315 Oslo, Norway.
Donatas Sederevicius, Center for Lifespan Changes in Brain and Cognition, University of Oslo, 0315 Oslo, Norway.
Sana Suri, Department of Psychiatry, University of Oxford, Oxford OX1 2JD UK; Wellcome Centre for Integrative Neuroimaging, University of Oxford, Oxford OX1 2JD, UK.
Didac Vidal-Piñeiro, Center for Lifespan Changes in Brain and Cognition, University of Oslo, 0315 Oslo, Norway.
Gerd Wagner, Psychiatric Brain and Body Research Group, Department of Psychiatry and Psychotherapy, Jena University Hospital, 07743 Jena, Germany.
Leiv Otto Watne, Oslo Delirium Research Group, Department of Geriatric Medicine, University of Oslo, 0315 Oslo, Norway.
René Westerhausen, Center for Lifespan Changes in Brain and Cognition, University of Oslo, 0315 Oslo, Norway.
Enikő Zsoldos, Department of Psychiatry, University of Oxford, Oxford OX1 2JD UK; Wellcome Centre for Integrative Neuroimaging, University of Oxford, Oxford OX1 2JD, UK.
Kristine B Walhovd, Center for Lifespan Changes in Brain and Cognition, University of Oslo, 0315 Oslo, Norway; Department of Radiology and Nuclear Medicine, Oslo University Hospital, 0188 Oslo, Norway.
Funding
The Lifebrain project is supported by the EU Horizon 2020 Grant: ‘Healthy minds 0–100 years: Optimising the use of European brain imaging cohorts (“Lifebrain”)’. Grant agreement number: 732592. Call: Societal challenges: Health, demographic change, and well-being. In addition, the different sub-studies are supported by different sources. LCBC: The European Research Council under grant agreements 283634, 725025 (to A.M.F.) and 313440 (to K.B.W.), as well as the Norwegian Research Council (to A.M.F., K.B.W.), The National Association for Public Health’s dementia research program, Norway (to A.M.F) and the Medical Student Research Program at the University of Oslo. Betula: a scholar grant from the Knut and Alice Wallenberg (KAW) foundation to L.N. Barcelona: Partially supported by a Spanish Ministry of Economy and Competitiveness (MINECO) grant to D-BF [grant number PSI2015–64227-R (AEI/FEDER, UE)]; by the Walnuts and Healthy Aging study (http://www.clinicaltrials.gov; Grant NCT01634841) funded by the California Walnut Commission, Sacramento, California. BASE-II has been supported by the German Federal Ministry of Education and Research under grant numbers 16SV5537/16SV5837/16SV5538/16SV5536K/01UW0808/01UW0706/01GL1716A/01GL1716B, and S.K. has received support from the European Research Council under grant agreement 677804. The Wellcome Centre for Integrative Neuroimaging is supported by core funding from award 203139/Z/16/Z from the Wellcome Trust. Drs Suri and Zsoldos were funded by award the UK Medical Research Council (G1001354) and the HDH Wills 1965 Charitable Trust (1117747). Dr Suri is now funded by the UK Alzheimer’s Society Research Fellowship (Grant Ref 441); C.E.S. and Suri are supported by the NIHR Oxford Health Biomedical Research Centre. Parts of the data collection and sharing was funded by the Alzheimer’s Disease Neuroimaging Initiative (ADNI) (National Institutes of Health Grant U01 AG024904) and DOD ADNI (Department of Defense award number W81XWH-12-2-0012). Data collection and sharing for this project was also funded by the ADNI (National Institutes of Health Grant U01 AG024904) and DOD ADNI (Department of Defense award number W81XWH-12-2-0012). ADNI is funded by the National Institute on Aging, the National Institute of Biomedical Imaging and Bioengineering, and through generous contributions from the following: AbbVie, Alzheimer’s Association; Alzheimer’s Drug Discovery Foundation; Araclon Biotech; BioClinica, Inc.; Biogen; Bristol-Myers Squibb Company; CereSpir, Inc.; Cogstate; Eisai Inc.; Elan Pharmaceuticals, Inc.; Eli Lilly and Company; EuroImmun; F. Hoffmann-La Roche Ltd and its affiliated company Genentech, Inc.; Fujirebio; GE Healthcare; IXICO Ltd; Janssen Alzheimer Immunotherapy Research & Development, LLC.; Johnson & Johnson Pharmaceutical Research & Development LLC.; Lumosity; Lundbeck; Merck & Co., Inc.; Meso Scale Diagnostics, LLC.; NeuroRx Research; Neurotrack Technologies; Novartis Pharmaceuticals Corporation; Pfizer Inc.; Piramal Imaging; Servier; Takeda Pharmaceutical Company; and Transition Therapeutics. The Canadian Institutes of Health Research is providing funds to support ADNI clinical sites in Canada. Private sector contributions are facilitated by the Foundation for the National Institutes of Health (www.fnih.org). The grantee organization is the Northern California Institute for Research and Education, and the study is coordinated by the Alzheimer’s Therapeutic Research Institute at the University of Southern California. ADNI data are disseminated by the Laboratory for Neuro Imaging at the University of Southern California.
References
- Abellaneda-Perez K, Vaque-Alcazar L, Vidal-Pineiro D, Jannati A, Solana E, Bargallo N, Santarnecchi E, Pascual-Leone A, Bartres-Faz D. 2019. Age-related differences in default-mode network connectivity in response to intermittent theta-burst stimulation and its relationships with maintained cognition and brain integrity in healthy aging. Neuroimage. 188:794–806. [DOI] [PMC free article] [PubMed] [Google Scholar]
- Allen M, Poggiali D, Whitaker K, Marshall TR, Kievit RA. 2019. Raincloud plots: a multi-platform tool for robust data visualization. Wellcome Open Res. 4:63. [DOI] [PMC free article] [PubMed] [Google Scholar]
- Alperin N, Wiltshire J, Lee SH, Ramos AR, Hernandez-Cardenache R, Rundek T, Cid RC, Loewenstein D. 2019. Effect of sleep quality on amnestic mild cognitive impairment vulnerable brain regions in cognitively normal elderly individuals. Sleep. 42(3):zsy254. doi: 10.1093/sleep/zsy254. [DOI] [PMC free article] [PubMed] [Google Scholar]
- Altena E, Vrenken H, Van Der Werf YD, van den Heuvel OA, Van Someren EJW. 2010. Reduced orbitofrontal and parietal gray matter in chronic insomnia: a voxel-based morphometric study. Biol Psychiatry. 67(2):182–185. [DOI] [PubMed] [Google Scholar]
- Ancoli-Israel S, Cole R, Alessi C, Chambers M, Moorcroft W, Pollak CP. 2003. The role of actigraphy in the study of sleep and circadian rhythms. Sleep. 26:342–392. [DOI] [PubMed] [Google Scholar]
- Aribisala BS, Riha RL, Valdes Hernandez MV, Maniega SM, Cox S, Radakovic R, Taylor A, Pattie A, Corley J, Redmond P, Bastin ME, Starr J, Deary I, Warlaw JM. 2020. Sleep and brain morphological changes in the eighth decade of life. Sleep Med. 65:152–158. [DOI] [PubMed] [Google Scholar]
- Beck AT, Steer RA. 1984. Internal consistencies of the original and revised Beck depression inventory. J Clin Psychol. 40:1365–1367. [DOI] [PubMed] [Google Scholar]
- Bellesi M. 2015. Sleep and oligodendrocyte functions. Curr Sleep Med Rep. 1:20–26. [DOI] [PMC free article] [PubMed] [Google Scholar]
- Bellesi M, Pfister-Genskow M, Maret S, Keles S, Tononi G, Cirelli C. 2013. Effects of sleep and wake on oligodendrocytes and their precursors. J Neurosci. 33:14288–14300. [DOI] [PMC free article] [PubMed] [Google Scholar]
- Bernal-Rusiel JL, Greve DN, Reuter M, Fischl B, Sabuncu MR, Alzheimer's Disease Neuroimaging Initiative . 2013a. Statistical analysis of longitudinal neuroimage data with linear mixed effects models. Neuroimage. 66:249–260. [DOI] [PMC free article] [PubMed] [Google Scholar]
- Bernal-Rusiel JL, Reuter M, Greve DN, Fischl B, Sabuncu MR, Alzheimer's Disease Neuroimaging I. 2013b. Spatiotemporal linear mixed effects modeling for the mass-univariate analysis of longitudinal neuroimage data. Neuroimage. 81:358–370. [DOI] [PMC free article] [PubMed] [Google Scholar]
- Bertram L, Bockenhoff A, Demuth I, Duzel S, Eckardt R, Li SC, Lindenberger U, Pawelec G, Siedler T, Wagner GG et al. 2014. Cohort profile: the berlin aging study II (BASE-II). Int J Epidemiol. 43:703–712. [DOI] [PubMed] [Google Scholar]
- Branger P, Arenaza-Urquijo EM, Tomadesso C, Mezenge F, Andre C, de Flores R, Mutlu J, de La Sayette V, Eustache F, Chetelat G et al. 2016. Relationships between sleep quality and brain volume, metabolism, and amyloid deposition in late adulthood. Neurobiol Aging. 41:107–114. [DOI] [PubMed] [Google Scholar]
- Del Brutto OH, Mera RM, Zambrano M, Castillo PR. 2016. The association between poor sleep quality and global cortical atrophy is related to age. Results from the Atahualpa Project. Sleep Sci. 9(3):147–150. [DOI] [PMC free article] [PubMed] [Google Scholar]
- Bubu OM, Brannick M, Mortimer J, Umasabor-Bubu O, Sebastiao YV, Wen Y, Schwartz S, Borenstein AR, Wu Y, Morgan D et al. 2017. Sleep, cognitive impairment, and Alzheimer's disease: A systematic review and meta-analysis. Sleep. 40:1–18. [DOI] [PubMed] [Google Scholar]
- Buysse DJ, Reynolds CF 3rd, Monk TH, Berman SR, Kupfer DJ. 1989. The Pittsburgh sleep quality index: a new instrument for psychiatric practice and research. Psychiatry Res. 28:193–213. [DOI] [PubMed] [Google Scholar]
- Carvalho DZ, St Louis EK, Boeve BF, Mielke MM, Przybelski SA, Knopman DS, Machulda MM, Roberts RO, Geda YE, Petersen RC et al. 2017. Excessive daytime sleepiness and fatigue may indicate accelerated brain aging in cognitively normal late middle-aged and older adults. Sleep Med. 32:236–243. [DOI] [PMC free article] [PubMed] [Google Scholar]
- Cavuoto MG, Ong B, Pike KE, Nicholas CL, Bei B, Kinsella GJ. 2016. Objective but not subjective sleep predicts memory in community-dwelling older adults. J Sleep Res. 25:475–485. [DOI] [PubMed] [Google Scholar]
- Consensus Conference Panel, Watson NF, Badr MS, Belenky G, Bliwise DL, Buxton OM, Buysse D, Dinges DF, Gangwisch J, Grandner MA et al. 2015. Joint Consensus statement of the American Academy of sleep medicine and Sleep Research Society on the recommended amount of sleep for a healthy adult: methodology and discussion. Sleep. 38:1161–1183. [DOI] [PMC free article] [PubMed] [Google Scholar]
- Dale AM, Fischl B, Sereno MI. 1999. Cortical surface-based analysis. I Segmentation and surface reconstruction Neuroimage. 9:179–194. [DOI] [PubMed] [Google Scholar]
- de Souza L, Benedito-Silva AA, Pires ML, Poyares D, Tufik S, Calil HM. 2003. Further validation of actigraphy for sleep studies. Sleep. 26:81–85. [DOI] [PubMed] [Google Scholar]
- de Vivo L, Bellesi M. 2019. The role of sleep and wakefulness in myelin plasticity. Glia. 67:2142–2152. [DOI] [PMC free article] [PubMed] [Google Scholar]
- Delis DC, Freeland J, Kramer JH, Kaplan E. 1988. Integrating clinical assessment with cognitive neuroscience: construct validation of the California verbal learning test. J Consult Clin Psychol. 56:123–130. [DOI] [PubMed] [Google Scholar]
- Desikan RS, Segonne F, Fischl B, Quinn BT, Dickerson BC, Blacker D, Buckner RL, Dale AM, Maguire RP, Hyman BT et al. 2006. An automated labeling system for subdividing the human cerebral cortex on MRI scans into gyral based regions of interest. Neuroimage. 31:968–980. [DOI] [PubMed] [Google Scholar]
- Fan L, Xu W, Cai Y, Hu Y, Wu C. 2019. Sleep duration and the risk of dementia: A systematic review and meta-analysis of prospective cohort studies. J Am Med Dir Assoc. 20(1480–1487):e1485. [DOI] [PubMed] [Google Scholar]
- Ferrie JE, Shipley MJ, Akbaraly TN, Marmot MG, Kivimaki M, Singh-Manoux A. 2011. Change in sleep duration and cognitive function: findings from the Whitehall II study. Sleep. 34:565–573. [DOI] [PMC free article] [PubMed] [Google Scholar]
- Fischl B, Salat DH, Busa E, Albert M, Dieterich M, Haselgrove C, van der Kouwe A, Killiany R, Kennedy D, Klaveness S et al. 2002. Whole brain segmentation: automated labeling of neuroanatomical structures in the human brain. Neuron. 33:341–355. [DOI] [PubMed] [Google Scholar]
- Fjell AM, Chen CH, Sederevicius D, Sneve MH, Grydeland H, Krogsrud SK, Amlien I, Ferschmann L, Ness H, Folvik L et al. 2018a. Continuity and discontinuity in human cortical development and change from embryonic stages to old age. Cereb Cortex. 29(9):3879–3890. [DOI] [PubMed] [Google Scholar]
- Fjell AM, Idland AV, Sala-Llonch R, Watne LO, Borza T, Braekhus A, Lona T, Zetterberg H, Blennow K, Wyller TB et al. 2018b. Neuroinflammation and tau interact with amyloid in predicting sleep problems in aging independently of atrophy. Cereb Cortex. 28:2775–2785. [DOI] [PubMed] [Google Scholar]
- Fjell AM, Sederevicius D, Sneve MH, de Lange AG, Brathen AC, Idland AV, Watne LO, Wang Y, Reinbold C, Dobricic V et al. 2019a. Self-reported sleep problems related to amyloid deposition in cortical regions with high HOMER1 gene expression. Cereb Cortex. 30(4):2144–2156. [DOI] [PMC free article] [PubMed] [Google Scholar]
- Fjell AM, Sorensen O, Amlien IK, Bartres-Faz D, Bros DM, Buchmann N, Demuth I, Drevon CA, Duzel S, Ebmeier KP et al. 2019b. Self-reported sleep relates to hippocampal atrophy across the adult lifespan - results from the Lifebrain consortium. Sleep. [DOI] [PMC free article] [PubMed] [Google Scholar]
- Fortier-Brochu E, Beaulieu-Bonneau S, Ivers H, Morin CM. 2012. Insomnia and daytime cognitive performance: a meta-analysis. Sleep Med Rev. 16:83–94. [DOI] [PubMed] [Google Scholar]
- French L, Paus T. 2015. A FreeSurfer view of the cortical transcriptome generated from the Allen human brain atlas. Front Neurosci. 9:323. [DOI] [PMC free article] [PubMed] [Google Scholar]
- Gadie A, Shafto M, Leng Y, Kievit RA, Cam CAN. 2017. How are age-related differences in sleep quality associated with health outcomes? An epidemiological investigation in a UK cohort of 2406 adults. BMJ Open. 7:e014920. [DOI] [PMC free article] [PubMed] [Google Scholar]
- Gerstorf D, Bertram L, Lindenberger U, Pawelec G, Demuth I, Steinhagen-Thiessen E, Wagner GG. 2016. Editorial. Gerontology. 62:311–315. [DOI] [PubMed] [Google Scholar]
- Grau-Rivera O, Operto G, Falcón C, Sánchez-Benavides G, Cacciaglia R, Brugulat-Serrat A, Gramunt N, Salvadó G, Suárez-Calvet M, Minguillon C, et al. 2020. Association between insomnia and cognitive performance, gray matter volume, and white matter microstructure in cognitively unimpaired adults. Alzheimers Res Ther. 12(1):4. 10.1186/s13195-019-0547-3. [DOI] [PMC free article] [PubMed] [Google Scholar]
- Hagler DJ Jr, Saygin AP, Sereno MI. 2006. Smoothing and cluster thresholding for cortical surface-based group analysis of fMRI data. Neuroimage. 33:1093–1103. [DOI] [PMC free article] [PubMed] [Google Scholar]
- Hatfield CF, Herbert J, van Someren EJ, Hodges JR, Hastings MH. 2004. Disrupted daily activity/rest cycles in relation to daily cortisol rhythms of home-dwelling patients with early Alzheimer's dementia. Brain. 127:1061–1074. [DOI] [PubMed] [Google Scholar]
- Hawrylycz MJ, Lein ES, Guillozet-Bongaarts AL, Shen EH, Ng L, Miller JA, van de Lagemaat LN, Smith KA, Ebbert A, Riley ZL et al. 2012. An anatomically comprehensive atlas of the adult human brain transcriptome. Nature. 489:391–399. [DOI] [PMC free article] [PubMed] [Google Scholar]
- Hedner J, Pillar G, Pittman SD, Zou D, Grote L, White DP. 2004. A novel adaptive wrist actigraphy algorithm for sleep-wake assessment in sleep apnea patients. Sleep. 27:1560–1566. [DOI] [PubMed] [Google Scholar]
- Helfrich RF, Mander BA, Jagust WJ, Knight RT, Walker MP. 2018. Old Brains Come Uncoupled in Sleep: Slow Wave-Spindle Synchrony, Brain Atrophy, and Forgetting. Neuron. 97(1):221–230. [DOI] [PMC free article] [PubMed] [Google Scholar]
- Hirshkowitz M, Whiton K, Albert SM, Alessi C, Bruni O, DonCarlos L, Hazen N, Herman J, Adams Hillard PJ, Katz ES et al. 2015. National Sleep Foundation's updated sleep duration recommendations: final report. Sleep Health. 1:233–243. [DOI] [PubMed] [Google Scholar]
- Irwin MR, Vitiello MV. 2019. Implications of sleep disturbance and inflammation for Alzheimer's disease dementia. Lancet Neurol. 18(3):296–306. [DOI] [PubMed] [Google Scholar]
- Jackson CL, Patel SR, Jackson WB 2nd, Lutsey PL, Redline S. 2018. Agreement between self-reported and objectively measured sleep duration among white, black, Hispanic, and Chinese adults in the United States: multi-ethnic study of atherosclerosis. Sleep. 41:zsy057. [DOI] [PMC free article] [PubMed] [Google Scholar]
- Joo EY, Noh HJ, Kim J-S, Koo DL, Kim D, Hwang KJ, Kim JY, Kim ST, Kim MR et al. 2013. Brain Gray Matter Deficits in Patients with Chronic Primary Insomnia. Sleep. 36(7):999–1007. [DOI] [PMC free article] [PubMed] [Google Scholar]
- Jovicich J, Marizzoni M, Sala-Llonch R, Bosch B, Bartres-Faz D, Arnold J, Benninghoff J, Wiltfang J, Roccatagliata L, Nobili F et al. 2013. Brain morphometry reproducibility in multi-center 3T MRI studies: a comparison of cross-sectional and longitudinal segmentations. Neuroimage. 83:472–484. [DOI] [PubMed] [Google Scholar]
- Kyle SD, Sexton CE, Feige B, Luik AI, Lane J, Saxena R, Anderson SG, Bechtold DA, Dixon W, Little MA et al. 2017. Sleep and cognitive performance: cross-sectional associations in the UK biobank. Sleep Med. 38:85–91. [DOI] [PMC free article] [PubMed] [Google Scholar]
- Lauderdale DS, Knutson KL, Yan LL, Liu K, Rathouz PJ. 2008. Self-reported and measured sleep duration: how similar are they? Epidemiology. 19:838–845. [DOI] [PMC free article] [PubMed] [Google Scholar]
- Lim ASP, Fleischman DA, Dawe RJ, Yu L , Arfanakis K, Buchman AS, Bennett DA. 2016. Regional Neocortical Gray Matter Structure and Sleep Fragmentation in Older Adults. Sleep. 39(1):227–235. [DOI] [PMC free article] [PubMed] [Google Scholar]
- Lim J, Dinges DF. 2010. A meta-analysis of the impact of short-term sleep deprivation on cognitive variables. Psychol Bull. 136:375–389. [DOI] [PMC free article] [PubMed] [Google Scholar]
- Lo JC, Loh KK, Zheng H, Sim SK, Chee MW. 2014. Sleep duration and age-related changes in brain structure and cognitive performance. Sleep. 37:1171–1178. [DOI] [PMC free article] [PubMed] [Google Scholar]
- Lyon L. 2019. Is an epidemic of sleeplessness increasing the incidence of Alzheimer's disease? Brain. 142:e30. [DOI] [PubMed] [Google Scholar]
- Mander BA, Winer JR, Jagust WJ, Walker MP. 2016. Sleep: A novel mechanistic pathway, biomarker, and treatment target in the pathology of Alzheimer's Disease? Trends Neurosci. 39:552–566. [DOI] [PMC free article] [PubMed] [Google Scholar]
- Mander BA, Winer JR, Walker MP. 2017. Sleep and human aging. Neuron. 94:19–36. [DOI] [PMC free article] [PubMed] [Google Scholar]
- Moon C, Melah KE, Rivera-Rivera LA, Bratzke LC. 2018. Multimodal brain imaging investigation of self-reported sleep quality and daytime sleepiness in older adults with heart failure. Int J Neurosci. 128(11):1044–1051. [DOI] [PMC free article] [PubMed] [Google Scholar]
- Morrell MJ, McRobbie DW, Quest RA, Cummin AR, Ghiassi R, Corfield DR. 2003. Changes in brain morphology associated with obstructive sleep apnea. Sleep Med. 4(5):451–454. [DOI] [PubMed] [Google Scholar]
- Muehlroth BE, Sander MC, Fandakova Y, Grandy TH, Rasch B, Shing YL, Werkle-Bergner M. 2019. Precise slow oscillation-spindle coupling promotes memory consolidation in younger and older adults. Sci Rep. 9:1940. [DOI] [PMC free article] [PubMed] [Google Scholar]
- Muehlroth BE, Werkle-Bergner M. 2020. Understanding the interplay of sleep and aging: methodological challenges. Psychophysiology. 57:e13523. [DOI] [PubMed] [Google Scholar]
- Natu VS, Gomez J, Barnett M, Jeska B, Kirilina E, Jaeger C, Zhen Z, Cox S, Weiner KS, Weiskopf N et al. 2019. Apparent thinning of human visual cortex during childhood is associated with myelination. Proc Natl Acad Sci USA. 116:20750–20759. [DOI] [PMC free article] [PubMed] [Google Scholar]
- Nilsson LG, Backman L, Erngrund K, Nyberg L, Adolfsson R, Bucht G, Karlsson S, Widing M, Winblad B. 1997. The Betula prospective cohort study: memory, health and aging. Aging Neuropsychol Cogin. 4:1–32. [Google Scholar]
- Nordin M, Åkerstedt T, Nordin S. 2013. Psychometric evaluation and normative data for the Karolinska sleep questionnaire. Sleep Biol Rhythms. 11:216–226. [Google Scholar]
- Ohayon MM, Carskadon MA, Guilleminault C, Vitiello MV. 2004. Meta-analysis of quantitative sleep parameters from childhood to old age in healthy individuals: developing normative sleep values across the human lifespan. Sleep. 27:1255–1273. [DOI] [PubMed] [Google Scholar]
- Pillai V, Roth T, Drake CL. 2015. The nature of stable insomnia phenotypes. Sleep. 38:127–138. [DOI] [PMC free article] [PubMed] [Google Scholar]
- Prinz PN, Vitaliano PP, Vitiello MV, Bokan J, Raskind M, Peskind E, Gerber C. 1982. Sleep, EEG and mental function changes in senile dementia of the Alzheimer's type. Neurobiol Aging. 3:361–370. [DOI] [PubMed] [Google Scholar]
- Pudas S, Ronnlund M. 2019. School performance and educational attainment as early-life predictors of age-related memory decline: protective influences in later-born cohorts. J Gerontol B Psychol Sci Soc Sci. 74:1357–1365. [DOI] [PubMed] [Google Scholar]
- Radloff LS. 1977. The CES-D scale: A self report depression scale for research in the general population. Appl Psychol Measur. 1:385–401. [Google Scholar]
- Rajaram S, Valls-Pedret C, Cofan M, Sabate J, Serra-Mir M, Perez-Heras AM, Arechiga A, Casaroli-Marano RP, Alforja S, Sala-Vila A et al. 2016. The walnuts and healthy aging study (WAHA): protocol for a nutritional intervention trial with walnuts on brain aging. Front Aging Neurosci. 8:333. [DOI] [PMC free article] [PubMed] [Google Scholar]
- Raz N, Daugherty AM. 2018. Pathways to brain aging and their modifiers: free-radical-induced energetic and neural decline in senescence (FRIENDS) model - A mini-review. Gerontology. 64:49–57. [DOI] [PMC free article] [PubMed] [Google Scholar]
- Regestein QR, Friebely J, Shifren JL, Scharf MB, Wiita B, Carver J, Schiff I. 2004. Self-reported sleep in postmenopausal women. Menopause. 11:198–207. [DOI] [PubMed] [Google Scholar]
- Reuter M, Schmansky NJ, Rosas HD, Fischl B. 2012. Within-subject template estimation for unbiased longitudinal image analysis. Neuroimage. 61:1402–1418. [DOI] [PMC free article] [PubMed] [Google Scholar]
- Riemann D, Voderholzer U, Spiegelhalder K, Hornyak M, Buysse DJ, Nissen C, Hennig J, Perlis ML, van Elst LT, Feige B. 2007. Chronic insomnia and MRI-measured hippocampal volumes: a pilot study. Sleep. 30(8):955–958. [DOI] [PMC free article] [PubMed] [Google Scholar]
- Reinhard MA, Regen W, Baglioni C, Nissen C, Feige B, Hennig J, Riemann D, Spiegelhalder K. 2014. The relationship between brain morphology and polysomnography in healthy good sleepers. PLoS One. 9(10):e109336. doi: 10.1371/journal.pone.0109336. eCollection 2014. [DOI] [PMC free article] [PubMed] [Google Scholar]
- Ryan JJ, Geisser ME. 1986. Validity and diagnostic accuracy of an alternate form of the Rey auditory verbal learning test. Arch Clin Neuropsychol. 1:209–217. [PubMed] [Google Scholar]
- Scullin MK, Bliwise DL. 2015. Sleep, cognition, and normal aging: integrating a half century of multidisciplinary research. Perspect Psychol Sci. 10:97–137. [DOI] [PMC free article] [PubMed] [Google Scholar]
- Sexton CE, Storsve AB, Walhovd KB, Johansen-Berg H, Fjell AM. 2014. Poor sleep quality is associated with increased cortical atrophy in community-dwelling adults. Neurology. 83:967–973. [DOI] [PMC free article] [PubMed] [Google Scholar]
- Shafto MA, Tyler LK, Dixon M, Taylor JR, Rowe JB, Cusack R, Calder AJ, Marslen-Wilson WD, Duncan J, Dalgleish T et al. 2014. The Cambridge Centre for Ageing and Neuroscience (Cam-CAN) study protocol: a cross-sectional, lifespan, multidisciplinary examination of healthy cognitive ageing. BMC Neurol. 14:204. [DOI] [PMC free article] [PubMed] [Google Scholar]
- Shi L, Chen SJ, Ma MY, Bao YP, Han Y, Wang YM, Shi J, Vitiello MV, Lu L. 2018. Sleep disturbances increase the risk of dementia: A systematic review and meta-analysis. Sleep Med Rev. 40:4–16. [DOI] [PubMed] [Google Scholar]
- Shin J, French L, Xu T, Leonard G, Perron M, Pike GB, Richer L, Veillette S, Pausova Z, Paus T. 2018. Cell-specific gene-expression profiles and cortical thickness in the human brain. Cereb Cortex. 28:3267–3277. [DOI] [PMC free article] [PubMed] [Google Scholar]
- Sivertsen B, Omvik S, Havik OE, Pallesen S, Bjorvatn B, Nielsen GH, Straume S, Nordhus IH. 2006. A comparison of actigraphy and polysomnography in older adults treated for chronic primary insomnia. Sleep. 29:1353–1358. [DOI] [PubMed] [Google Scholar]
- Suh S et al. 2016. Cortical Thinning and Altered Cortico-Cortical Structural Covariance of the Default Mode Network in Patients with Persistent Insomnia Symptoms. Sleep. 39(1):161–171. [DOI] [PMC free article] [PubMed] [Google Scholar]
- Spiegelhalder K, Regen W, Baglioni C, Klöppel S, Abdulkadir A, Hennig J, Nissen C, Riemann D, Feige B. 2013. Insomnia does not appear to be associated with substantial structural brain changes. Sleep. 36(5):731–737. [DOI] [PMC free article] [PubMed] [Google Scholar]
- Spira AP, Gonzalez CE, Venkatraman VK, Wu MN, Pacheco J, Simonsick EM, Ferrucci L, Resnick SM. 2016. Sleep duration and subsequent cortical thinning in cognitively normal older adults. Sleep. 39:1121–1128. [DOI] [PMC free article] [PubMed] [Google Scholar]
- Stoffers D, Moens S, Benjamins J, van Tol M-J, Penninx BWJH, Veltman DJ, Van der Wee NJA, Van Someren EJW. 2012. Orbitofrontal gray matter relates to early morning awakening: a neural correlate of insomnia complaints?. Front Neurol. 3:105. doi: 10.3389/fneur.2012.00105. eCollection 2012. [DOI] [PMC free article] [PubMed] [Google Scholar]
- R Core Team . 2019. R: A language and environment for statistical computing. R Foundation for Statistical Computing, Vienna, Austria. https://www.R-project.org/ [Google Scholar]
- Taki Y, Hashizume H, Thyreau B, Sassa Y, Takeuchi H , Wu K, Kotozaki Y, Nouchi R, Asano M, Asano K, et al. 2012. Sleep duration during weekdays affects hippocampal gray matter volume in healthy children. Neuroimage. 60(1):471–475. [DOI] [PubMed] [Google Scholar]
- Vidal-Pineiro D, Martin-Trias P, Arenaza-Urquijo EM, Sala-Llonch R, Clemente IC, Mena-Sanchez I, Bargallo N, Falcon C, Pascual-Leone A, Bartres-Faz D. 2014. Task-dependent activity and connectivity predict episodic memory network-based responses to brain stimulation in healthy aging. Brain Stimul. 7:287–296. [DOI] [PMC free article] [PubMed] [Google Scholar]
- Vidal-Pineiro D, Walhovd KB, Storsve AB, Grydeland H, Rohani DA, Fjell AM. 2016. Accelerated longitudinal gray/white matter contrast decline in aging in lightly myelinated cortical regions. Hum Brain Mapp. 37:3669–3684. [DOI] [PMC free article] [PubMed] [Google Scholar]
- Videnovic A, Lazar AS, Barker RA, Overeem S. 2014. 'The clocks that time us'--circadian rhythms in neurodegenerative disorders. Nat Rev Neurol. 10:683–693. [DOI] [PMC free article] [PubMed] [Google Scholar]
- Walhovd KB, Fjell AM, Giedd J, Dale AM, Brown TT. 2017. Through thick and thin: a need to reconcile contradictory results on trajectories in human cortical development. Cereb Cortex. 27:1472–1481. [DOI] [PMC free article] [PubMed] [Google Scholar]
- Walhovd KB, Krogsrud SK, Amlien IK, Bartsch H, Bjornerud A, Due-Tonnessen P, Grydeland H, Hagler DJ Jr, Haberg AK, Kremen WS et al. 2016. Neurodevelopmental origins of lifespan changes in brain and cognition. Proc Natl Acad Sci USA. 113:9357–9362. [DOI] [PMC free article] [PubMed] [Google Scholar]
- Walker MP. 2019. A societal sleep prescription. Neuron. 103:559–562. [DOI] [PubMed] [Google Scholar]
- Watson NF, Badr MS, Belenky G, Bliwise DL, Buxton OM, Buysse D, Dinges DF, Gangwisch J, Grandner MA, Kushida C et al. 2015. Recommended amount of sleep for a healthy adult: A joint Consensus statement of the American Academy of sleep medicine and Sleep Research Society. Sleep. 38:843–844. [DOI] [PMC free article] [PubMed] [Google Scholar]
- Westerlund A, Brandt L, Harlid R, Akerstedt T, Lagerros YT. 2014. Using the Karolinska sleep questionnaire to identify obstructive sleep apnea syndrome in a sleep clinic population. Clin Respir J. 8:444–454. [DOI] [PubMed] [Google Scholar]
- Westlye LT, Walhovd KB, Dale AM, Espeseth T, Reinvang I, Raz N, Agartz I, Greve DN, Fischl B, Fjell AM. 2009. Increased sensitivity to effects of normal aging and Alzheimer's disease on cortical thickness by adjustment for local variability in gray/white contrast: a multi-sample MRI study. Neuroimage. 47:1545–1557. [DOI] [PMC free article] [PubMed] [Google Scholar]
- Winkelman JW, Plante DT, Schoerning L, Benson K, Buxton OM, O’Connor SP, Jensen JE, Renshaw PF, Gonenc A. 2013. Increased Rostral Anterior Cingulate Cortex Volume in Chronic Primary Insomnia. Sleep. 36(7):991–998. [DOI] [PMC free article] [PubMed] [Google Scholar]
- Wood SN. 2017. Generalized Additive Models: An Introduction with R. 2nd ed. Boca Raton, FL: CRC Press. [Google Scholar]
- Wrzus C, Brandmaier AM, von Oertzen T, Muller V, Wagner GG, Riediger M. 2012. A new approach for assessing sleep duration and postures from ambulatory accelerometry. PLoS One. 7:e48089. [DOI] [PMC free article] [PubMed] [Google Scholar]
- Xu W, Tan CC, Zou JJ, Cao XP, Tan L. 2020. Sleep problems and risk of all-cause cognitive decline or dementia: an updated systematic review and meta-analysis. J Neurol Neurosurg Psychiatry. 91:236–244. [DOI] [PMC free article] [PubMed] [Google Scholar]
- Yesavage JA, Brink TL, Rose TL, Lum O, Huang V, Adey M, Leirer VO. 1982. Development and validation of a geriatric depression screening scale: a preliminary report. J Psychiatr Res. 17:37–49. [DOI] [PubMed] [Google Scholar]
- Zeisel A, Munoz-Manchado AB, Codeluppi S, Lonnerberg P, La Manno G, Jureus A, Marques S, Munguba H, He L, Betsholtz C et al. 2015. Brain structure. Cell types in the mouse cortex and hippocampus revealed by single-cell RNA-seq. Science. 347:1138–1142. [DOI] [PubMed] [Google Scholar]
- Zigmond AS, Snaith RP. 1983. The hospital anxiety and depression scale. Acta Psychiatr Scand. 67:361–370. [DOI] [PubMed] [Google Scholar]
- Zitser J, Anaturk M, Zsoldos E, Mahmood A, Filippini N, Suri S, Leng Y, Yaffe K, Singh-Manoux A, Kivimaki M et al. 2020. Sleep duration over 28 years, cognition, gray matter volume, and white matter microstructure: a prospective cohort study. Sleep. 43(5):zsz290. doi: 10.1093/sleep/zsz290. [DOI] [PMC free article] [PubMed] [Google Scholar]
Associated Data
This section collects any data citations, data availability statements, or supplementary materials included in this article.