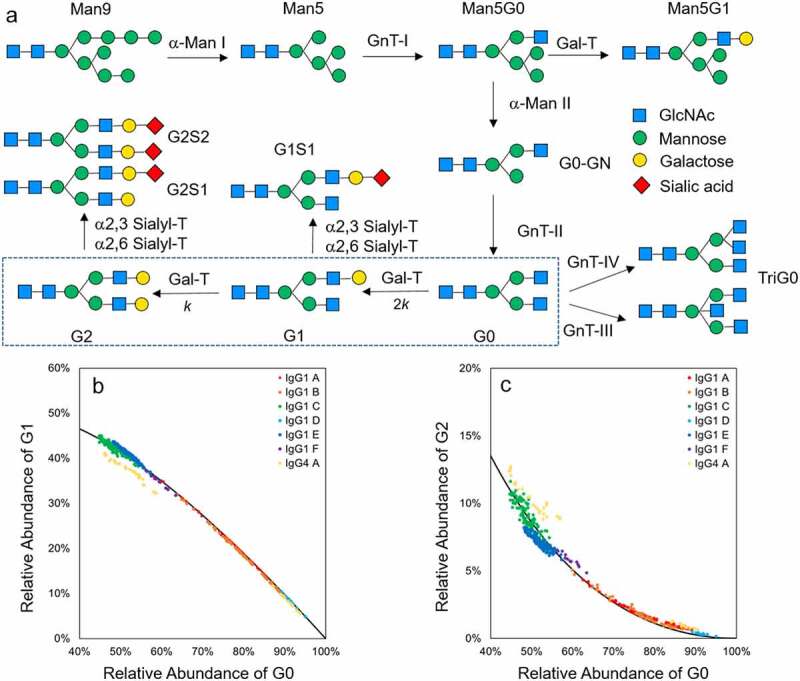
Figure 1.

N-Glycan synthesis pathway and correlation between different galactosylation species. (a) IgG1 N-glycan synthesis pathway in Golgi apparatus. The IgG enters the Golgi apparatus from the endoplasmic reticulum (ER) with the Man9 glycan on Fc. The glycan is further modified with the pathway shown in the figure. α-Man I and II: α-mannosidase I and II; GnT I, II, III and IV: GlcNAc-transferase I, II, III and IV; Gal-T: β-1,4 galactosyltransferases; α2,3 Sialyl-T: α-2,3 sialyltransferase; α-2,6 Sialyl-T: α-2,6 sialyltransferase; (b) Correlation between G1 and G0(left), G2 and G0 (right) with 12,000 L drug substance batches data (N = 410). Each point represents one 12,000 L batch data. Each IgG molecule is represented by a different color. Solid lines represents the theoretical derived curve based on the consecutive kinetic model
