

ABSTRACT
Accumulating evidence indicates that immune checkpoint inhibitors (ICIs) can restore CD8+ cytotoxic T lymphocyte (CTL) functions in preclinical models of acute myeloid leukemia (AML). However, ICIs targeting programmed cell death 1 (PDCD1, best known as PD-1) and cytotoxic T lymphocyte-associated protein 4 (CTLA4) have limited clinical efficacy in patients with AML. Natural killer (NK) cells are central players in AML-targeting immune responses. However, little is known on the relationship between co-inhibitory receptors expressed by NK cells and the ability of the latter to control AML. Here, we show that hepatitis A virus cellular receptor 2 (HAVCR2, best known as TIM-3) is highly expressed by NK cells from AML patients, correlating with improved functional licensing and superior effector functions. Altogether, our data indicate that NK cell frequency as well as TIM-3 expression levels constitute prognostically relevant biomarkers of active immunity against AML.
KEYWORDS: Co-inhibitory receptor, innate lymphoid cells, lag-3, tigit, vista
Introduction
Natural killer (NK) cells are innate lymphoid cells that play a key role in the defense of the organism against viral infection, early malignant transformation as well as metastatic tumor dissemination.1–5 NK cell effector functions encompass potent cytotoxicity against target cells,6 as well as the secretion of immunomodulatory cytokines that orchestrate additional arms of the innate and adaptive immune response.7 Such functions do not emerge from the recognition of a specific antigen, as in the case of CD8+ cytotoxic T lymphocytes (CTLs),8,9 but are tightly regulated by the balance between inhibitory and stimulatory signals that are conveyed to NK cells by a large panel of membrane receptors upon interaction with potential target cells.10,11
In line with the robust cytotoxic potential of NK cells, their abundance as well as the relative levels of inhibitory and stimulatory NK cell receptors have been attributed prognostic or predictive value in a variety of oncological settings,1,12 including acute myeloid leukemia (AML).13,14 AML is a particularly challenging malignancy for which hematopoietic stem cell transplantation (HSCT) represents the primary therapeutic approach.15 However, HSCT is curative only in a fraction of patients with AML, calling for the implementation of additional therapeutic strategies.16,17 Epigenetic modifiers such as azacytidine and decitabine have been extensively investigated in HSCT-ineligible patients, with rather promising results.18 Conversely, immune checkpoint inhibitors (ICIs) employed as standalone immunotherapeutic interventions or combined with azacytidine failed to demonstrate robust clinical activity so far.19,20 This is at odds not only with the great expectations raised by the successful implementation of ICI-based immunotherapy in the clinical management of numerous malignancies,21–24 but also with experimental evidence suggesting that co-inhibitory receptors suppress anticancer immune responses in preclinical models of AML.25–28
Based on our previous findings in the ovarian setting,29 we set to explore the potential role of co-inhibitory receptors other than programmed cell death 1 (PDCD1, best known as PD-1) and cytotoxic T lymphocyte-associated protein 4 (CTLA4), which are the main targets of currently available ICIs, in patients with AML, with a specific focus on the NK cell compartment. Through flow cytometry and RNA sequencing (RNAseq) analysis, we found that hepatitis A virus cellular receptor 2 (HAVCR2, best known as TIM-3) is particularly expressed by NK cells (as opposed to CTLs) in AML patients, correlating with a functionally licensed NK phenotype, as well as improved cytotoxic and secretory functions associated with superior disease outcome.
Materials and methods
Patients
Seventy-five patients diagnosed with AML and treated at the Institute of Hematology and Blood Transfusion in Prague (Czech Republic) and at the Department of Hemato-oncology of the University Hospital Pilsen (Czech Republic) between December 2015 and March 2018 were enrolled in this study. Informed consent was obtained from all patients in accord with the Declaration of Helsinki, and the study was approved by local ethical committees. The main clinical and biological characteristics of the patients are summarized in Table 1. Peripheral blood samples were obtained before the onset of chemotherapy.
Table 1.
Main clinical and biological characteristic of patients with AML
| Variable | M1+ M2 |
M4+ M5 |
Total |
|---|---|---|---|
| (n = 41) | (n = 34) | (n = 75) | |
| Age at diagnosis | |||
| < 50 years | 16 (39%) | 16 (47%) | 32 (43%) |
| ≥ 50 years | 25 (61%) | 18 (53%) | 43 (57%) |
| Median (years) | 57 | 52.5 | 53 |
| Range (years) | 21–69 | 21–69 | 21–69 |
| Sex | |||
| Male | 18(44%) | 18 (53%) | 36 (48%) |
| Female | 23 (56%) | 16 (47%) | 39(52%) |
| Peripheral-blood white cell count | |||
| < 30.000/mm3 | 28 (68%) | 17 (50%) | 45 (60%) |
| ≥ 30.000/mm3 | 13 (32%) | 17 (50%) | 30 (40%) |
| Median (109 cells/l) | 10.50 | 28.75 | 17.4 |
| Range (109 cells/l) | 1,18–414,21 | 0,9–402,08 | 0,9–414,2 |
| Blasts peripheral blood | |||
| Median (%) | 59 | 15 | 42 |
| Range (%) | 2–95,5 | 0–91 | 0–95,5 |
| De novo AML | 40 (98%) | 28 (82%) | 68 (91%) |
| Secondary AML | 1 (2%) | 6 (18%) | 7 (9%) |
| FAB classification | |||
| M1 | 16 (21%) | ||
| M2 | 25 (33%) | ||
| M4 | 20 (27%) | ||
| M5 | 14 (19%) | ||
| Cytogenetic risk group | |||
| Favorable | 8 (19,5%) | 4 (11%) | 12 (16%) |
| Intermediate | 24 (58,5%) | 14 (41%) | 38 (51%) |
| Unfavorable | 8 (19,5%) | 8 (24%) | 16 (21%) |
| Missing data | 1 (2,5%) | 8 (24%) | 9 (12%) |
| ELN risk | |||
| Favorable | 13 (32%) | 10 (29,5%) | 23 (30,5%) |
| Intermediate | 16 (39%) | 10 (29,5%) | 26 (35%) |
| Unfavorable | 11(27%) | 12 (35%) | 23 (30,5%) |
| Missing data | 1(2%) | 2 (6%) | 3 (4%) |
| Molecular characteristics | |||
| FLT3-ITD | 7 (17%) | 6 (18%) | 13 (17%) |
| FLT3 TKD | 1 (2%) | 2 (6%) | 3 (4%) |
| MLL aberation | 1 (2%) | 1(3%) | 2 (3%) |
| PML/RARα | 0 (0%) | 0 (0%) | 0 (0%) |
| CBFβ/MYH11 | 2 (5%) | 2 (6%) | 4 (5%) |
| NPM1 | 9 (22%) | 12 (35%) | 21 (28%) |
| CEBPA | 6(15%) | 0 (0%) | 6 (8%) |
| HSCT | 20 (49%) | 9 (26,5%) | 29 (39%) |
Cells and reagents
Peripheral blood mononuclear cells (PBMCs) were isolated by Ficoll-Paque PLUS (GE Healthcare) gradient centrifugation. Chronic myelogenous leukemia K562 cells (ATCC) were cultured in IMDM (Gibco) containing 4 mM L-glutamine and 4500 mg/L glucose and further supplemented with 10% fetal bovine serum (FBS, from PAA) and 100 U/mL penicillin plus 100 µg/mL streptomycin (Gibco).
Flow cytometry
PBMCs isolated from AML patients were stained with multiple panels of antibodies conjugated to fluorescent dyes to evaluate the abundance, phenotype and function of multiple immune cell subsets (Supplemental Table 1). Briefly, cells were incubated with primary antibodies or appropriate isotype controls for 20 min at 4°C. Flow cytometry data were acquired on the LSRFortessa analyzer (BD Biosciences) and analyzed with FlowJo v.10.6.2 (Tree Star, Inc.).
Isolation of NK cells and cytotoxicity assays
NK cells were isolated from AML patients before the initiation of induction chemotherapy (n = 8) by negative PBMC selection with the NK cell isolation kit (Miltenyi Biotec). NK cell purity was increased by a two-step procedure based on the exclusion of CD33+ malignant blasts, with the EasySep human CD33 positive selection kit (STEMCELL Technologies), and the exclusion of CD34+ blasts, with the CD34 MicroBead kit (Miltenyi Biotec). Freshly purified NK cells were labeled with the Vybrant DiI cell labeling solution (Invitrogen) and maintained overnight in RPMI 1640 medium (Gibco) containing 10% AB human serum (Invitrogen) and supplemented with 200 U/mL IL-2 (PeproTech) for pre-activation. NK cells from AML patients or healthy donors (HDs) were tested for their capacity to kill NK cell-sensitive K562 cells. NK cells labeled with Vybrant dye DiI were co-cultured with target DiD-labeled K562 cells in RPMI 1640 medium containing 10% AB human serum in 96-well U-bottom plates (Nunc) at effector:target cell ratios (10:1). After 4 h, cells were harvested, washed by PBS and co-stained with Annexin V and DAPI. Viability of target DiD+ K562 cells was determined by flow cytometry.
Degranulation and IFN-γ production
To assess NK cell functions in AML patients, fresh PBMCs were stimulated with 50 ng/mL phorbol 12-myristate 13-acetate (PMA, from Sigma Aldrich) plus 1 μg/mL ionomycin, or with K562 cells at 10:1 PBMC:tumor cell ratio plus overnight incubation with 200 U/mL IL-2 in the presence of anti-CD107a-FITC monoclonal antibody (BioLegend) for 1 h, followed by 3 h incubation with brefeldin A (BioLegend). Cells were then washed in PBS, stained with anti-CD45-PE (EXBIO), anti-CD3-AlexaFluor700 (EXBIO), anti-CD4-ECD (Beckman Coulter), anti-CD8-HV500 (BD Biosciences) and anti-CD56-PerCP-Cy5.5 (BioLegend) antibodies, fixed in fixation/permeabilization buffer (eBioscience), further permeabilized with permeabilization buffer (eBioscience) and intracellularly stained with anti-IFN-γ-PE-Cy7 (eBioscience) and anti-granzyme B-BrilliantViolet421 (BD Biosciences) antibodies.
IFN-γ production after anti-PD-1, anti-TIM-3 and anti-TIGIT cultivation and in vitro stimulation
PBMCs from AML patients were incubated with 10 mg/mL anti-PD-1 (nivolumab, Bristol-Myers-Squibb), anti-TIM-3 (BioLegend) or anti-TIGIT (BioLegend) antibodies for 24 hours in 37°C and 5% CO2, followed by incubation with 50 ng/mL PMA and 1 mg/mL ionomycin for 1 hour plus 3-hour incubation with brefeldin A (BioLegend). Unstimulated cells were used as control. Cells were then washed in PBS, stained with anti-CD45-PE (EXBIO), anti-CD3-AlexaFluor700 (EXBIO) and anti-CD56-PerCP-Cy5.5 monoclonal antibodies (BioLegend), fixed in fixation/permeabilization buffer (eBioscience), further permeabilized with permeabilization buffer (eBioscience) and intracellularly stained with anti-IFN-γ-PE-Cy7 antibodies (eBioscience).
NGS data analysis
Raw FASTQ sequencing files were aligned to human reference genome (build h19) with bowtie2 (version 2.3.2) and tophat2 (version 2.1). Expression levels as raw “counts” were calculated from aligned reads with mapping quality ≥10 using htseq-count (version 0.6.0). Differential gene expression analyses were performed using DESeq2 (version 1.24.0) in R. Heatmaps with hierarchical clustering analysis were assembled for DEGs using the ComplexHeatmap package in R30 based on the Pearson distance and average clustering method. Functional and enrichment analysis of DEGs was performed using the ClusterProfiler31 and the web-based tool REACTOME and METASCAPE.
Statistical analysis
Survival analyses were performed with log-rank tests upon patient stratification into 2 groups based on median cutoff of continuous variables. Univariate and multivariate Cox proportional hazard analysis was performed to assess the association of clinicopathological or immunological parameters with relapse-free survival (RFS) and overall survival (OS). Variables that were intrinsically correlated were not included in multivariate Cox regressions. Fisher’s exact tests, Student’s t tests, and the Wilcoxon and Mann-Whitney tests were used to test for association between variables, p values are reported (considered not significant when >0.05).
Results
Increased NK cell frequency correlates with improved survival in M1 and M2 AML patients
To determine the impact of NK cells in the emergence and progression of AML, peripheral blood samples of 41 AML patients with M1 or M2 disease (according to FAB classification) as well as from 34 AML patients with M4 or M5 disease at diagnosis (Table 1) were analyzed for the frequency of total CD45+CD3−CD56+ NK cells, as well as for the relative abundance of CD45+CD3−CD56dim and CD45+CD3−CD56bright NK cells, which differ for cytolytic and secretory capacity,32 using flow cytometry (Figure 1A). PBMCs from 5 HDs were also tested as control samples. The frequency of circulating CD45+CD3−CD56+ and CD45+CD3−CD56dim NK cells was comparable in M1 + 2 AML patients and HDs, but significantly reduced in patients with M4 + 5 AML (Figure 1B). Conversely, circulating CD45+CD3−CD56bright NK cells were reduced in both M1 + 2 and M4 + 5 AML patient subsets (Figure 1B).
Figure 1.
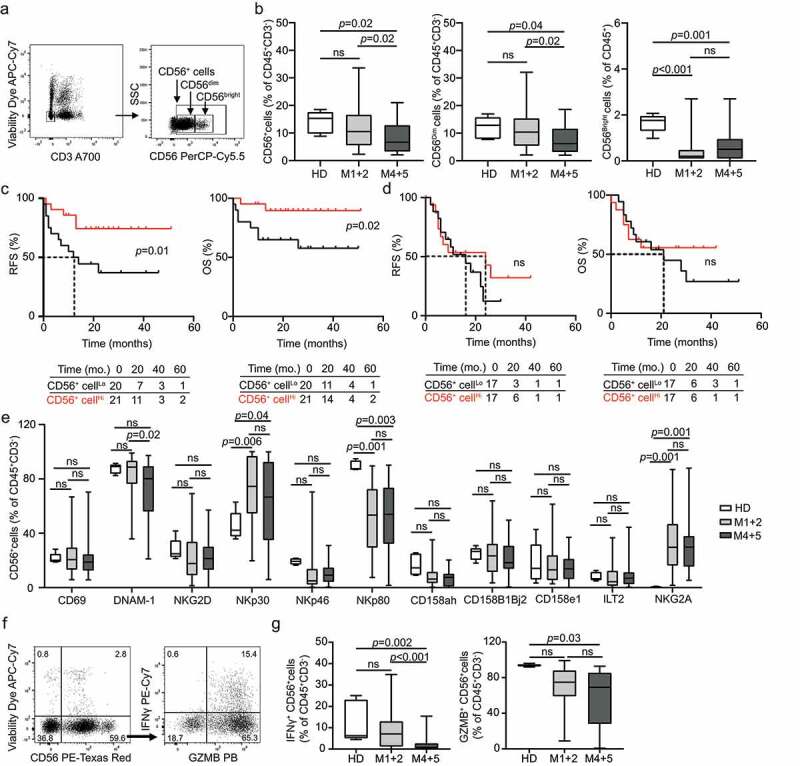
Prognostic impact of circulating NK cells in AML subtypes. (A and B) The percentage of circulating CD45+CD3−CD56+, CD45+CD3−CD56Dim and CD45+CD3−CD56Bright NK cells from healthy donors (HD) (no = 5) or M1 + 2 (no = 41) and M4 + 5 (no = 34) AML patients before the induction chemotherapy determined by flow cytometry. Boxplots: lower quartile, median, upper quartile; whiskers, minimum, maximum; ns, non significant. Relapse-free survival (RFS) and overall survival (OS) of M1 + 2 (C) and M4 + 5 (D) AML patients stratified in two groups based on median percentage of circulating CD45+CD3−CD56+ NK cells. Survival curves were estimated by the Kaplan-Meier method and differences between groups were evaluated using log-rank test. Number of patients at risk is reported. (E) The frequency of CD45+CD3−CD56+ NK cells staining positively for different NK cell receptors (namely CD69, DNAM-1, NKG2D, NKp30, NKp46, NKp80, CD158ah, CD158B1B2j, CD158e1, ILT2 and NKG2A) in HD (no = 5) compare to M1 + 2 (no = 41) and M4 + 5 AML (no = 34) subtypes determined by flow cytometry. ns, non significant. (F and G) The percentage of IFN-γ+ and GZMB+CD45+CD3−CD56+ NK cells after PMA + Ionomycin stimulation in HD or M1 + 2 and M4 + 5 AML patients prior to induction chemotherapy. Patient samples were analyzed by flow cytometry. Box plots: lower quartile, median, upper quartile; whiskers, minimum, maximum; ns, non significant
To assess the prognostic impact of NK cells in our cohort, we investigated RFS and OS upon stratifying patients based on median abundance of circulating CD45+CD3−CD56+ NK cells. In the M1 + 2 disease subtype, patients with higher-than-median CD45+CD3−CD56+ NK cells in the peripheral blood (CD56+ cellsHi) exhibited significantly longer RFS (p = .01) and OS (p = .02) as compared with their CD56+ cellsLo counterparts (Figure 1C). A similar (although sub-significant) trend could be documented upon stratifying M1 + 2 patients according to the median number of CD45+CD3−CD56dim NK cells (Supplemental Fig. 1A). Conversely, the frequency of circulating CD45+CD3−CD56bright NK cells failed to influence RFS and OS in patients with M1 + 2 AML (Supplemental Fig. 1B). Along similar lines, we were unable to identify any prognostic impact for circulating CD45+CD3−CD56+, CD45+CD3−CD56dim and CD45+CD3−CD56bright NK cells in patients with M4 + 5 AML (Figure 1D; Supplemental Fig. 1 C, D). Moreover, univariate Cox proportional hazard analysis failed to confirm the prognostic impact of CD45+CD3−CD56+ NK cells in patients with M1 + 2 AML, potentially reflecting the limited size or follow-up of this prospectively collected patient cohort (Tables 2 and Tables 3).
Table 2.
Univariate Cox proportional hazards analyses
|
Subtype M1 & M2 |
Subtype M4 & M5 |
|||||||
|
OS |
RFS |
OS |
RFS |
|||||
|
Variable |
HR (95% Cl) |
p |
HR (95% Cl) |
p |
HR (95% Cl) |
p |
HR (95% Cl) |
p |
| Age | 1.10 (1-1.2) | 0.01 | 1.00 (0.98-1.1) | 0.23 | 1.01 (0.97-1.06) | 0.06 | 1.00 (0.96-1.00) | 0.87 |
| Sex | 0.91 (0.26-3.23) | 0.88 | 1.23 (0.47-3.19) | 0.67 | 2.34 (0.87-6.23) | 0.09 | 1.06 (0.47-2.38) | 0.89 |
| Blasts in peripheral blood | 1.00 (0.98-1.02) | 0.99 | 1.00 (0.99-1.01) | 0.42 | 1.00 (0.98-1.02) | 0.64 | 1.00 (0.99-1.00) | 0.96 |
| HSCT | 0.24 (0.06-0.94) | 0.04 | 0.67 (0.26-1.74) | 0.41 | 0.63 (0.24-1.64) | 0.34 | 0.73 (0.32-1.66) | 0.45 |
| CD45+CD3−CD56+ cells | 0.92 (0.82-1) | 0.15 | 0.94 (0.86-1.00) | 0.17 | 0.96 (0.88-1.04) | 0.33 | 0.96 (0.89-1.00) | 0.3 |
| CD45+CD3−CD56bright cells | 0.92 (0.42-2.05) | 0.84 | 0.82 (0.41-1.6) | 0.57 | 1.17 (0.59-2.32) | 0.64 | 0.54 (0.23-1.3) | 0.15 |
| CD45+CD3−CD56dim cells | 0.91 (0.80-1.02) | 0.1 | 0.93 (0.86-1.00) | 0.11 | 0.95 (0.87-1.04) | 0.27 | 0.96 (0.89-1.00) | 0.34 |
| CD45+CD3−CD56+CD158a/h+cells | 0.92(0.82-1.03) | 0.15 | 0.99 (0.93-1.1) | 0.87 | 1.03 (0.98-1.07) | 0.25 | 1.00 (0.98-1.1) | 0.35 |
| CD45+CD3−CD56+CD69+cells | 1.01 (0.95-1.1) | 0.74 | 1.00 (0.97-1.00) | 0.6 | 1.01 (0.98-1.04) | 0.52 | 1.00 (0.97-1.03) | 0.64 |
| TIM-3+CD45+CD3−CD56+ cells | 0.99 (0.97-1.00) | 0.48 | 0.99 (0.97-1.00) | 0.17 | 1.00 (0.98-1.02) | 0.71 | 1.03 (0.97-1.09) | 0.79 |
| NK cells/TIM-3 status | ||||||||
| NKLo/TIM-3Lo | 1 | 1 | 1 | 1 | ||||
| NKLo/TIM-3Hi | 0.12 (0.01-0.97) | 0.04 | 0.25 (0.07-0.94) | 0.04 | 1.22 (0.34-4.36) | 0.75 | 1.09 (0.34-3.44) | 0.88 |
| NKHi/TIM-3Lo | 0.12 (0.02-1.01) | 0.05 | 0.28 (0.07-1.02) | 0.05 | 0.84 (0.17-4.17) | 0.82 | 0.53 (0.13-2.16) | 0.37 |
| NKHi/TIM-3Hi | 0.09 (0.01-0.75) | 0.02 | 0.11 (0.02-0.53) | 0.006 | 1.15 (0.37-3.58) | 0.8 | 0.97 (0.35-2.65) | 0.95 |
Table 3.
Multivariate Cox proportional hazards analyses
|
Subtype M1 & M2 |
||||
|
OS |
RFS |
|||
|
Variable |
HR (95% Cl) |
p |
HR (95% Cl) |
p |
| Age | 1.11 (1.00-1.24) | 0.05 | 1.04 (1.00-1.08) | 0.1 |
| Blasts in peripheral blood | 1.03 (0.99-1.07) | 0.11 | 1.01 (0.98-1.03) | 0.54 |
| HSCT | 0.11 (0.02-2.09) | 0.15 | 1.09 (0.22-5.52) | 0.9 |
| TIM-3+CD45+CD3−CD56+ cells | 1.07 (1.01-1.13) | 0.03 | 1.03 (0.97-1.09) | 0.34 |
| NK cells/Tim3 status | ||||
| NKLo/TIM-3Lo | 1 | 1 | ||
| NKLo/TIM-3Hi | 0.01 (0.00-0.4) | 0.02 | 0.06 (0-0.79) | 0.03 |
| NKHi/TIM-3Lo | 0.08 (0.00-2.11) | 0.13 | 0.27 (0.03-2.34) | 0.23 |
| NKHi/TIM-3Hi | 0.00 (0.00-0.4) | 0.02 | 0.03 (0-0.91) | 0.04 |
As NK cell activation is modulated by the balance between inhibitory and stimulatory signals delivered by a variety of cell surface receptors, we next analyzed the levels of the inhibitory receptors killer cell immunoglobulin like receptor, two Ig domains and long cytoplasmic tail 1 (KIR2DL1, best known as CD158a), killer cell immunoglobulin like receptor, two Ig domains and short cytoplasmic tail 1 (KIR2DS1, best known as CD158h), KIR2DL2 (best known as CD158b1), KIR2DL3 (best known as CD158b2), KIR2DS2 (best known as CD158j), killer cell immunoglobulin like receptor, three Ig domains and long cytoplasmic tail 1 (KIR3DL1, best known as CD158e1), leukocyte immunoglobulin like receptor B1 (LILRB1, best known as ILT2) and killer cell lectin like receptor C1 (KLRC1, best known as NKG2A), as well as of the stimulatory receptors CD69, CD226 (best known as DNAM-1), killer cell lectin like receptor K1 (KLRK1, best known as NKG2D), natural cytotoxicity triggering receptor 1 (NCR1, best known as NKp46), NCR3 (best known as NKp30), and killer cell lectin like receptor F1 (KLRF1, best known as NKp80) (Supplemental Fig. 2A). We failed to detect any difference in the percentage of CD45+CD3−CD56+ expressing CD158a, CD158h, CD158b1, CD158b2, CD158j, CD158e1, ILT2, CD69, NKG2D, and NKp46 across HDs and both subsets of AML patients enrolled in our study (Figure 1E). Conversely, the circulating CD45+CD3−CD56+ compartment of AML patients (irrespective of FAB subset) was enriched in cells expressing the inhibitory receptor NKG2A or the stimulatory receptor NKp30, whereas cells expressing the stimulatory receptor NKp80 were reduced (Figure 1E). Moreover, patients with M4 + 5 AML exhibited a decreased abundance of CD45+CD3−CD56+DNAM-1+ cells as compared to both HDs and patients with M1 + 2 AML (Figure 1E). These findings support the contention that NK cells from AML patients are less sensitive to activation. Surprisingly, however, NKp30+ cells were abundant in the circulating CD45+CD3−CD56+ compartment of AML patients (irrespective of FAB subset) (Figure 1E), pointing to a circuitry to circumvent the functional defect potentially imposed by NKG2A upregulation coupled with NKp80 and DNAM-1 downregulation. Moreover, the only two NK cells subsets that were associated with an impact on OS by Kaplan-Meier estimation were CD45+CD3−CD56+CD158a/h+ cells and CD45+CD3−CD56+CD69+, which correlated with superior and inferior disease outcome, respectively, in M1 + 2 and M4 + 5 patients, respectively (Supplemental Fig. 2B,C). These findings, however, could not be confirmed with univariate Cox regression analysis.
To extend these observations, we investigated the impact of disease subtype on NK cell effector functions. Specifically, we evaluated granzyme B (GZMB) and interferon gamma (IFNG, best known as IFN-γ) production upon nonspecific stimulation with PMA and ionomycin, harnessing a common flow cytometry-assisted approach (Figure 1F). We detected a significant decrease in the frequency of NK cells responding to stimulation with IFN-γ synthesis in patients with M4 + 5 AML as compared to HDs, whereas their M1 + 2 counterparts exhibited relatively competent IFN-γ responses (Figure 1G). Similar results were obtained with GZMB synthesis (Figure 1G). The percentage of CD45+CD3−CD56+ cells expressing IFN-γ upon stimulation had no impact on RFS and OS based on Kaplan-Meier survival estimation (Supplemental Fig. 3A, B).
Altogether, these findings point to a quantitative decrease and functional impairment in the circulating NK cell compartment of AML patients, especially in the context of M4 + 5 disease, which potentially explains why the abundance of NK cells has no prognostic impact in this setting (at odds with M1 + 2 disease).
TIM-3 expression levels correlate with a mature NK cell phenotype and improved effector functions
To elucidate the role of clinically targetable co-inhibitory receptors on the phenotype of NK cells from AML patients, peripheral blood samples from our cohort were analyzed for the expression of PD-1, TIM-3 and T cell immunoreceptor with Ig and ITIM domains (TIGIT) by flow cytometry (Supplemental Figure 4). The abundance of CD45+CD3−CD56+ NK cells expressing PD-1, TIM-3 or TIGIT levels was heterogeneous across AML samples and did not differ across AML subtypes (Figure 2A). Furthermore, we were unable to identify statistically significant differences in the frequency of TIM-3+ and TIGIT+ CD45+CD3−CD56+ NK cells between patients with AML and HDs. Conversely, the frequency of PD-1+ NK cells was significantly increased in the peripheral blood of AML patients (irrespective of disease subtype) as compared to HDs (Figure 2A). Importantly, while circulating PD-1+ and TIGIT+ cells in AML patients were significantly enriched in CD45+CD3+CD8+ CTLs over CD45+CD3−CD56+ NK cells, the majority of TIM-3+ cells from the peripheral blood of HDs and AML patients (irrespective of FAB subtype) were CD45+CD3−CD56+ NK cells (Figure 2B). Of note, the CD45+CD3−CD56+ NK cell compartment of AML patients with a higher-than-median percentage of CD45+CD3−CD56+TIM-3+ NK cells (TIM-3+ NK cellsHi) was enriched for cells expressing the stimulatory receptor NKp80, as well as numerous inhibitory receptors from the CD158 family, which are commonly expressed by mature NK cells, as compared the CD45+CD3−CD56+ NK cell compartment from TIM-3+ NK cellsLo patients (Figure 2C). Thus, TIM-3 expression is associated with functionally licensed NK cell phenotype in AML patients.
Figure 2.
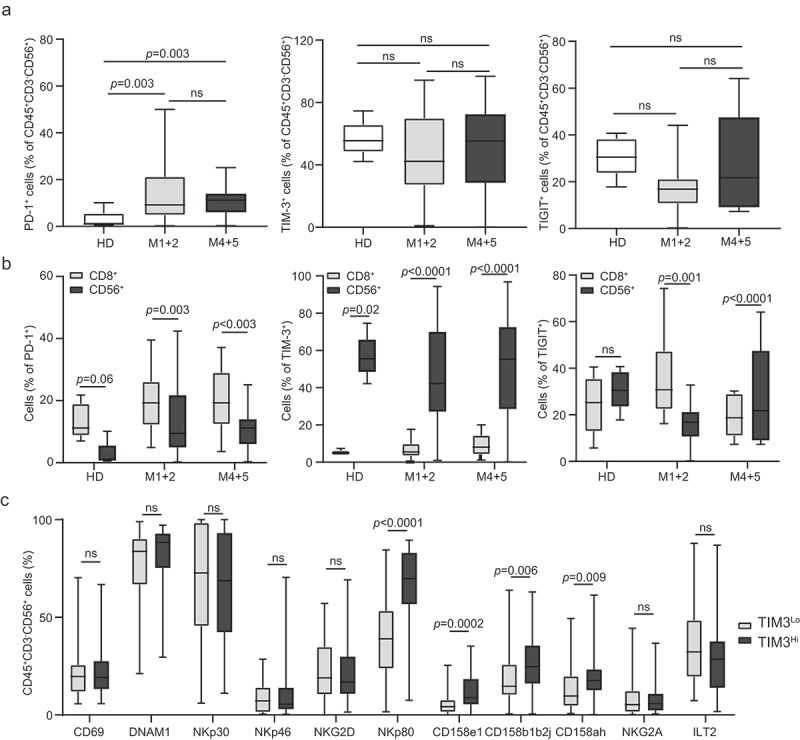
TIM-3 exposure on NK cells correlates with mature and functionally licensed NK cell phenotype. The percentage of circulating PD-1+, TIM-3+ and TIGIT+ CD45+CD3−CD56+ NK cells (A) and CD8+ T cells (B) from healthy donors (HD) (no = 5) or M1 + 2 (no = 41) and M4 + 5 (no = 34) AML patients before the induction chemotherapy determined by flow cytometry. Boxplots: lower quartile, median, upper quartile; whiskers, minimum, maximum; ns, non significant. (C) The frequency of CD69, DNAM-1, NKG2D, NKp30, NKp46, NKp80, CD158ah, CD158b1b2j, CD158e1, ILT2 and NKG2A CD45+CD3−CD56+ NK cells in TIM-3Hi versus TIM-3Lo AML patients determined by flow cytometry. Boxplots: lower quartile, median, upper quartile; whiskers, minimum, maximum; ns, non significant
Driven by the potential implication of TIM-3 in NK cell effector functions, we selected 7 TIM-3+ NK cellsLo patients and compared the transcriptional profile of their PBMCs with that of the PBMCs from 7 TIM-3+ NK cellsHi individuals (Supplemental Table 2). We identified 449 genes that were significantly overrepresented in samples from TIM-3+ NK cellsHi relative to their TIM-3+ NK cellsLo counterparts (Figure 3A; Supplemental Table 3), and functional studies revealed a strong association between such differentially expressed genes (DEGs) and NK-cell mediated cytotoxicity (Figure 3B, Supplemental Figure 5). Moreover, as compared with their TIM-3+ NK cellsLo counterparts, the PBMCs from TIM-3+ NK cellsHi patients exhibited an overrepresentation of gene sets specific for antigen processing and presentation as well as T cell activation and differentiation, as determined by clusterProfiler R package (Supplemental Table 3).
Figure 3.
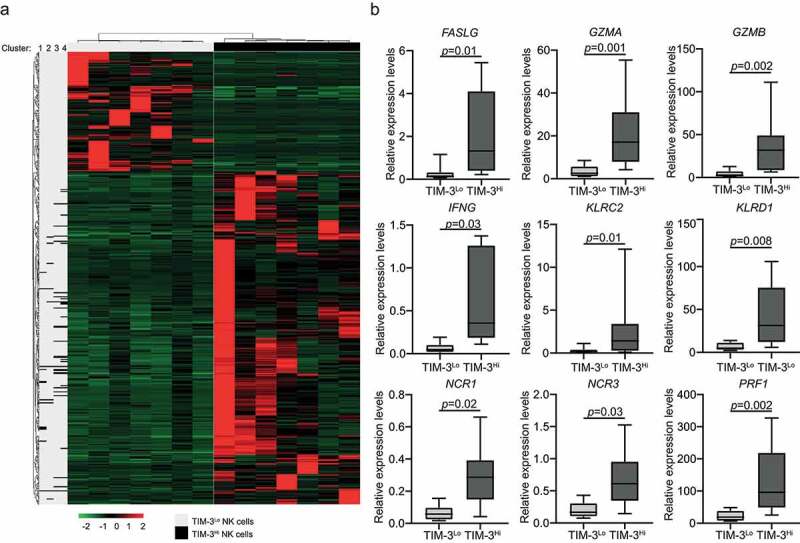
TIM-3 exposure on NK cells correlates with DEGs associated with NK cell mediated cytotoxicity, antigen processing and T cell mediated immunity. (A) Hierarchical clustering of 449 transcripts that were significantly changed in 7 TIM-3Hi patients as compare with their TIM-3Lo counterparts as determined by RNA-sequencing. (B) Relative expression levels of genes associated with NK cell mediated cytotoxicity across paired 7 TIM-3Lo and 7 TIM-3Hi samples, as determined by RNA-seq data. Box plots: lower quartile, median, upper quartile; whiskers, minimum, maximum
Next, we set to investigate the impact of TIM-3 on NK cell effector functions in AML patients. To this aim, we quantified the fraction of CD45+CD3−CD56+ cells expressing IFN-γ and GZMB in TIM-3+ vs. TIM-3− NK cells from 10 M1 + 2 and 10 M4 + 5 AML patients by flow cytometry (Figure 4A). TIM-3+ NK cells exhibited significantly improved effector functions as compared to their TIM-3− counterparts in both samples from AML patients irrespective of FAB subtype (Figure 4B and Figure 4C). Conversely, the expression of PD-1 and TIGIT failed to impact the ability of NK cells from AML patients to synthesize IFN-γ and GZMB in response to stimulation (Figure 4B and Figure 4C). Moreover, NK cells from TIM-3+ NK cellsHi patients had superior cytotoxicity against NK cell-sensitive human chronic myelogenous leukemia K562 cells as compared to their counterparts from TIM-3+ NK cellsLo patients (Figure 4D and Figure 4E). Importantly, at odds with the generally immunosuppressive role of TIM-3, blocking TIM-3 (but not PD-1 or TIGIT) suppressed the ability of NK cells to secrete IFN-γ in response to stimulation (Figure 4F).
Figure 4.
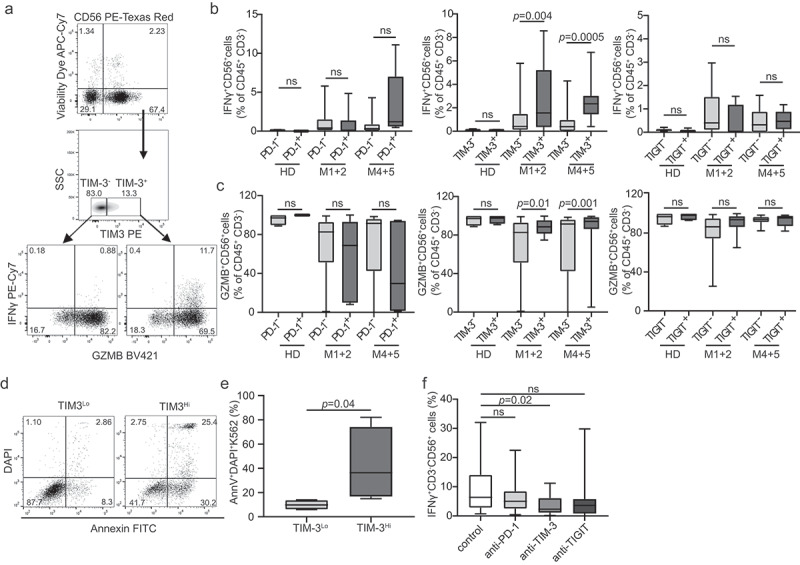
TIM-3 correlates with improved NK cell effector functions in AML patients. (A) The percentage of IFN-γ+ (B) and degranulating (GZMB+) (C) CD45+CD3−CD56+ NK cells among PD-1+/PD-1-, TIM-3+/TIM-3- and TIGIT± NK cells upon PMA + Ionomycin. Patient samples were analyzed by flow cytometry. Box plots: lower quartile, median, upper quartile; whiskers, minimum, maximum; ns, non significant. (D and E) Cytotoxic potential of NK cells isolated from TIM-3Lo (no = 4) and TIM-3Hi (no = 4) AML patients. Purified NK cells were tested for their ability to kill target K562 cell line at effector:target cell ratio 10:1 and the viability of K562 cells was determined by flow cytometry after 4 h. (F) The percentage of IFN-γ+ CD45+CD3−CD56+ NK cells after incubation with anti-PD-1, anti-TIM-3 and anti-TIGIT antibodies, as determined by flow cytometry. Box plots: lower quartile, median, upper quartile; whiskers, minimum, maximum; ns, non significant
These data are consistent with the notion that TIM-3 expression correlates with improved NK cell effector functions in AML patients, and point to an unsuspected stimulatory role for TIM-3 in this setting.
TIM-3 expression by NK cells correlates with improved disease outcome in AML patients
To evaluate the prognostic impact of TIM-3 expression by NK cells, we investigated RFS and OS upon stratifying 41 patients with M1 + 2 AML and 34 patients with M4 + 5 AML based on median percentage of TIM-3+ cells within the circulating CD45+CD3−CD56+ compartment. TIM-3+ NK cellsHi patients with M1 + 2 AML exhibited prolonged OS (p = .02) and RFS (p = .01) as compared with their TIM-3+ NK cellsLo counterparts (Figure 5A and Figure 5B). Similar findings could not be documented in AML patients with M4 + 5 disease (Supplemental Fig. 6A, B). Since both NK cell frequency and the relative abundance of TIM-3+ cells in the circulating CD45+CD3−CD56+ compartment influence disease outcome in patients with M1 + 2 AML, we assessed RFS and OS upon stratifying patients into four subsets (NK cellsHi/TIM-3+ NK cellsHi, NK cellsLo/TIM-3+ NK cellsHi, NK cellsHi/TIM-3+ NK cellsLo and NK cellsLo/TIM-3+ NK cellsLo). In this context, the relative abundance of TIM-3+ cells in the circulating CD45+CD3−CD56+ compartment failed to ameliorate the prognostic value of NK cell frequency in NK cellsHi patients (Figure 5C and Figure 5D). Conversely, NK cellsLo/TIM-3+ NK cellsHi AML patients with M1 + 2 disease had improved OS (p = .01) and RFS (p = .02) as compared with their NK cellsLo/TIM-3+ NK cellsLo counterparts (Figure 5C and Figure 5D). Univariate Cox regression confirmed the positive prognostic impact of TIM-3 expression by CD45+CD3−CD56+ cells in M1 + 2 AML patients (RFS: HR = 0.25, 0.07–0.94; p = .04; OS: HR = 0.12, 0.01–0.97; p = .04; Table 2) and the significance was further corroborated by multivariate Cox regression (Table 3). Consistent with previous results, these findings did not hold true in patients with M4 + 5 AML (Supplemental Fig. 6 C, D).
Figure 5.
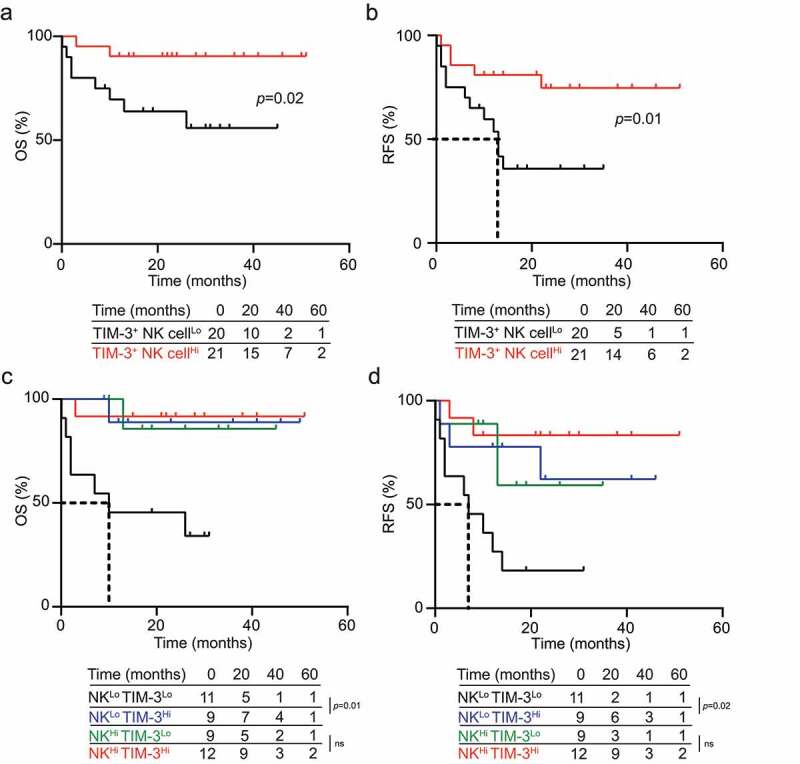
TIM-3 exposure of NK cells correlates with improve disease outcome in AML patients. (A) OS and (B) RFS of 41 M1 + 2 AML patients stratified based on median percentage of circulating TIM-3+CD56+CD3−CD45+ NK cells. (C) OS and (D) RFS of 41 M1 + 2 AML patients upon stratification based on the median percentage of circulating CD56+CD3−CD45+ NK cells and TIM-3+ CD56+CD3−CD45+ NK cells. Survival curves were estimated by the Kaplan-Meier method and differences between groups were evaluated using log-rank test. Number of patients at risk is reported
Taken together, our data indicate that the concomitant assessment of NK cell frequency and relative abundance of TIM-3+ cells in the circulating CD45+CD3−CD56+ compartment conveys robust prognostic information in patients with M1 + 2 AML. Both univariate and multivariate Cox regression analyses confirmed such a prognostic impact in individuals affected by M1 + 2 AML (Tables 2 and Tables 3).
Discussion
Co-inhibitory receptors expressed on T cells play a major role in the establishment of clinically relevant immunosuppression in a variety of human malignancies.8,33,34 Consistent with this notion, ICIs that hinder the binding of the co-inhibitory receptors PD-1 and CTLA4 with their cognate ligands have been successfully implemented in the clinical management of an ever-growing list of human neoplasms.21–24,35 Moreover, experimental evidence indicates that ICIs can enable superior CD8+ CTL functions in preclinical models of AML.25–28 However, ICIs targeting PD-1 and CTLA4 signaling have demonstrated poor clinical activity against AML so far,19,20 pointing to the existence of alternative mechanisms of cancer-driven immunosuppression.
NK cells are key players of anti-AML immune responses13,14,36 and express several co-inhibitory receptors that are commonly considered as prerogative of CTLs, including PD-1,37 TIM-338 and TIGIT.39,40 Inspired by our previous findings pointing to TIM-3 as the main co-inhibitory receptor that suppresses anticancer immunity in patients with ovarian carcinoma,29 we therefore set to investigate the impact of TIM-3 on NK cell functions and disease progression in a prospectively collected cohort of 75 patients with AML. We found that the circulating abundance of NK cells conveys positive prognostic value in individuals with M1 + 2 AML, but not among patients with M4 + 5 disease, correlating with markers of dysfunction that are aggravated in the M4 + 5 disease subtype (Figure 1). Whereas TIM-3 expression on NK cells does not appear to change across HDs and AML patients (irrespective of disease subtype), the circulating TIM-3+ compartment of subjects with AML is highly enriched in NK cells, and patients with higher-than-median TIM-3+ NK cells exhibit various markers of functional competence across multiple immune cell population (Figures 2 and Figure 3). Moreover, TIM-3+ NK cells from AML patients are more responsive to stimulation than their TIM-3− counterparts, a feature that could be partially inhibited with TIM-3, but not PD-1 or TIGIT, blockers. This is at odds with the established immunosuppressive role of TIM-3 in various oncological disorders,41 but in line with previous findings demonstrating that TIM-3 blocking antibodies suppresses the activation of NK cells driven by NKD2D agonism.42 Consistent with a beneficial effect for TIM-3 expression on NK cells, the relative abundance of TIM-3+ cells within the circulating NK compartment improved the prognostic power of circulating NK cell levels in patients with M1 + 2 (but not M4 + 5) AML (Figure 5).
These apparently inconsistent findings might be explained by the fact that the cytoplasmic domain of TIM-3 lacks a definable inhibitory signaling motif, and hence might act as a co-stimulatory receptor, potentially depending on the activation status of other signaling pathways.43 Supporting this possibility, TIM-3+CD8+ T cells have been shown to display superior cytotoxicity in the presence of dendritic cells expressing lectin, galactose binding, soluble 9 (LGALS9) in mouse models of fibrosarcoma.17,44–46 Moreover, TIM-3 appears to be expressed by mature resting CD56Dim NK cells and to undergo robust upregulation in the context of cytokine-driven NK cell activation.47 Moreover, TIM-3 blockade in peripheral NK cells from melanoma patients has been shown to reverse NK cell dysfunction.38 Thus, a functional threshold influencing the ability of TIM-3 to mediate stimulatory vs inhibitory effects in different setting may exist.
Taken together, our data identify an unexpected beneficial function for TIM-3 expression by NK cells for patients with M1 + 2 AML, which could not be identified in patients with M4 + 5 AML. Most likely, this observation reflects the existence of a fully dysfunctional NK cell compartment in the latter (but not in the former) patient subset, as demonstrated by lower circulating NK cell levels, a surface receptor profile polarized toward immunosuppression, and reduced responsiveness to stimuli (Figure 1). Ultimately, these results suggest that blocking TIM-3 with monoclonal antibodies may be detrimental for AML patients, and that the potential benefits of other NK cell-stimulatory interventions, such as the NKG2A-targeting agent monalizumab,48 may be restricted to patients with M1 + 2 disease. As NK cells are considered an attractive option for adoptive cell transfer in patients AML,49 it will be important to identify novel immunomodulatory pathways that can be actioned to improve or predict NK cell activity in these individuals. Additional work is required to elucidate the actual therapeutic and predictive value of TIM-3 in this setting.
Supplementary Material
Acknowledgments
This study was sponsored by Sotio, Prague. LG is supported by a Breakthrough Level 2 grant from the US Department of Defense (DoD), Breast Cancer Research Program (BRCP) (#BC180476P1), by the 2019 Laura Ziskin Prize in Translational Research (#ZP-6177, PI: Formenti) from the Stand Up to Cancer (SU2C), by a Mantle Cell Lymphoma Research Initiative (MCL-RI, PI: Chen-Kiang) grant from the Leukemia and Lymphoma Society (LLS), by a startup grant from the Dept. of Radiation Oncology at Weill Cornell Medicine (New York, US), by a Rapid Response Grant from the Functional Genomics Initiative (New York, US), by industrial collaborations with Lytix (Oslo, Norway) and Phosplatin (New York, US), and by donations from Phosplatin (New York, US), the Luke Heller TECPR2 Foundation (Boston, US) and Sotio a.s. (Prague, Czech Republic).
Author contributions
Concept and design: JR, IT, LG, RS, JF; development of methodology: JR, IT, PH, MH, LK, JP, JF; acquisition of data: JR, IT, PH, CS, MH, LK, JP, MH, MK, DL, ZR, JF; analysis and interpretation of data: JR, IT, PH, CS, MH, LK, JP, MH, MK, DL, ZR, LG, JF; writing, review, and/or revision of the manuscript: JR, IT, PH, JK, LG, RS, JF; study supervision: IT, LG, RS, JF. All authors approve the final version of the manuscript.
Competing interests
LG declares research funding from Lytix and Phosplatin (completed), and speaker and/or advisory honoraria from Boehringer Ingelheim, Astra Zeneca, OmniSEQ, The Longevity Labs, Inzen, the Luke Heller TECPR2 Foundation. All other authors declare no competing interests.
Supplementary material
Supplemental data for this article can be accessed on the publisher’s website.
References
- 1.Huntington ND, Cursons J, Rautela J.. The cancer-natural killer cell immunity cycle. Nat Rev Cancer. 2020;20(8):437–12. doi: 10.1038/s41568-020-0272-z. [DOI] [PubMed] [Google Scholar]
- 2.Buque A, Bloy N, Perez-Lanzon M, Iribarren K, Humeau J, Pol JG, et al. Immunoprophylactic and immunotherapeutic control of hormone receptor-positive breast cancer. Nat Commun. 2020;11(1):3819. doi: 10.1038/s41467-020-17644-0. [DOI] [PMC free article] [PubMed] [Google Scholar]
- 3.Cerwenka A, Lanier LL. Natural killer cell memory in infection, inflammation and cancer. Nat Rev Immunol. 2016;16(2):112–123. doi: 10.1038/nri.2015.9. [DOI] [PubMed] [Google Scholar]
- 4.Lopez-Soto A, Gonzalez S, Smyth MJ, Galluzzi L. Control of Metastasis by NK Cells. Cancer Cell. 2017;32(2):135–154. doi: 10.1016/j.ccell.2017.06.009. [DOI] [PubMed] [Google Scholar]
- 5.Zhang H, Vijayan D, Li XY, Robson SC, Geetha N, Teng MWL, et al. The role of NK cells and CD39 in the immunological control of tumor metastases. Oncoimmunology. 2019;8(6):e1593809. doi: 10.1080/2162402X.2019.1593809. [DOI] [PMC free article] [PubMed] [Google Scholar]
- 6.Minute L, Teijeira A, Sanchez-Paulete AR, Ochoa MC, Alvarez M, Otano I, et al. Cellular cytotoxicity is a form of immunogenic cell death. J Immunother Cancer. 2020;8:1. doi: 10.1136/jitc-2019-000325. [DOI] [PMC free article] [PubMed] [Google Scholar]
- 7.Bottcher JP, Bonavita E, Chakravarty P, Blees H, Cabeza-Cabrerizo M, Sammicheli S, et al. NK cells stimulate recruitment of cDC1 into the tumor microenvironment promoting cancer immune control. Cell. 2018;172(5):1022–1037 e1014. doi: 10.1016/j.cell.2018.01.004. [DOI] [PMC free article] [PubMed] [Google Scholar]
- 8.Rao S, Gharib K, Han A. Cancer Immunosurveillance by T Cells. Int Rev Cell Mol Biol. 2019;342:149–173. [DOI] [PubMed] [Google Scholar]
- 9.Galluzzi L, Chan TA, Kroemer G, Wolchok JD, Lopez-Soto A. The hallmarks of successful anticancer immunotherapy. Sci Transl Med. 2018;10:459. doi: 10.1126/scitranslmed.aat7807. [DOI] [PubMed] [Google Scholar]
- 10.Long EO, Kim HS, Liu D, Peterson ME, Rajagopalan S. Controlling natural killer cell responses: integration of signals for activation and inhibition. Annu Rev Immunol. 2013;31:227–258. doi: 10.1146/annurev-immunol-020711-075005. [DOI] [PMC free article] [PubMed] [Google Scholar]
- 11.Martinet L, Smyth MJ. Balancing natural killer cell activation through paired receptors. Nat Rev Immunol. 2015;15(4):243–254. doi: 10.1038/nri3799. [DOI] [PubMed] [Google Scholar]
- 12.Russick J, Torset C, Hemery E, Cremer I. NK cells in the tumor microenvironment: prognostic and theranostic impact. Recent advances and trends. Semin Immunol. 2020;5:101407. doi: 10.1016/j.smim.2020.101407. [DOI] [PubMed] [Google Scholar]
- 13.Carlsten M, Jaras M. Natural killer cells in myeloid malignancies: immune surveillance, NK cell dysfunction, and pharmacological opportunities to bolster the endogenous NK cells. Front Immunol. 2019;10:2357. doi: 10.3389/fimmu.2019.02357. [DOI] [PMC free article] [PubMed] [Google Scholar]
- 14.Truxova I, Kasikova L, Salek C, Hensler M, Lysak D, Holicek P, et al. Calreticulin exposure on malignant blasts correlates with improved natural killer cell-mediated cytotoxicity in acute myeloid leukemia patients. Haematologica. 2020;105(7):1868–1878. doi: 10.3324/haematol.2019.223933. [DOI] [PMC free article] [PubMed] [Google Scholar]
- 15.Estey EH. Acute myeloid leukemia: 2021 update on risk-stratification and management. Am J Hematol. 2020;95(11):1368–1398. doi: 10.1002/ajh.25975. [DOI] [PubMed] [Google Scholar]
- 16.Petroni G, Buque A, Zitvogel L, Kroemer G, Galluzzi L. Immunomodulation by targeted anticancer agents. Cancer Cell. 2020 Dec 17;S1535-6108(20)30601-2. [DOI] [PubMed] [Google Scholar]
- 17.Sprooten J, Agostinis P, Garg AD. Type I interferons and dendritic cells in cancer immunotherapy. Int Rev Cell Mol Biol. 2019;348:217–262. [DOI] [PubMed] [Google Scholar]
- 18.Cruijsen M, Lubbert M, Wijermans P, Huls G. Clinical results of hypomethylating agents in AML treatment. J Clin Med. 2014;4(1):1–17. doi: 10.3390/jcm4010001. [DOI] [PMC free article] [PubMed] [Google Scholar]
- 19.Daver N, Garcia-Manero G, Basu S, Boddu PC, Alfayez M, Cortes JE, et al. Efficacy, safety, and biomarkers of response to azacitidine and nivolumab in relapsed/refractory acute myeloid leukemia: a nonrandomized, open-label, Phase II study. Cancer Discov. 2019;9(3):370–383. doi: 10.1158/2159-8290.CD-18-0774. [DOI] [PMC free article] [PubMed] [Google Scholar]
- 20.Stahl M, Goldberg AD. Immune checkpoint inhibitors in acute myeloid leukemia: novel combinations and therapeutic targets. Curr Oncol Rep. 2019;21(4):37. doi: 10.1007/s11912-019-0781-7. [DOI] [PubMed] [Google Scholar]
- 21.Galluzzi L, Humeau J, Buque A, Zitvogel L, Kroemer G. Immunostimulation with chemotherapy in the era of immune checkpoint inhibitors. Nat Rev Clin Oncol. 2020Dec;17(12):725-741. [DOI] [PubMed] [Google Scholar]
- 22.Iams WT, Porter J, Horn L. Immunotherapeutic approaches for small-cell lung cancer. Nat Rev Clin Oncol. 2020;17(5):300–312. doi: 10.1038/s41571-019-0316-z. [DOI] [PMC free article] [PubMed] [Google Scholar]
- 23.Luke JJ, Flaherty KT, Ribas A, Long GV. Targeted agents and immunotherapies: optimizing outcomes in melanoma. Nat Rev Clin Oncol. 2017;14(8):463–482. doi: 10.1038/nrclinonc.2017.43. [DOI] [PubMed] [Google Scholar]
- 24.Postow MA, Callahan MK, Wolchok JD. Immune Checkpoint Blockade in Cancer Therapy. J Clin Oncol. 2015;33(17):1974–1982. doi: 10.1200/JCO.2014.59.4358. [DOI] [PMC free article] [PubMed] [Google Scholar]
- 25.Krupka C, Kufer P, Kischel R, Zugmaier G, Lichtenegger FS, Kohnke T, et al. Blockade of the PD-1/PD-L1 axis augments lysis of AML cells by the CD33/CD3 BiTE antibody construct AMG 330: reversing a T-cell-induced immune escape mechanism. Leukemia. 2016;30(2):484–491. doi: 10.1038/leu.2015.214. [DOI] [PubMed] [Google Scholar]
- 26.Zhang L, Gajewski TF, Kline JPD. 1/PD-L1 interactions inhibit antitumor immune responses in a murine acute myeloid leukemia model. Blood. 2009;114(8):1545–1552. doi: 10.1182/blood-2009-03-206672. [DOI] [PMC free article] [PubMed] [Google Scholar]
- 27.Zhou Q, Munger ME, Highfill SL, Tolar J, Weigel BJ, Riddle M, et al. Program death-1 signaling and regulatory T cells collaborate to resist the function of adoptively transferred cytotoxic T lymphocytes in advanced acute myeloid leukemia. Blood. 2010;116(14):2484–2493. doi: 10.1038/nri3405. [DOI] [PMC free article] [PubMed] [Google Scholar]
- 28.Zhou Q, Munger ME, Veenstra RG, Weigel BJ, Hirashima M, Munn DH, et al. Coexpression of Tim-3 and PD-1 identifies a CD8+ T-cell exhaustion phenotype in mice with disseminated acute myelogenous leukemia. Blood. 2011;117(17):4501–4510. doi: 10.1182/blood-2010-10-310425. [DOI] [PMC free article] [PubMed] [Google Scholar]
- 29.Fucikova J, Rakova J, Hensler M, Kasikova L, Belicova L, Hladikova K, et al. TIM-3 dictates functional orientation of the immune infiltrate in ovarian cancer. Clin Cancer Res. 2019;25(15):4820–4831. doi: 10.1158/1078-0432.CCR-18-4175. [DOI] [PubMed] [Google Scholar]
- 30.Gu Z, Eils R, Schlesner M. Complex heatmaps reveal patterns and correlations in multidimensional genomic data. Bioinformatics. 2016;32(18):2847–2849. doi: 10.1093/bioinformatics/btw313. [DOI] [PubMed] [Google Scholar]
- 31.Yu G, Wang LG, Han Y, He QY. clusterProfiler: an R package for comparing biological themes among gene clusters. OMICS. 2012;16(5):284–287. doi: 10.1089/omi.2011.0118. [DOI] [PMC free article] [PubMed] [Google Scholar]
- 32.Vivier E, Tomasello E, Baratin M, Walzer T, Ugolini S. Functions of natural killer cells. Nat Immunol. 2008;9(5):503–510. doi: 10.1038/ni1582. [DOI] [PubMed] [Google Scholar]
- 33.Chen L, Flies DB. Molecular mechanisms of T cell co-stimulation and co-inhibition. Nat Rev Immunol. 2013;13:227–242. [DOI] [PMC free article] [PubMed] [Google Scholar]
- 34.Pardoll DM. The blockade of immune checkpoints in cancer immunotherapy. Nat Rev Cancer. 2012;12(4):252–264. doi: 10.1038/nrc3239. [DOI] [PMC free article] [PubMed] [Google Scholar]
- 35.Han X, Vesely MD. Stimulating T cells against cancer with agonist immunostimulatory monoclonal antibodies. Int Rev Cell Mol Biol. 2019;342:1–25. [DOI] [PMC free article] [PubMed] [Google Scholar]
- 36.Fucikova J, Kline JP, Galluzzi L, Spisek R. Calreticulin arms NK cells against leukemia. Oncoimmunology. 2020;9(1):1671763. doi: 10.1080/2162402X.2019.1671763. [DOI] [PMC free article] [PubMed] [Google Scholar]
- 37.Hsu J, Hodgins JJ, Marathe M, Nicolai CJ, Bourgeois-Daigneault MC, Trevino TN, et al. Contribution of NK cells to immunotherapy mediated by PD-1/PD-L1 blockade. J Clin Invest. 2018;128(10):4654–4668. doi: 10.1172/JCI99317. [DOI] [PMC free article] [PubMed] [Google Scholar]
- 38.Da Silva IP, Gallois A, Jimenez-Baranda S, Khan S, Anderson AC, Kuchroo VK, et al. Reversal of NK-cell exhaustion in advanced melanoma by Tim-3 blockade. Cancer Immunol Res. 2014;2(5):410–422. doi: 10.1158/2326-6066.CIR-13-0171. [DOI] [PMC free article] [PubMed] [Google Scholar]
- 39.Zhang Q, Bi J, Zheng X, Chen Y, Wang H, Wu W, et al. Blockade of the checkpoint receptor TIGIT prevents NK cell exhaustion and elicits potent anti-tumor immunity. Nat Immunol. 2018;19(7):723–732. doi: 10.1038/s41590-018-0132-0. [DOI] [PubMed] [Google Scholar]
- 40.Maas RJ, Hoogstad-van Evert JS, Van Der Meer JM, Mekers V, Rezaeifard S, Korman AJ, et al. TIGIT blockade enhances functionality of peritoneal NK cells with altered expression of DNAM-1/TIGIT/CD96 checkpoint molecules in ovarian cancer. Oncoimmunology. 2020;9(1):1843247. doi: 10.1080/2162402X.2020.1843247. [DOI] [PMC free article] [PubMed] [Google Scholar]
- 41.Acharya N, Sabatos-Peyton C, Anderson AC. Tim-3 finds its place in the cancer immunotherapy landscape. J Immunother Cancer. 2020;8:1. doi: 10.1136/jitc-2020-000911. [DOI] [PMC free article] [PubMed] [Google Scholar]
- 42.Gleason MK, Lenvik TR, McCullar V, Felices M, O’Brien MS, Cooley SA, et al. Tim-3 is an inducible human natural killer cell receptor that enhances interferon gamma production in response to galectin-9. Blood. 2012;119(13):3064–3072. doi: 10.1182/blood-2011-06-360321. [DOI] [PMC free article] [PubMed] [Google Scholar]
- 43.Wolf Y, Anderson AC, Kuchroo VK. TIM3 comes of age as an inhibitory receptor. Nat Rev Immunol. 2020;20(3):173–185. doi: 10.1038/s41577-019-0224-6. [DOI] [PMC free article] [PubMed] [Google Scholar]
- 44.Nagahara K, Arikawa T, Oomizu S, Kontani K, Nobumoto A, Tateno H, et al. Galectin-9 increases Tim-3+ dendritic cells and CD8+ T cells and enhances antitumor immunity via galectin-9-Tim-3 interactions. J Immunol. 2008;181(11):7660–7669. doi: 10.4049/jimmunol.181.11.7660. [DOI] [PMC free article] [PubMed] [Google Scholar]
- 45.Martinek J, Wu TC, Cadena D, Banchereau J, Palucka K. Interplay between dendritic cells and cancer cells. Int Rev Cell Mol Biol. 2019;348:179–215. [DOI] [PubMed] [Google Scholar]
- 46.Balan S, Saxena M, Bhardwaj N. Dendritic cell subsets and locations. Int Rev Cell Mol Biol. 2019;348:1–68. [DOI] [PubMed] [Google Scholar]
- 47.Ndhlovu LC, Lopez-Verges S, Barbour JD, Jones RB, Jha AR, Long BR, et al. Tim-3 marks human natural killer cell maturation and suppresses cell-mediated cytotoxicity. Blood. 2012;119(16):3734–3743. doi: 10.1182/blood-2011-11-392951. [DOI] [PMC free article] [PubMed] [Google Scholar]
- 48.Andre P, Denis C, Soulas C, Bourbon-Caillet C, Lopez J, Arnoux T, et al. Anti-NKG2A mAb Is a checkpoint inhibitor that promotes anti-tumor immunity by unleashing both T and NK cells. Cell. 2018;175(7):1731–1743 e1713. doi: 10.1016/j.cell.2018.10.014. [DOI] [PMC free article] [PubMed] [Google Scholar]
- 49.Nguyen R, Wu H, Pounds S, Inaba H, Ribeiro RC, Cullins D, et al. A phase II clinical trial of adoptive transfer of haploidentical natural killer cells for consolidation therapy of pediatric acute myeloid leukemia. J Immunother Cancer. 2019;7(1):81. doi: 10.1186/s40425-019-0564-6. [DOI] [PMC free article] [PubMed] [Google Scholar]
Associated Data
This section collects any data citations, data availability statements, or supplementary materials included in this article.