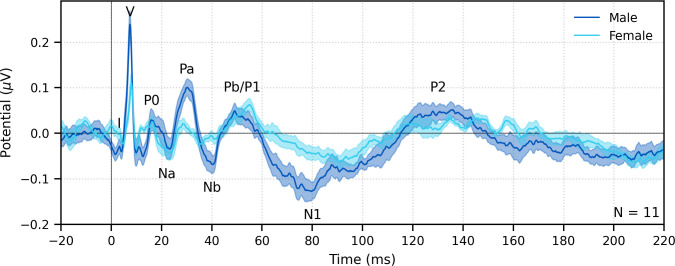
Figure 12. The range of lags can be extended to allow early, middle, and late latency responses to be analyzed from the same recording to broadband peaky speech.
Average waveforms across subjects (areas show ±1 SEM) are shown for responses measured to 32 min of broadband peaky speech narrated by a male (dark blue) and female (light blue). Responses were high-pass filtered at 1 Hz using a first-order Butterworth filter, but different filter parameters can be used to focus on each stage of processing. Canonical waves of the auditory brainstem response, middle latency response, and late latency response are labeled for the male-narrated speech. Due to adaptation, amplitudes of the late potentials are smaller than typically seen with other stimuli that are shorter in duration with longer inter-stimulus intervals than our continuous speech. Waves I and III become more clearly visible by applying a 150 Hz high-pass cutoff.

