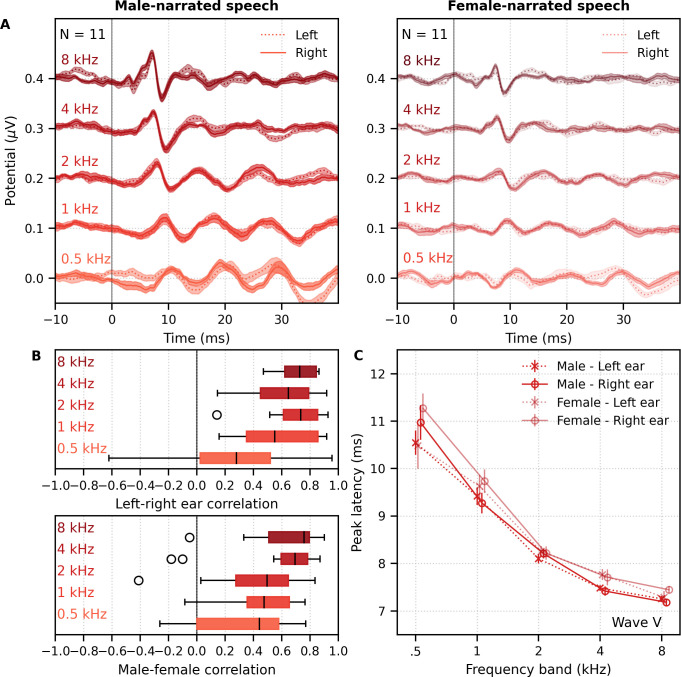
Figure 9. Comparison of responses to ~60 min each of male- and female-narrated dichotic multiband peaky speech with standard audiological frequency bands.
(A) Average frequency-specific waveforms across subjects (areas show ±1 SEM; common component removed) are shown for each band for the left ear (dotted lines) and right ear (solid lines). Responses were high-pass filtered at 30 Hz. (B) Left–right ear correlation coefficients (top, averaged across gender) and male–female correlation coefficients (bottom, averaged across ear) during auditory brainstem response time lags (0–15 ms) for each frequency band. Black lines denote the median. (C) Mean ± SEM wave V latencies for male- (dark red) and female-narrated (light red) speech for the left (dotted line, cross symbol) and right ear (solid line, circle symbol) decreased with increasing frequency band. Lines are given a slight horizontal offset to make the error bars easier to see. Details of the mixed effects model for (C) are provided in Supplementary file 1C.

