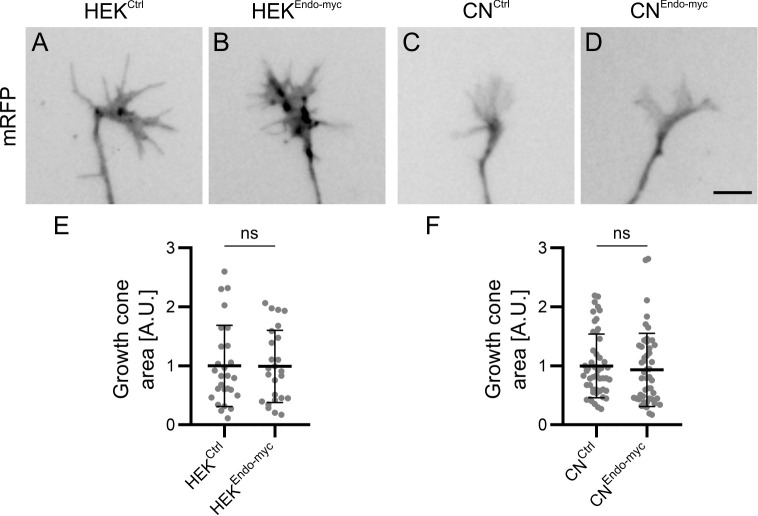
Figure 7. Reduced attachment of growth cones in the presence of higher levels of Endoglycan cannot be explained by changes in growth cone area.
To exclude that the observed differences in adhesive strength between growth cones and HEK cells were influenced by growth cone size, we measured growth cone areas by tracing the edge of the mRFP-positive growth cones from images taken before blasting with a x20 objective. Note that the numbers of growth cones in the growth cone blasting experiment (Figure 6) and the area measurements shown here differ because in two replicates in ~50% of the measured growth cones only videos were taken but no still images. Therefore, these growth cones are not included in the size measurement. The area of each growth cone was measured in imageJ using the tracing tool and the value was normalized to the average growth cone area of the control condition (either HEKCtrl or CNCtrl) for each replicate. A.U., arbitrary unit. Values were 1 ± 0.69 for HEKCtrl (A) versus 0.99 ± 0.61 for HEKEndo-myc (B), and 1 ± 0.54 for CNCtrl (C) versus 0.93 ± 0.62 for CNEndo-myc (D; mean ± standard deviation). Statistical analysis: E, p=0.9694 (ns, unpaired T-test), N (replicates) = 3; n (growth cones)=27 (HEKCtrl) and 25 (HEKEndo-myc); F, p=0.3261 (ns, Mann Whitney test), N (replicates) = 6; n (growth cones)=50 (CNCtrl) and 49 (CNEndo-myc). Bar: 10 µm. Source data and statistics are available in Figure 7—source data 1 spreadsheet.

