Abstract
Nuclear compartmentalization of active and inactive chromatin is thought to occur through microphase separation mediated by interactions between loci of similar type. The nature and dynamics of these interactions are not known. We developed liquid chromatin Hi-C to map the stability of associations between loci. Before fixation and Hi-C, chromosomes are fragmented, which removes strong polymeric constraint, enabling detection of intrinsic locus-locus interaction stabilities. Compartmentalization is stable when fragments are over 10–25 kb. Fragmenting chromatin into pieces smaller than 6 kb leads to gradual loss of genome organization. Lamin-associated domains are most stable, while interactions for speckle and polycomb-associated loci are more dynamic. Cohesin-mediated loops dissolve after fragmentation. Liquid chromatin Hi-C provides a genome-wide view of chromosome interaction dynamics.
INTRODUCTION
Genomic and imaging approaches are producing high-resolution descriptions of the conformation of chromosomes in cell populations, in single cells, across the cell cycle, and during development 1–16. Hi-C interaction maps display a “plaid” pattern, which reflects the segregation of the genome in two major spatial compartments referred to as A and B compartments that correspond to active chromatin and silent chromatin, respectively 1,17. Compartments can be split in 5 subtypes (A1, A2, B1, B2, and B3) that differ in interaction patterns and chromatin state 2. At the scale of tens to hundreds of kb topologically associating domains (TADs) were identified as domains separated by CTCF-bound boundaries. Higher resolution Hi-C 2, ChIA-PET 18, and 4C data 19–21 showed that convergent CTCF sites can engage in looping interactions.
Major questions revolve around the molecular and biophysical processes that drive chromosome conformation. TADs and loops form via loop extrusion carried out by the cohesin complex 22–28. Less is known about the processes that determine compartmentalization. Compartmentalization has been proposed to be the result of phase separation driven by attraction between chromatin domains of similar status 1,29–36. Polymer models simulating such attractions can reproduce the plaid pattern of chromatin interaction maps 29–32.
Hi-C interaction maps do not reveal the biophysical nature of the interactions that drive compartment formation or the dynamic mobility of loci within them. Live cell imaging studies have shown that loci are constrained in their motion and that there is variation in the dynamics and mobility of loci, e.g. euchromatic vs. heterochromatic loci, and loci tethered to the nuclear periphery vs. loci located in the nuclear interior 37–44. However, imaging-based studies are limited in scale and when whole genome dynamics are analyzed microscopically (e.g. 45), positions of specific sequences have not yet been determined. Therefore, new approaches are required to identify and quantify the molecular processes and biophysical forces involved in chromatin interactions and nuclear compartmentalization. Here we describe liquid chromatin Hi-C, a Hi-C variant that quantifies stability of chromatin interactions genome-wide.
RESULTS
Measuring stability of chromatin interactions and nuclear compartmentalization
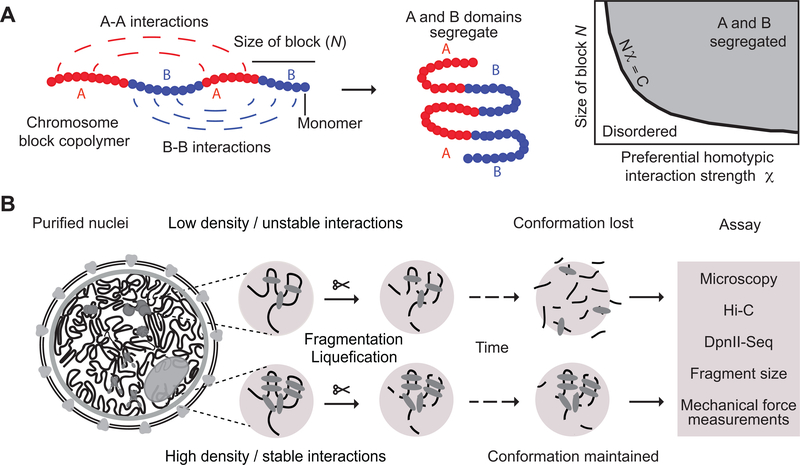
The formation of spatially segregated heterochromatic and euchromatic domains can be viewed as microphase separation of a “block copolymer”. A block copolymer is a polymer that contains a series of alternating blocks (e.g., A-type and B-type, or blocks of euchromatin and heterochromatin), each composed of multiple monomers (A monomers and B monomers; Fig. 1A). When As attract As and Bs attract Bs, such polymer can fold into spatially segregated domains of As and Bs (Fig. 1A; 46–48). Applied to chromatin, microphase separation may underlie the formation of segregated compartments.
Fig. 1: Approach for measuring chromatin interaction stability.
A: Block copolymer composed of a series of alternating A and B blocks, each composed of a number of monomers (left). The polymer can fold into spatially segregated domains of As and Bs (middle). Flory-Huggins polymer theory predicts that spatial segregation will occur when the product of the length of the blocks N (the number of monomers that make up blocks) and their effective preferential homotypic interaction strength χ (difference in the strength of homotypic interactions as compared to heterotypic (A-B) interactions) is larger than a critical value C.
B: Workflow to determine the stability of chromatin interactions genome-wide. DNA: black, varying chromatin features or proteins maintaining DNA conformation: grey ovals.
Whether microphase separation of a block copolymer occurs depends on interaction strengths between monomers as well as the lengths of the blocks of each type (Fig. 1A). Flory-Huggins polymer theory predicts that spatial segregation will occur when the product of the length of the blocks (N, the number of monomers that make up blocks) and their effective preferential homotypic interaction strength (χ, a parameter that represents the difference in the strength of homotypic interactions as compared to heterotypic (A-B) interactions) is larger than a critical value C 46–48; Supplementary Materials). Large blocks of a polymer can spatially segregate even when attractive interactions among monomers are weak, while short blocks will only phase separate when interactions are sufficiently strong. This dependence suggests an experimental approach to quantify the strength of interactions that drive chromosome compartmentalization (Fig. 1A, B). One can start with a compartmentalized state of the genome and fragment the chromosomes by digestion to identify conditions where fragments become so short that their interaction strength is not sufficient to maintain a phase-separated state. As a result, compartments will disassemble over time and chromosomal fragments of different type will become mixed, i.e. chromatin becomes liquid-like. The kinetics of this process can then be assessed by Hi-C at different times after chromatin fragmentation (Fig. 1A, B). Here we describe such a strategy that we call liquid chromatin Hi-C.
Chromosome conformation in isolated nuclei
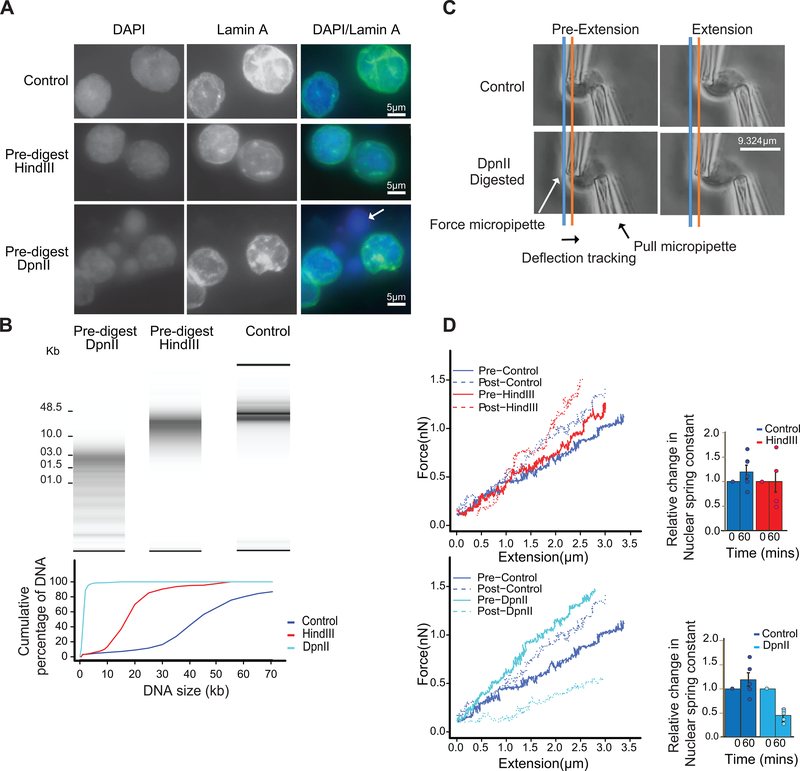
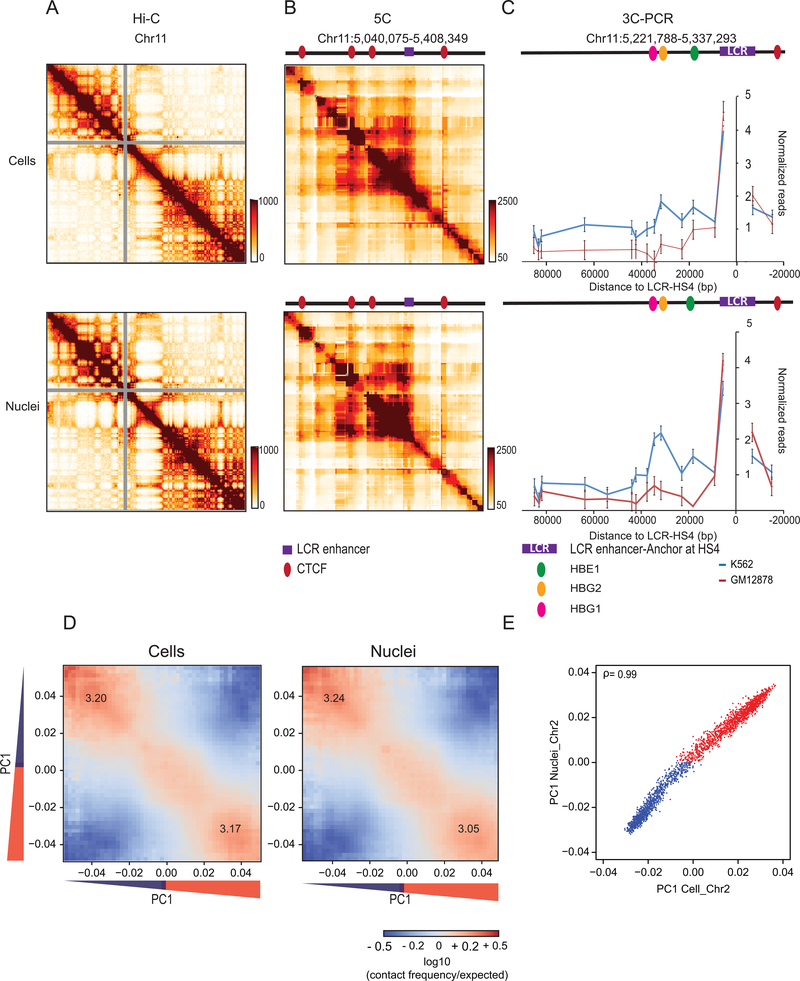
To facilitate fragmentation of chromosomes, we isolated nuclei from K562 cells. We performed four analyses to demonstrate that chromosome conformation in isolated nuclei was the same as that in cells (Methods, Supplementary Methods). First, imaging showed intact Lamin A rings at the nuclear periphery (Fig. 2A). Second, using 3C 49 we detected known looping interactions in the beta-globin locus 50,51 (Extended Data Fig. 1, Supplementary Table 1). Third, 5C analysis 50 of the beta-globin locus showed that known CTCF-mediated interactions were preserved (Extended Data Fig. 1, Supplementary Table 2; 50,52–54. Fourth, Hi-C 1,55 confirmed that chromosome territories, compartments (determined by principle component analysis, with compartments captured by the first principle component (PC1 1,55) and CTCF-CTCF loops were intact (Extended Data Fig. 1, and below).
Fig. 2: Extensive fragmentation of chromatin leads to liquefied chromatin.
A: Nuclear and chromatin morphology before and after chromatin fragmentation. Top row: control nuclei in restriction buffer, middle row nuclei digested for 4 hours with HindIII. Bottom row: nuclei digested for 4 hours with DpnII. Nuclei were stained with DAPI (left column), with antibodies against Lamin A (middle column). The right column shows the overlay of the DAPI and Lamin A stained images. HindIII digestion did not lead to major alteration in nuclear morphology and chromatin appearance, while DpnII digestion led to the appearance of DAPI stained droplets (arrow) exiting the nuclei. Representative images are shown, experiment repeated twice, with dozen nuclei images per experiment.
B: Top: DNA purified from undigested nuclei, and nuclei pre-digested with DpnII and HindIII was run on a Fragment Analyzer. Bottom: cumulative DNA length distributions calculated from the Fragment Analyzer data. Representative data are shown for 1 out of 2 replicates.
C: Micromanipulation of single nuclei. Isolated nuclei were attached to two micropipettes at opposite ends. Nuclei were extended by moving the right micropipette (Extension micropipette) and the force required was calculated from the deflection of the calibrated “force” (left) pipette. Blue and orange lines indicate the position of the force pipette before and after extension for control nuclei. After digestion of nuclei with DpnII (bottom) extension required less force as indicated by the much smaller deflection of the force pipette as compared to control nuclei (see also Supplementary Movies 1 and 2).
D. Force-extension plots (left) for control nuclei before and 60 minutes after incubation in restriction buffer (pre- and post-control), for nuclei before and after digestion with DpnII, and for nuclei before and after HindIII digestion. Right panel: relative change in nuclear spring constants, calculated from the slopes of the force-extension plots shown on the left. Bars indicate standard error of the mean (n = 5 DpnII pre-digested nuclei, and n = 4 HindIII pre-digested nuclei). Bars show the average of all nuclei, dots indicate values obtained with individual nuclei.
Extensive chromatin fragmentation leads to the formation of liquid chromatin
We incubated nuclei for four hours with restriction enzymes that digest chromatin with different frequencies. Digestion with HindIII resulted in fragments that ranged in size from ~10–25 kb (Fig. 2B). A minority of molecules was over 25 kb (<15%). Digestion with DpnII resulted in fragments that ranged in size between ~1 and ~6 kb, with less than 6% of fragments >6 kb (Fig. 2B). Fragmentation of chromatin with HindIII had only minor effects on nuclear morphology (Fig. 2A). In contrast, fragmentation of chromatin with DpnII led to large-scale alteration of nuclear morphology as detected by DAPI staining, and large buds of apparently liquid chromatin (not surrounded by Lamin A) protruding from the nuclear periphery (Fig. 2A, arrow). After spinning down nuclei we detected no DNA in the supernatant, indicating that liquified chromatin remains largely within the nuclear envelope.
We next tested whether different chromatin fragmentation levels had an effect on nuclear stiffness. Nuclei were isolated from K562 cells, attached to two micropipettes at opposite ends, and the nucleus was extended by moving an extension micropipette (Methods, Supplementary Methods). The deflection of a force micropipette provides a measure of the force (Fig. 2C; Supplementary Movies 1, 2). These data provide a force vs. extension plot (Fig. 2D, plots on the left), in which the slope of the line fitted to the data is the nuclear spring constant in nN/μm (Fig. 2D, bar plots on the right). Extension between 0–30% strain measures the chromatin-dominated regime of nuclear force response 56–58. Isolated single nuclei were measured for their native spring constant before treatment. Stiffness can vary somewhat between individual nuclei. We then measured the stiffness of the same nuclei again 60 minutes post-treatment. Nuclei treated with control conditions (only restriction buffer added to the media) showed a slight stiffening of the nucleus (Fig. 2D). Treatment of nuclei with HindIII did not decrease their stiffness. In contrast, DpnII-treated nuclei displayed a significant decrease (~75%) in stiffness, consistent with previous experiments 56. We conclude that chromosome and nuclear organization can tolerate fragmentation to 10–25 kb segments. In contrast, fragmenting the genome to smaller than 6-kb segments results in loss of chromatin-mediated stiffness.
Compartmental segregation requires chromatin fragments larger than 6 kb
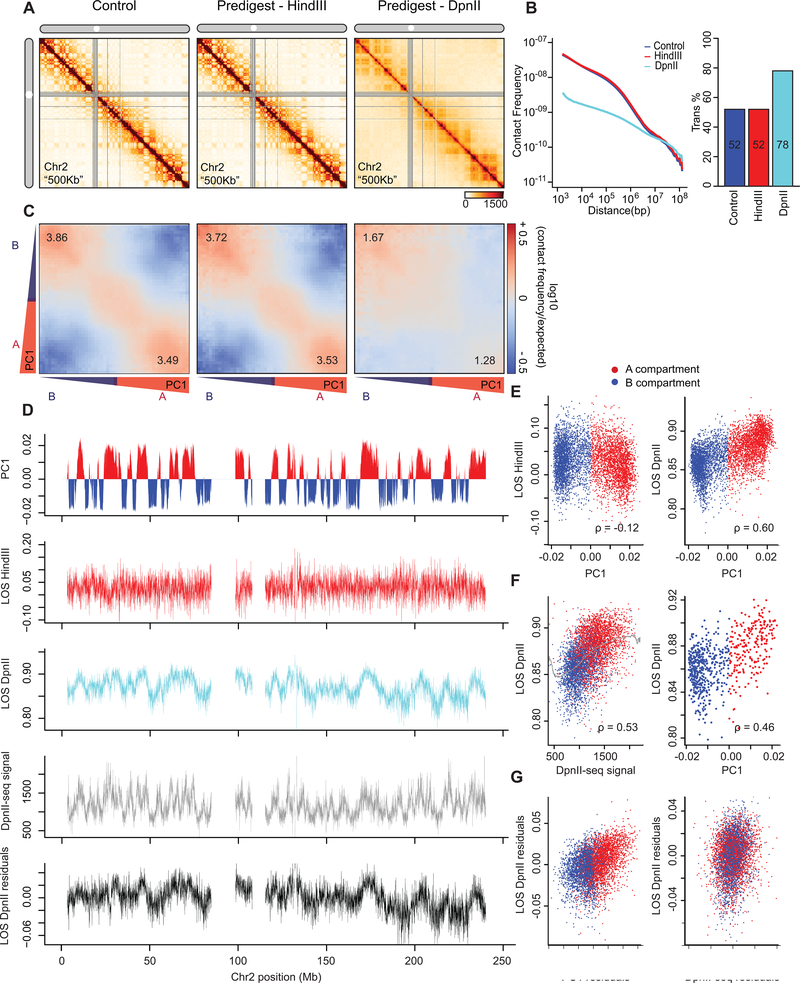
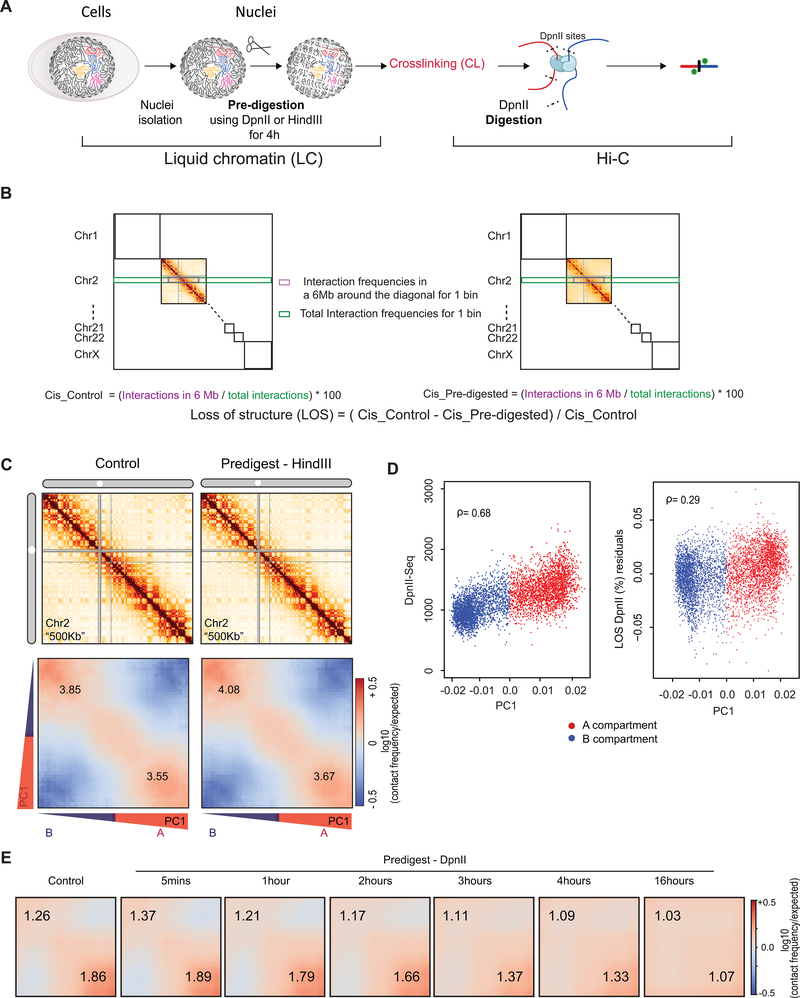
We applied Hi-C before (conventional Hi-C) and after chromatin liquefication (liquid chromatin Hi-C). All Hi-C datasets and mapping statistics are summarized in Supplementary Table 3. Nuclei were digested with HindIII or DpnII for 4 hours followed by formaldehyde fixation and Hi-C (Extended Data Fig. 2A). Liquid chromatin Hi-C interaction maps obtained from nuclei that were pre-digested with HindIII were remarkably similar to those obtained with control nuclei (Fig. 3A). The relationship between interaction frequency and genomic distance and the ratio of intra- vs. inter-chromosomal interactions were largely unaffected (Fig. 3B). Compartment positions (PC1) were unaffected (Spearman ρ = 0.99).
Fig. 3: Hi-C analysis reveals chromosome disassembly upon chromatin liquefication.
(A) Hi-C interaction maps of chromosome 2 binned at 500 kb. Left: interaction map for control nuclei in restriction buffer for 4 hours. Middle: nuclei pre-digested for 4 hours with HindIII prior to Hi-C. Right: nuclei digested for 4 hours with DpnII prior to Hi-C (see Extended Data Fig. 2A).
(B) Left: genome-wide interaction frequency as function of genomic distance for control nuclei (dark blue), nuclei pre-digested with HindIII (red), and nuclei pre-digested with DpnII (cyan). Right: percentage of inter-chromosomal (trans) interaction frequencies.
(C) Compartmentalization saddle plots: average intra-chromosomal interaction frequencies between 40-kb bins, normalized by expected interaction frequency based on genomic distance. Bins are sorted by their PC1 value derived from Hi-C data obtained with control nuclei. In these plots preferential B-B interactions are in the upper left corner, and preferential A-A interactions are in the lower right corner. Numbers in corners represent the strength of AA interactions as compared to AB interaction and BB interactions over BA interactions.
(D) Top plot: Eigenvector 1 values (PC1, 40-kb resolution) across a section of chromosome 2, representing A (red) and B (blue) compartments. Second plot: Loss of pair-wise interactions “LOS” (Methods and Extended Data Fig. 2B) along chromosome 2 at 40-kb resolution for nuclei pre-digested with HindIII. Third plot: LOS for nuclei pre-digested with DpnII. Fourth plot: DpnII-seq signal along chromosome 2 at 40-kb resolution. Bottom plot: LOS-residuals for nuclei pre-digested with DpnII after correction for DpnII signal.
E) Correlation between LOS for nuclei pre-digested with HindIII (left) or DpnII (right) and PC1 (for chromosome 2, Spearman correlation values are indicated).
F) Left: correlation between LOS for nuclei pre-digested with DpnII and DpnII-seq signal (for chromosome 2). Grey line indicates moving average used for residual calculation. Right: correlation between LOS for nuclei pre-digested with DpnII and PC1 for loci cut to the same extent by DpnII (1,000–1,100 DpnII-seq reads/ 40-kb bin; for chromosome 2). Spearman correlation values are indicated.
G) Left: partial correlation between residuals of LOS for nuclei pre-digested with DpnII and residuals of PC1 after correcting for correlations between LOS and DpnII-seq and PC1 and DpnII-seq signal. Right: partial correlation between residuals of LOS for nuclei pre-digested with DpnII and residuals of DpnII-seq signal after correcting for correlations between LOS and PC1 and DpnII-seq signal and PC1. Spearman correlation values are indicated.
Chromosome compartment strength can be quantified by plotting interaction frequencies between pairs of 40-kb loci arranged by their PC1 to obtain compartmentalization saddle plots (Fig. 3C). In nuclei pre-digested with HindIII, the strength of preferential A-A and B-B interactions (the ratio of the frequency of A-A and B-B interactions divided by the frequency of A-B interactions) was similar to untreated nuclei (Fig. 3C; see Extended Data Fig. 2C for a replicate).
Extensive changes were observed when nuclei were pre-digested for 4 hours with DpnII (Fig. 3A) followed by formaldehyde fixation and Hi-C. We observed a loss of short range (<10 Mb) intra-chromosomal interactions, and a gain of longer range (>10 Mb) interactions and inter-chromosomal interactions (Fig. 3B). The gain in inter-chromosomal interactions appeared to be the result of random mixing of As and Bs from different chromosomes as the preference for interchromosomal A-A and B-B interactions decreased (Extended Data Fig. 2E). Moreover, compartment strength in cis was greatly reduced with a greater relative reduction evident in the A compartment (Fig. 3C).
Quantification of chromosome conformation dissolution
Loss of chromosome conformation and dissolution of chromosomal compartments will result in random mixing of previously spatially separated loci both in cis and in trans. In Hi-C this will be apparent by a redistribution of contacts from short-range interactions towards longer range and inter-chromosomal interactions. We developed a metric that represents the percentage change in short-range intra-chromosomal interactions (up to 6 Mb), and concomitant increase in long-range and interchromosomal interactions after fragmentation relative to control nuclei, which we call “loss of structure” (LOS) (Extended Data Fig. 2B).
We first calculated LOS after 4 hours for chromatin fragmented with HindIII. We observe that in general short-range interactions are only somewhat reduced (less than 5%; Fig. 3B). When LOS is plotted along chromosomes (Fig. 3D), we observed that LOS was very weakly negatively correlated with PC1 (Fig. 3D, 3E left panel).
We performed the same analysis for nuclei pre-digested with DpnII for 4 hours. We find fragmenting chromatin to <6-kb fragments leads to extensive loss of chromatin interactions with LOS generally >80%. LOS varies along chromosomes and is strongly positively correlated with PC1, with loci in the A compartment displaying the largest loss (Fig. 3D, 3E).
Corrections for differential fragmentation
One explanation for the greater effect of fragmentation on chromatin interactions in the A compartment could be that DpnII cuts more frequently in the A compartment producing smaller fragments. We performed two experiments to assess differential fragmentation. First, we determined the cutting frequency of DpnII in isolated nuclei across the genome by sequencing the ends of the DNA fragments (DpnII-seq; Extended Data Fig. 3, Methods, Supplementary Methods). Second, we directly determined the average fragment size along the genome by purifying and sequencing DNA of different sizes after pre-digestion with DpnII, and using the data to calculate for each 40-kb bin the average fragment size (Methods). The average fragment size for most bins ranged from 2.7 to 3.7 kb and was on average slightly smaller for A compartments compared to B compartments (3.1 and 3.2 kb, respectively). Cutting frequency and average fragment size are both correlated with PC1 and with LOS (Fig. 3D, F, left panel; Extended Data Figs. 2D, 4).
Next, we corrected LOS for the differential efficiency of DpnII digestion by calculating the partial correlation between LOS and PC1 after correcting for the correlations of PC1 and LOS with DpnII digestion frequency (Methods). We find that the residuals of PC1 and LOS remain correlated (Spearman ρ = 0.38 for chromosome 2; Fig. 3G). Similarly, when we corrected LOS for differences in average fragment size we find that the residuals of LOS remain highly correlated with residuals of PC1 (Spearman ρ = 0.83 for chromosome 2; Extended Data Fig. 4). To illustrate the correlation between LOS and PC1 independent of fragmentation level directly we selected a set of loci along chromosome 2 that are all cut to the same extent (1,000–1,100 reads in the DpnII-seq dataset). When we plot LOS vs. PC1 for this set we find a strong correlation (Fig. 3F right panel, Spearman ρ = 0.46). Finally, we repeated the entire liquid chromatin Hi-C procedure using a different restriction enzyme, FatI, which has a different pattern of digestion across the genome as compared to DpnII but produces fragments that are similarly small (Extended Data Fig. 5). We calculated LOS and corrected for differential FatI digestion along the genome using FatI-seq, exactly as above for DpnII. We again observe a high correlation between residuals of LOS and PC1 (Spearman ρ = 0.64 for chromosome 2, Extended Data Fig. 5). We conclude that LOS is correlated with compartment status, and that this result is robust for different enzymes and different methods for correcting for digestion efficiency.
Dissociation kinetics of chromatin interactions and compartments
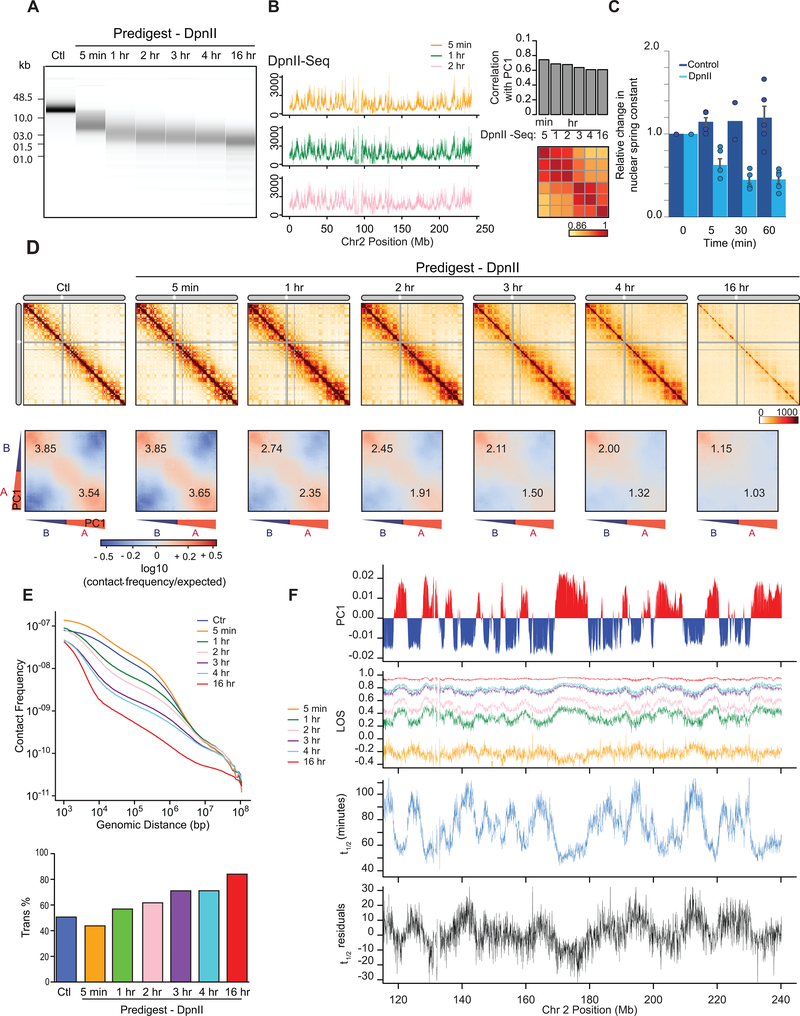
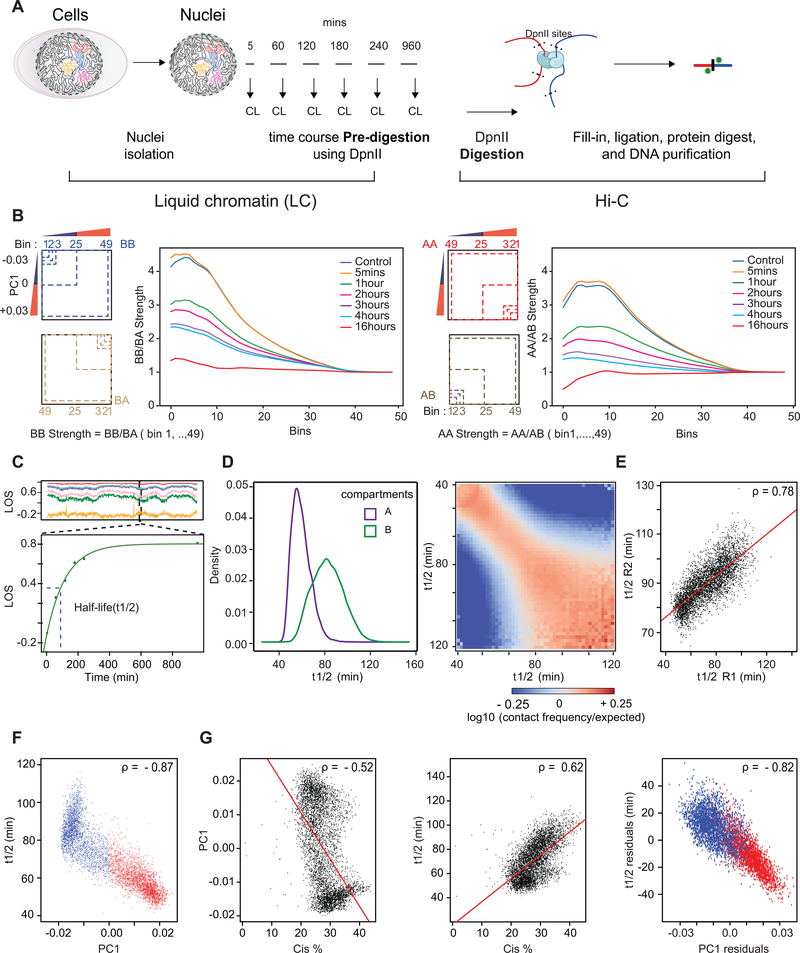
The loss of conformation after DpnII pre-digestion allowed us to measure the dissociation kinetics of compartments and stability of chromatin interactions. We first determined the kinetics of chromatin fragmentation (Extended Data Figs. 6A, 7A). We digested nuclei with DpnII for 5 minutes up to 16 hours. After 5 minutes the size range of fragments was between 3 and 15 kb (80% of fragments; Fig. 4A). After one hour 80% of DNA fragments were smaller than 7 kb and after 16 hours 85% of fragments were smaller than 3.5 kb. We sequenced DNA ends to determine the distribution of DpnII cuts across the genome (Fig. 4B). At all timepoints the number of DpnII cuts per 40-kb bin was correlated with PC1 (Fig. 4B), but the pattern did not change over time (Fig. 4B, correlation matrix; Extended Data Fig. 6A).
Fig. 4: Kinetics of chromatin fragmentation and chromatin dissolution.
(A) DNA purified from undigested nuclei, and nuclei pre-digested with DpnII for different time points were run on a Fragment Analyzer. Representative data are shown for 1 out of 2 replicates.
(B) Left: DpnII-seq signals along chromosome 2 binned at 40-kb resolution after digestion for 5 minutes, 1 hour and 2 hours. Right: correlation between DpnII-seq signals and PC1 and between DpnII-seq signals at different time points.
(C) Relative change in nuclear spring constant (nN/μm) after DpnII fragmentation at different time points. Spring constant is significantly decreased after 5 minutes and at background level by 1 hour (P = 0.002; two-tailed t-test; n = 4 or 5 nuclei except for control nuclei at t = 30 minutes where n = 2; each measured three times; error bars represent standard error of the mean). Bars show the average of all nuclei, dots indicate values obtained with individual nuclei.
(D) Top row: Hi-C interaction maps of chromosome 2 binned at 500 kb. Control: nuclei in restriction buffer for 4 hours. Pre-digest DpnII: nuclei were pre-digested with DpnII for 5 minutes up to 16 hours. (Extended Data Fig. 7A).
Bottom row: compartmentalization saddle plots for the corresponding conditions. Numbers indicate strength of A-A and B-B interactions for intra-chromosomal interactions.
(E) Top: genome-wide interaction frequency as function of genomic distance for Hi-C data shown in panel (D). Bottom: percentage of inter-chromosomal (trans) interactions genome-wide for control nuclei and for nuclei pre-digested with DpnII for up to 16 hours.
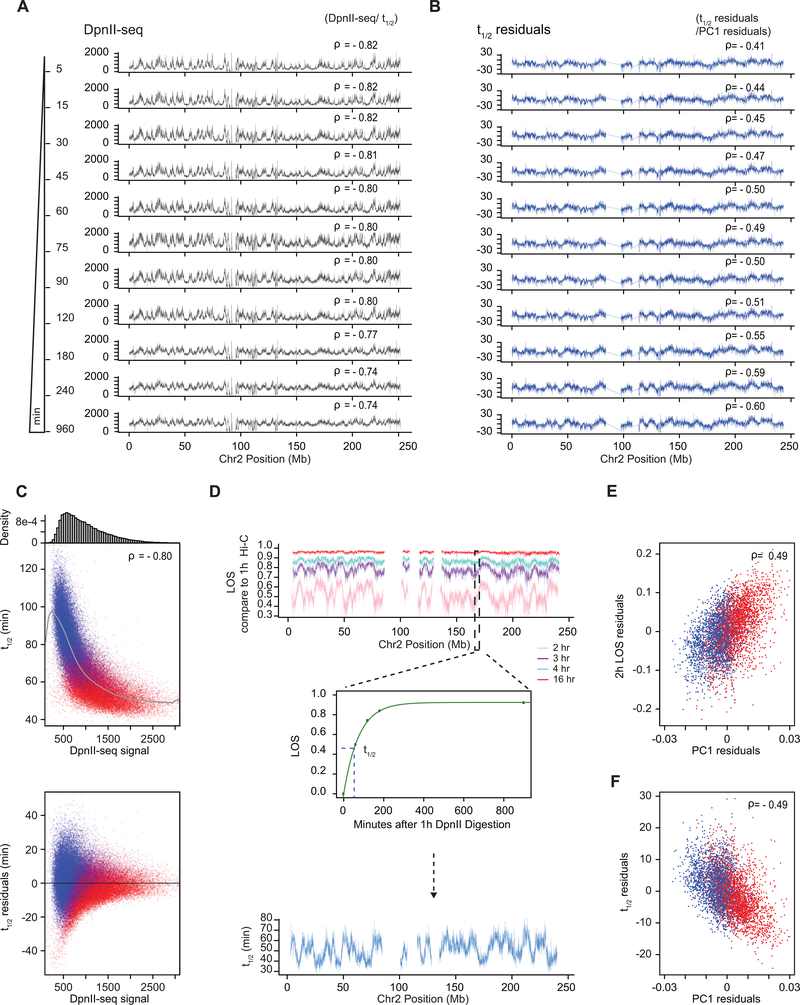
(F) Top: PC1 along a section of 120 Mb of chromosome 2. Second plot: LOS along chromosome 2 at 40-kb resolution for all time points (Extended Data Fig. 2B). Third plot: half-life (t1/2) values derived from the exponential fit of the six time-points for every 40-kb bin (Extended Data Fig. 7C). Bottom plot: residuals of t1/2 after correcting for correlations between t1/2 and DpnII-seq (DpnII-seq data for t = 1 hour).
Micromanipulation was again used to measure the nuclear spring constant corresponding to nuclear stiffness. Nuclei displayed a significant loss in stiffness within 5 minutes. Loss of stiffness leveled off at 30 minutes of digestion and showed a 60% decrease in nuclear rigidity, similar to previous experiments in other cell types (56, Fig. 4C). Combined, these analyses show that the bulk of DNA fragmentation and chromatin liquefication occurs within the first hour.
Next, we performed liquid chromatin Hi-C where nuclei were pre-digested with DpnII for 5 minutes up to 16 hours (Extended Data Fig. 7A). After 5 minutes of pre-digestion chromosome conformation and compartmentalization are intact, even though chromatin was fragmented to 3–15 kb segments before fixation and nuclear stiffness was significantly reduced (Fig. 4C, D). The percentage of intra-chromosomal interactions especially for loci separated by <1 Mb was increased (Fig. 4E).
At subsequent time points, when most chromatin fragments are <7 kb long we observe increased loss of intra-chromosomal interactions and concomitant increased inter-chromosomal interactions genome-wide (Fig. 4D, E). Compartmentalization is progressively lost (Fig. 4D lower row of heatmaps, Extended Data Fig. 7B). A-A interactions disappear faster than B-B interactions. After 16 hours, only a low level of preferential B-B interaction remains.
Quantification of the half-life of chromosome conformation across the genome
To quantify the kinetics of loss of chromosome conformation and compartmentalization, we calculated LOS genome-wide for each time point (Fig. 4F). At t = 5 minutes LOS is generally negative indicating a ~25% gain of intra-chromosomal interactions between loci separated by <6 Mb, consistent with the initial increase in overall intra-chromosomal interactions described above (Fig. 4E). LOS is inversely correlated with PC1, indicating that loci located within A compartments gain more intra-chromosomal interactions than loci located within B compartments (Spearman ρ = −0.53 for chromosome 2, Spearman ρ = −0.49 genome-wide). A “block copolymer” model predicts that partial DNA digestion can lead to a strengthening of compartmentalization by removing covalent linkages between A and B blocks, as long as the fragments are still large enough so that attractive forces between them are sufficient for phase segregation (see Supplementary Note). At subsequent time points, LOS is increasingly positive as intra-chromosomal interactions are progressively lost and inter-chromosomal interactions are gained. LOS is the highest for loci located in the A compartment. At t = 16 hours, LOS is generally as high as 90%, intra-chromosomal interactions are low (<20% of total), and only preferential B-B interactions are still observed in the Hi-C interaction map (Fig. 4D). Very similar results were obtained with an independent replicate time course experiment (see below).
Next we determined for each 40-kb locus at which time LOS has reached 50% of its maximal value at t = 16 hours. We refer to this time as the half-life, t1/2 (minutes), of chromatin interactions at each locus (Fig. 4F; Extended Data Fig. 7C). Examining t1/2 along chromosomes, we observe a strong inverse correlation with PC1 (Spearman ρ = −0.87; Extended Data Fig. 7F): interactions in the A compartment dissolve relatively fast (t1/2 = 40–80 minutes) while interactions in the B compartment dissolve slower (t1/2 = 60–120 minutes; Extended Data Fig. 7D). We also calculated t1/2 genome-wide for the second independent time course experiment and find a strong correlation between t1/2 calculated from the two datasets (Spearman ρ = 0.78 for chromosome 2; Spearman ρ = 0.76 genome-wide; Extended Data Fig. 7E). The value of t1/2 is proportional to a dissociation rate constant and thus independent of the initial level of intra-chromosomal interactions for a given locus. t1/2 remains highly correlated with PC1 after correcting for the initial level of intra-chromosomal (<6 Mb) interactions for each bin (Spearman ρ = −0.82, Extended Data Fig. 7F, G).
Similar to LOS, t1/2 is correlated with DpnII digestion frequency at all timepoints (Extended Data Figs. 4F, 6A). We calculated the partial correlation between t1/2 and PC1 after correcting for correlations between PC1 and t1/2 with DpnII cutting frequency. We find that t1/2 and PC1 remain strongly correlated (Fig. 4F), regardless of which DpnII fragmentation dataset (genome-wide Spearman ρ ranging from −0.41 to −0.60, t = 5 min up to t = 16 hours) was used for the calculation of the partial correlation (Extended Data Fig. 6A, B). Although loci in the A compartment are often cut more frequently than loci in the B compartment, when comparing loci cut with similar frequency, loci in the A compartments had shorter half-lives (Extended Data Fig. 6C). Similar results were obtained when t1/2 was corrected for average fragment size for each bin (Extended Data Fig. 4I, Spearman ρ = −0.85 for chromosome 2, Spearman ρ = −0.76 genome-wide).
We considered whether we could have overestimated the t1/2 for the B compartment because fragmentation of these loci could be slower than for loci in the A compartment. We reasoned that because after 1 hour DpnII digestion is largely complete, calculation of LOS using the Hi-C data at t = 1 hour as starting condition would provide an estimate of dissolution kinetics starting at a timepoint when A and B compartments are both extensively fragmented. We find that LOS, and t1/2 calculated this way are still strongly correlated with PC1, and this correlation remains strong after correcting for fragmentation level (Extended Data Fig. 6D, E, F).
Dissociation kinetics of chromatin interactions at different sub-nuclear structures
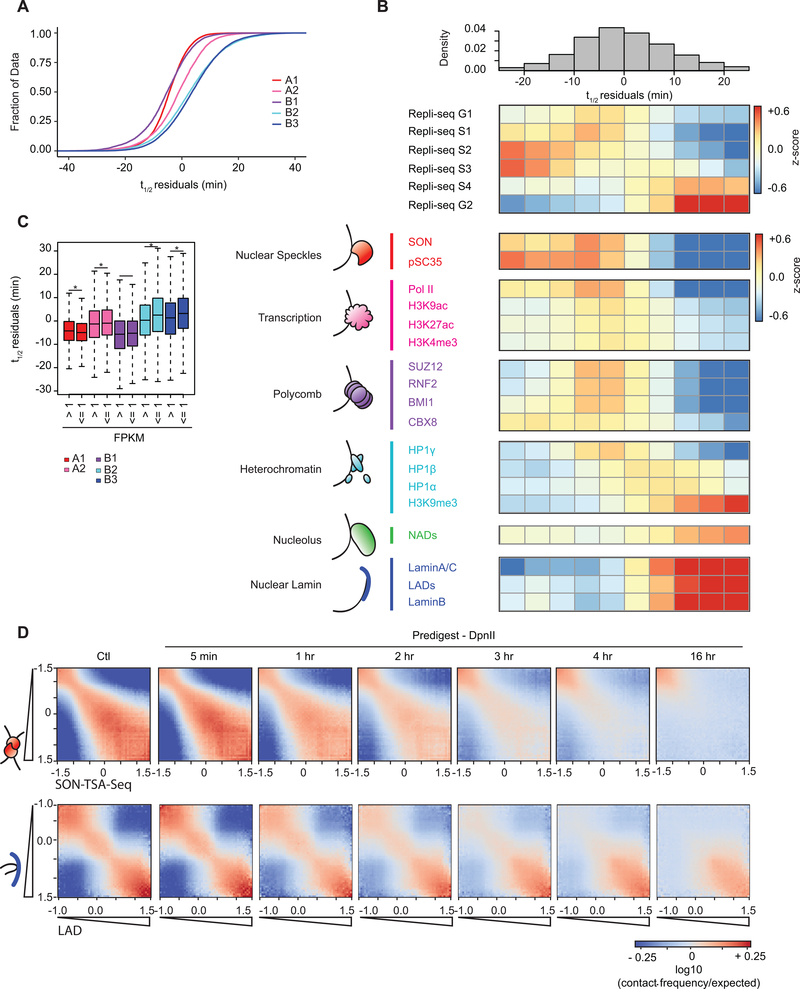
The A1 sub-compartment is enriched in active histone modifications and found near nuclear speckles 3. B2 and B3 are located near the lamina and the nucleolus (B2) 2,3,59. B1 is enriched in H3K27me3 and polycomb proteins. To relate sub-compartment to chromatin dissociation rates, we compared the residuals of t1/2 for loci located in the 5 sub-compartments defined for K562 cells (60; Fig. 5A). We find that residual t1/2 varies between sub-compartments: t1/2 (A1) ~ t1/2 (B1) < t1/2 (A2) < t1/2 (B2) ~ t1/2 (B3).
Fig. 5: Dissociation kinetics of chromatin interactions at different sub-nuclear structures.
(A) Cumulative distributions of residuals of t1/2 (in minutes) for each of the five annotated sub-compartments.
(B) Top: the genome was split into 10 bins, where each bin corresponds to sets of loci that share the same t1/2 residual interval. Middle: For each t1/2 residual interval a heatmap of mean z-score signal of Repli-Seq data in different phases of the cell cycle G1, S1–4, G2. Bottom: For each t1/2 residual interval a heatmap of mean z-score signal enrichment was quantified for various markers of sub-nuclear structures (See Methods).
(C) (C) Boxplot of t1/2 residuals for bins with expressed genes (mean FPKM > 1) in sub-compartments: A1 (n = 7,045), A2 (n = 4,154), B1 (n = 1,565), B2 (n = 805), and B3 (n = 1,030) and bins with low or no expression (mean FPKM ≤1) in sub-compartments A1 (n = 3,486), A2 (n = 2,800), B1 (n = 4,726), B2 (n = 5,803), and B3 (n = 8,717). Significant difference in t1/2 residuals between expressed and non-expressed bins per subcompartment determined by two-sample two tailed t-test (A1: P = 1.04 × 10⁻⁸, t = 5.731, d.f. = 6,885.4, 95% CI = 0.57, 1.17; A2: P = 0.002, t = −3.090, d.f. = 6,072.8, 95% CI = −1.12, −0.25; B1: P = 0.493, t = −0.685, d.f. = 2,528.7, 95% CI = −0.73, 0.35; B2: P = 6.05 × 10⁻⁸, t = −5.457, d.f. = 1,051.8, 95% CI = −3.02, −1.42; B3: P = 3.29 × 10⁻¹⁰, t = −6.335, d.f. = 1,270.2, 95% CI = −2.84, −1.50). An asterisk denotes P < 0.003. Boxplot middle line is the median, the lower and upper edges of the box are the first and third quartiles, the whiskers extend to interquartile range (IQR) × 1.5 from the box.
(D) Homotypic interaction saddle plots for loci ranked by their association with speckles (as detected by SON-TSA-seq, top 3) and by their association with the nuclear lamina. Preferential pair-wise interactions between loci associated with the lamina can still be observed after several hours, whereas preferential pair-wise interactions between loci associated with speckles are lost more quickly.
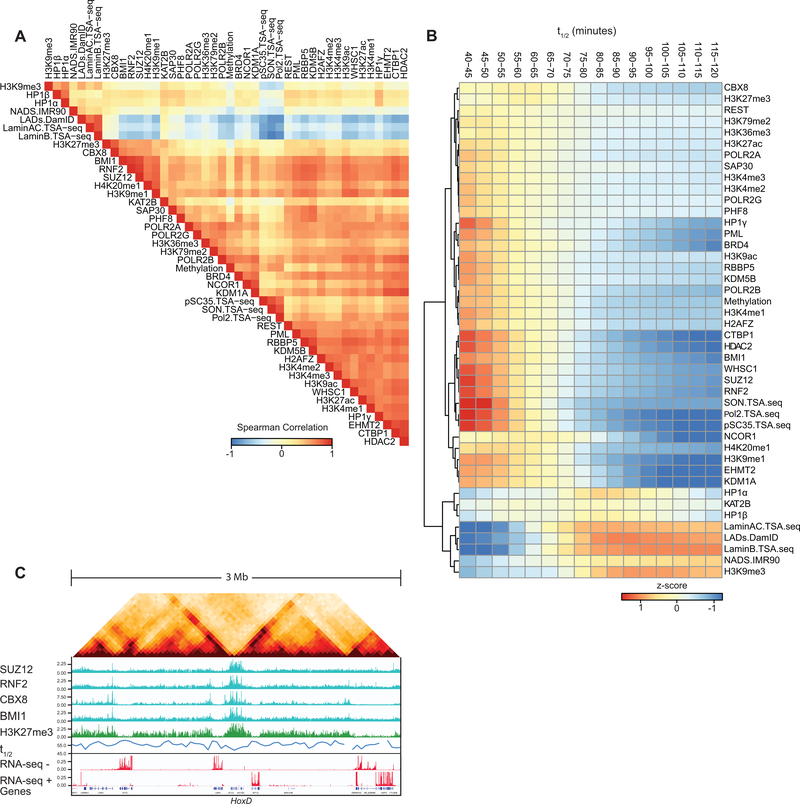
We split t1/2 residuals into 10 intervals and then explored the enrichment for varying chromatin features for each t1/2 residual interval (Fig. 5B; Supplementary Table 4). Chromatin interactions for early replicating domains had short half-lives, while interactions for loci in later replicating domains were more stable (Fig. 5B). Loci near the speckle-associated proteins pSC35 or SON are engaged in the most unstable interactions. Similarly, transcriptionally active loci, containing H3K4me3 and RNA PolII, were also involved in relatively unstable chromatin interactions.
Interactions for loci bound by polycomb complexes were as unstable as active speckle associated loci (Fig. 5B, Extended Data Fig. 8B). Half-lives differed for loci bound by different polycomb subunits. Loci with the shortest t1/2 residual values are enriched for binding the CBX8 subunit. An example of a large polycomb-bound domain in K562 cells is the HoxD cluster. The half-life of chromatin interactions for loci in the HoxD cluster is relatively short (Extended Data Fig. 8C).
Silent and closed chromatin loci around the nucleolus or at the nuclear lamina were engaged in the most stable interactions (Fig. 5B). Chromatin interactions for loci associated with HP1γ (CBX3) were relatively unstable while interactions for loci associated with HP1β (CBX1) or HP1α (CBX5) were more stable. This variation is in agreement with the chromosomal locations and dynamics of these three HP1 proteins. HP1γ is associated with active chromatin and mobile, while HP1α and HP1β are typically found in constitutive heterochromatin near (peri) centromeres and are much less mobile 61.
For each sub-compartment, we split loci into expressed (FPKM ≥1) or not expressed (FPKM <1) categories (Fig. 5C). We find that sub-compartment status is the major determinant of chromatin interaction stability, with transcriptional status having no or only very minor effects.
The differential stability of pair-wise chromatin interactions at different sub-nuclear structures can be quantified by plotting interaction frequencies between pairs of 40-kb loci arranged by their level of factor binding to obtain homotypic interaction saddle plots (Fig. 5D). After chromatin fragmentation we observe loss of preferential interactions between speckle-associated loci, while preferential interactions between non-speckle-associated loci can be observed even after 16 hours. Conversely, preferential interactions between lamin-associated loci remain detectable even at late time points, while interactions between loci not at the lamina disappear relatively fast.
Chromatin loops dissociate upon chromatin fragmentation
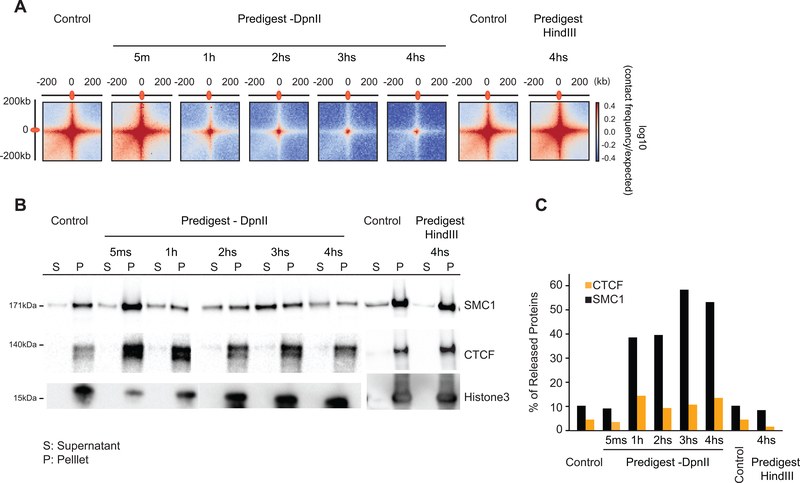
We aggregated Hi-C data at pairs of sites that had previously been shown to engage in looping interactions in K562 cells 2. We readily detected these loops in intact purified nuclei (Fig. 6A). After fragmentation with HindIII for 4 hours, loops appeared to become slightly stronger. Fragmenting chromatin with DpnII resulted in loss of loops over time.
Fig. 6: Chromatin loop dissociation upon fragmentation.
(A) Aggregated distance-normalized Hi-C interactions around 6,057 loops detected in K562 cells 2 at 10-kb resolution, for control nuclei and nuclei digested with DpnII up to 4 hours, and for nuclei digested with HindIII for 4 hours.
(B) Western blot analysis of CTCF, cohesin and histone H3 abundance in soluble (s) and chromatin-bound (p) fractions obtained from control nuclei and from nuclei pre-digested with DpnII up to 4 hours and HindIII for 4 hours. Representative data are shown for 1 out of 2 replicates.
(C) Quantification of the data shown in panel B. Percentage of released protein is the ratio of protein level in the soluble fraction divided by the sum of the levels in the soluble and chromatin-bound fractions.
We assessed whether CTCF and cohesin binding to chromatin is affected by chromatin fragmentation. We fractionated proteins in chromatin-bound and soluble fractions (62, Methods). In intact nuclei, most of the CTCF and cohesin is associated with chromatin (Fig. 6B, C). Digesting chromatin with HindIII did not lead to dissociation of CTCF or cohesin. However, fragmenting chromatin with DpnII led to dissociation of cohesin after 1 hour, while CTCF binding was only weakly affected. We conclude that DNA fragmentation to <6 kb fragments, but not to 10–25 kb fragments, leads to loss of cohesin binding and loss of looping interactions. These results are consistent with earlier observations that showed that in yeast stable chromatin binding by cohesin requires intact DNA 63. These data can be interpreted in the context of the model where cohesin rings encircle DNA (pseudo-) topologically 64. Possibly, when DNA is fragmented, the cohesin ring can slide off nearby free ends.
DISCUSSION
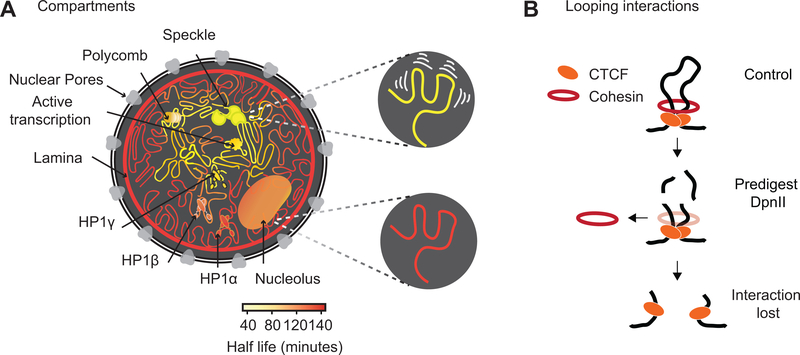
Using liquid chromatin Hi-C we obtained a view of the dynamics of chromatin interactions throughout the nucleus and the genome (Fig. 7A). Previously, live cell imaging experiments found differences in mobility dependent on sub-nuclear position and chromatin state and activity 37–44. A previous study, which inspired the current work, aimed to identify factors that determine intrinsic locus-locus interactions and locus mobility by removing the polymeric constraint due to linkage 65. In that work a silent locus was excised from the chromosome 65 and its mobility and preference for association with other silent loci and the nuclear periphery was found to depend on specific silencing complexes. In our liquid chromatin Hi-C experiments, the polymeric constraint on movement is removed for all loci simultaneously, performing a genome-wide variant of the experiments performed by Gartenberg et al.
Fig. 7: Illustration of chromatin interaction dynamics in the nucleus and model for cohesin loss after chromatin digestion.
(A) Left: Schematic representation of varying chromatin interactions dynamics at different sub-nuclear domains. Shortest half-life reflects the least stable interactions (yellow), while longest half-life reflects the most stable interactions (dark orange). Nuclear subdomains differ greatly in their stability. Top right: Chromatin anchored at speckles is driven by the most dynamic interactions. Bottom right: Chromatin anchored at the nuclear lamina involves the most stable interactions.
(B) Model for how cohesin rings stabilize CTCF-CTCF loops by encircling loop bases. Top: Cohesin ring encircles loop bases at convergent CTCF sites. Middle: Pre-digestion with DpnII cuts loop into chromatin fragments <6 kb, and the cohesin ring can slide off nearby ends. Bottom: CTCF remains bound to digested chromatin fragments but interactions between CTCF-bound sites are lost.
Chromosomal compartmentalization tolerates genome-wide fragmentation with HindIII in >10–25 kb fragments. Micro-mechanical measurements also show that chromosomes remain mechanically fully connected. We conclude that stable chromosome conformation and phase segregation can occur when blocks of a particular chromatin state are at least 10 kb. Our results obtained with DpnII digestion where the genome is fragmented in <6-kb (average ~3.1 kb) fragments show that these fragments are too short to maintain phase-segregated domains. The stability of interactions between <6-kb fragments depends on their chromatin state and association with sub-nuclear structures: interactions at the nuclear lamina are relatively stable, those near nuclear speckles and polycomb complexes are highly unstable, while interactions for loci associated with different heterochromatin proteins and the nucleolus displayed a range of intermediate stabilities. The dynamics of associations between loci are therefore determined by chromatin-associated factors, and may also be determined directly by the biochemical properties of histone tail modifications. For instance, the Rosen laboratory found that chromatin fragments can form droplets in vitro and that the dynamics of chromatin fragments within these droplets are dependent upon both H1 binding and histone acetylation 66.
Liquid chromatin Hi-C identified differences in chromatin interaction stability between facultative heterochromatic domains marked by polycomb and constitutive heterochromatic domains marked by lamina association or binding of HP1α/HP1β proteins. While many chromatin contacts in constitutive heterochromatin were maintained even after 16 hours of digestion, the half-life for chromatin contacts at polycomb-bound regions was shorter. The compacted states of polycomb and HP1α bound chromatin appear to form via a similar phase-separation mechanism. CBX2 (polycomb subunit) and CBX5 (HP1α) are capable of forming condensates 67–69. Our data indicate that these different condensates and associated chromatin have very different properties: the stability of interactions between loci mediated by these factors is distinct, possibly related to differences in affinity between CBX proteins and chromatin: the binding affinity of CBX5 (Hp1α) for H3K9me3 is higher than the affinity of CBX2 for H3K27me3 70.
Our results allow a crude estimate of the Flory-Huggins χ parameter for A/B segregation of chromatin. Given that HindIII and DpnII cut chromatin into segments of approximately 17±7 kb and 3±1 kb respectively, a reasonable estimate of the minimum length of fragments necessary to drive A/B segregation is N* = 10±4 kb. For homopolymers, the Flory-Huggins model predicts a critical length needed for phase separation of N* = 2/χ 47, indicating χ = 0.20 ± 0.07/kb (χ = 0.036±0.013 /nucleosome). In the Supplementary Note more details are provided along with the assumptions underlying this calculation.
It is important to point out that during the liquid chromatin Hi-C procedure some chromatin factors and RNAs may dissociate from the purified nuclei, and this could affect the locus-mixing behavior we observe. The current work analyzed the intrinsic chromatin interaction strengths and dissolution kinetics of chromosome conformation within inactive nuclei. Future work can focus on how these kinetic properties change in cells or nuclei, where active processes such as transcription, replication, chromatin compaction and condensation, and loop extrusion are also acting, and on determining the roles of RNAs, proteins, and histone modifications in modulating the attractive forces between loci and the dynamics of genome folding in general.
METHODS
K562 nuclei purification
Three sucrose cushions were made before starting nuclei purification. 30 ml of 30% sucrose [10 mM PIPES pH 7.4, 10 mM KCl, 2 mM MgCl2, pH adjusted to 7.4 using 1 N KOH, 30% sucrose, 1 mM DTT (added prior to use), 1:100 protease inhibitor (Thermo Fisher 78438) (added prior to use)] was transferred to a 50-ml tube, then 5 ml of 10% sucrose [10 mM PIPES pH 7.4, 10 mM KCl, 2 mM MgCl2, 10% Sucrose, 1 mM DTT (added prior to use), 1:100 protease inhibitor (added prior to use)] was slowly loaded in top of 30% sucrose, and the tubes were incubated at 4°C until needed. K562 cell pellets (100 million cells) were lysed using the following nuclear isolation procedure. After the cells were spun, the pellets were washed twice with 10 ml HBSS, then pelleted after each wash at 300 rpm for 10 min at 4°C. Cell pellets were dissolved in 15 ml nuclear isolation buffer [10 mM PIPES pH 7.4, 10 mM KCl, 2 mM MgCl2, 1 mM DTT (added prior to use), 1:100 protease inhibitor (added prior to use)], pH adjusted to 7.4 using 1 M KOH]. Then, cells were lysed on ice in a 15 ml Dounce homogenizer with pestle A (KIMBLE Kontes 885002–0015) by moving the pestle slowly up and down 20 times, followed by incubation on ice for 20 min and another 20 strokes. Next, each 5 ml of lysed extract was loaded slowly on top of a sucrose cushion prepared earlier. Then the tubes were spun for 15 min at 800 g at 4°C. The supernatant was removed carefully for a good recovery of the nuclei pellet in the bottom of the tube. Nuclei pellets were resuspended in 1 ml of HBSS, then spun for 5 min at 5,000 g at 4°C using a benchtop refrigerated centrifuge. Then, the nuclei pellet was resuspended in 3 ml HBSS, and 1 μl was taken to quantify the nuclei before the 3 ml was split over two microfuge tubes and spun for 5 min at 5,000 g at 4°C using a benchtop refrigerated centrifuge. Finally, the nuclei pellet was dissolved into an adequate total volume to obtain 1 million nuclei per 0.1 ml of Nuclei storage buffer (NSB) [10 mM PIPES pH 7.4, 10 mM KCl, 2 mM MgCl2, 50% glycerol, 8.5% sucrose, 1 mM DTT (added prior to use), 1:100 protease inhibitor (added prior to use)]. Each 0.5 ml of NSB containing 5 million nuclei was transferred to a microfuge tube and stored at −80°C.
3C (Chromosome Conformation Capture)
3C was performed as described in “From cells to chromatin: Capturing snapshots of genome organization with 5C technology” 71. For details see Supplementary Methods. 3C primers are listed in Supplementary Table 1.
BAC library for 3C-PCR
BAC DNA was generated as described 50. A control ligation library covering the beta-globin locus (ENCODE region ENm009) was generated using BACs overlapping the region. Starting with a mixture of DNA of seven BACs (CTC-775N13, RP11–715G8, CTD-3048C22, CTD3055E11, CTD-2643I7, CTD-3234J1, and RP11–589G14) (Invitrogen), mixed in equimolar ratios, we used the same steps described in the 3C protocol above starting from the digestion step. BAC clones were digested with EcoRI, then randomly ligated, and the DNA was purified. The BAC ligation library reflects random ligation of EcoRI fragments throughout the beta-globin locus, so any difference in PCR signal for 3C primer pairs along the beta-globin locus due to differences in primer efficiency can be corrected by normalizing the amount of PCR product obtained with the 3C library to the amount obtained with the BAC ligation library.
Chromosome Conformation Capture Carbon Copy (5C)
Experimental design
Probes were designed as described 50. 213 5C probes were designed for a ~1-Mb region (chr11:4730996 −5729937; hg18) around the Beta-globin locus at EcoRI restriction sites using publicly available 5C primer design tools 72. Probes were designed according to a single alternating scheme exactly as described before 72 and the genomic uniqueness of all primers was verified with the SSAHA algorithm. For each EcoRI fragment at the 1 Mb target region a primer was designed. 104 5’ forward (FOR) and 109 5’ reverse (REV) primers were designed. 5C primers are listed in Supplementary Table 2.
Generation of 5C libraries
5C libraries were generated as described before 71, with three modifications. First, we skipped the gel purification after the adaptor ligation and replaced this with a 1:1 Ampure step to remove unligated DNA and adaptors. Second, barcoded Illumina adaptors were used. Third, we performed the final PCR using TruSeq DNA LT kit Set A (REF 15041757). See Supplementary Methods for protocol details.
Pre-digestion of nuclei (liquify chromatin)
Purified nuclei as described above (K562 nuclei purification) were placed on ice and 1 ml of HBSS was added to each 0.5 ml of 5 million frozen nuclei. After thawing, nuclei were centrifuged 5 min at 5,000 g. The nuclei pellet was washed twice with 1× NEB3.1 for nuclei that would be digested with DpnII or 1× NEB2.1 for nuclei that would be digested with HindIII. The nuclei were pelleted for 5 min at 5,000 g after each wash.
Isolated nuclei:
a sample of 5 million nuclei was resuspended in 1,250 μl of 1× NEB3.1 as control, and then processed immediately for Hi-C starting at the crosslinking step (see below Hi-C 2.0 protocol).
Undigested nuclei:
Each sample of two million nuclei was resuspended in 500 μl of 1× NEB3.1 on ice, as and control for the pre-digestion and then treated as described immediately below.
DpnII pre-digestion:
Each sample of two million nuclei was resuspended in 500 μl of 1× NEB3.1 on ice. Next, 120 U of DpnII (NEB R0543S) was added to the sample in order to obtain 10 U DpnII/μg DNA and then treated as described immediately below.
FatI pre-digestion:
Each sample of two million nuclei was resuspended in 500 μl of 1× NEB3.1 on ice. Next, 120 U of FatI (NEB R0650L) was added to the sample in order to obtain 10 U FatI/μg DNA and then treated as described immediately below.
HindIII pre-digestion:
Each sample of two million nuclei was resuspended in 500 μl of 1× NEB2.1 on ice. Next, 600 U of HindIII (NEB R0104T) was added to the sample in order to obtain 50 U HindIII/μg of DNA and then treated as described immediately below.
Next, control and pre-digestion samples were incubated at 37°C on a thermocycler (900 rpm for 30 sec every 4 min) for 5 min up to 16 h. Afterward, samples were placed on ice for 10 min. For DpnII-seq and assessment of fragmentation level, a final volume of 10 mM of EDTA was added to inactivate the endonuclease, followed immediately by the DpnII-seq protocol (details of protocols below. DpnII-Seq) or DNA purification for fragment analyzer analysis. For Hi-C, we proceeded immediately to the first step of the protocol (crosslinking as described below). For microscopy, nuclei samples were cross-linked with a 4% final concentration of paraformaldehyde.
Hi-C 2.0
Hi-C was performed as described 55 with some modifications in the crosslinking and lysis step as described below. Hi-C was performed following the exact same protocol for mock treated and for pre-digested nuclei, even though for pre-digested nuclei chromatin was already fragmented prior to fixation. There are several reasons to perform the full Hi-C procedure even for pre-digested nuclei. First, pre-digestion (e.g. with DpnII) leads to partial digestion. During the subsequent Hi-C procedure chromatin is digested with DpnII again, but this time the chromatin has been opened with SDS treatment. This allows more complete digestion. Second, by performing the full Hi-C procedure for pre-digested nuclei allows direct comparison of data obtained with mock treated nuclei, HindIII pre-digested nuclei, DpnII pre-digested nuclei and FatI pre-digested nuclei. See Supplementary Methods for protocol details. All Hi-C dataset and mapping statistics can be found in Supplementary Table 3.
DpnII-Seq and FatI-seq
For each DpnII-Seq library, 10 million nuclei were used right after the pre-digestion procedure described above (Pre-digestion of nuclei). The pre-digested nuclei were then treated with proteinase K, DNA was purified and DNA ends were filled in with a mixture of dNTPs containing biotin-dATP. Biotin containing DNA was then purified using streptavidin coated beads, and prepared for Illumina paired-end sequencing. See Supplementary Methods for protocol details.
Fragment size determination after pre-digestion with DpnII
Four million cells were pre-digested for 4 hours using DpnII procedure described above and in the Supplementary Methods (Pre-digestion of nuclei). Nuclei were then treated with protease, DNA was isolated and size fractionated on an agarose gel. DNA was isolated from the gel in three size ranges: less than 1 kb, 1–3 kb, and larger than 3 kb. DNA in each fraction was then sheared and prepared for Illumina paired-end sequencing. See Supplementary Methods for protocol details.
Lamin A Immunofluorescence and DAPI
For nuclei immunofluorescence, we prepared a coverslip by adding 1 ml of 0.1% Poly-L-lysine solution (Sigma SLBQ5716V) for 10 min, then coverslips were dried using Whatman papers. Each coverslip was transferred to a single well of an eight wells plate. The coverslips were washed twice using PBS. Next 500 μl of 30% sucrose with 1 mM DTT was added on top of the coverslips to protect nuclei from an abrupt contact with coverslip during spinning. 1 million control nuclei or nuclei after chromatin digestion were crosslinked for 20 min using a 4% final concentration of paraformaldehyde immediately after pre-digestion. Next, nuclei were added slowly on top of the sucrose solutions on the coverslips and spun for 15 mins at 2,500 g at 4°C. Next, nuclei were assumed to be attached to the coverslips which were then transferred to a new 8 well plate. The coverslips were washed five times with 1% PBS. Next, non-specific binding of the primary antibody was blocked by adding 500 μl of the blocking buffer [3% BSA, 1× PBS, 0.1% Triton X-100 (Sigma 9002–93-1)] and incubating for 60 min at RT. Afterward, lamin A antibody (ab 26300) was diluted 1:1,000 in blocking buffer, and the coverslip was incubated face-down on top of a 250 μl of lamin A antibody droplet that was placed on parafilm for 120 min at RT. Then, the coverslip was placed back in the well of a new plate face-up and washed five times with washing buffer (1× PBS, 0.1% Triton X-100). The secondary antibody goat anti-rabbit (ab150077) was diluted 1:1,000 in blocking buffer, and the coverslip was incubated face-down on top of a 250 μl droplet of the secondary antibody (goat anti-rabbit (ab150077) that was placed on parafilm for 60 min at RT. Next, the coverslip was placed back in the well of a new plate face-up and washed five times with washing buffer (1× PBS, 0.1% Triton X-100) and twice with 1× PBS. The slide was mounted and sealed using 10 μl antifade mountant with DAPI (Invitrogen P36931).
For image acquisition, we used a Nikon Eclipse Ti microscope. Imaging was performed using an Apo TIRF, N.A. 1.49, 60× oil immersion objective (Nikon), and a Zyla sCMOS camera (Andor). Z-series of 0.2-μm slices were acquired using Nikon Elements software (Version 4.4).
Chromatin fractionation assay
Chromatin-bound proteins were isolated and separated from free proteins. A sample of 2 million control nuclei or pre-digested nuclei (obtained as described above “Pre-digestion of nuclei”) was centrifuged at 5,000 g for 5 min at 4°C. The supernatant was transferred to an Amicon column to reduce the volume from 500 μl to 100 μl by centrifugation for 4 min at 14,000 g. This sample contains the free protein fraction. Next, 26 μl of glycerol and 1.3 μl of 100× protease inhibitor cocktail were added to the 100 μl free proteins sample. The pellet containing the nuclei was resuspended in 100 μl of nuclei purification buffer with Triton (10 mM PIPES pH 7.4, 10 mM KCl, 2 mM MgCl2, 0.25% Triton, 1% protease inhibitor, 1 mM DTT) and incubated for 10 min on ice. Then, in order to protect protein structure during sonication, 25 μl of glycerol was added to the 100 μl pellet sample to have 20% final glycerol concentration. The sample was sonicated using a Covaris instrument at 4°C as follows: (Duty Cycle 10%, Intensity 5, Cycles per Burst 200, set Mode Frequency sweeping, continuous degassing, process time 60 sec, 4 cycles). The pellet sample contains chromatin-bound proteins, was transferred to a 1.5-ml tube. All samples were stored at −20°C. These samples contain the protein bound CTCF and cohesin. Note: when these samples were centrifuged after the triton solubilization, we found that no SMC3 or CTCF could be detected in the supernatant. These results indicate that non-chromatin-bound proteins exit the nuclei and were recovered in the supernatant prior to triton solubilization step.
For analysis of CTCF and SMC1 chromatin binding: 15 μl from each protein sample (supernatant or pellet) was mixed with 5 μl of 5× Lane Marker Reducing Sample Buffer (Thermo Fisher 39000), then the mix was boiled for 10 min. The samples were cooled down to RT before loading them on a 3–8% Tris-Acetate Protein Gels (Invitrogen EA0375PK2). Next, the gel was run in 1× Tris-Acetate SDS Running Buffer (Invitrogen LA0041) for 75 min at 150V. For histone H3: 1 μl of protein sample was mixed with 14 μl of PBS containing 1% protease inhibitor, 5 μl of 5× Lane Marker Reducing Sample Buffer was added to the mix and boiled for 10 min. The samples were cooled down to RT before loading them in Tris-Base 4–12% (Invitrogen NP0322BOX), then the gel was run in 1× MES-SDS running buffer (Invitrogen B0002) for 60 min at 150V. The proteins were transferred from the gel to nitrocellulose membrane using 1× western blot transfer buffer (Thermo science 35040). The transfer was 120 min for SMC1 and CTCF and 75 min for histone H3. The nitrocellulose membranes were washed using 1× TBST [50 mM Tris-Cl, pH 7.6; 150 mM NaCl, 0.1 ml of Tween 20], then blocked for 120 min using 5% milk (1 g milk in 20 ml 1× TBST). The membrane when then incubated overnight at 4°C with primary antibody diluted in 5% milk [1:1,000 CTCF antibody cell signaling (active Motif 61311), 1:2,000 SMC1 (Bethyl Antibody, A300–055A), 1:4,000 histone H3 Abcam (ab1791)]. Next, the membranes were washed 6 times for 10 min per wash using 1× TBST. The secondary antibody anti-rabbit IgG HRP from cell signaling was diluted using 5% milk for CTCF and SMC1 [1:1,000 for CTCF, 1:2,000 SMC1] and in 1% milk for histone H3 1:5,000 dilution. Membranes were incubated for 120 min at RT. Finally, membranes were washed 6 times for 10 min using 1× TBST. Finally, the membranes were developed using luminol-based enhanced chemiluminescence (Thermo science 34076).
Micromanipulation force measurement and treatments of an isolated nuclei
Micromanipulation force measurements were conducted as described previously in Stephens et al. 56. K562 cells were grown in microscope slide wells and treated with 1 μg/ml latrunculin A (Enzo Life Sciences) for ~45 min before single nucleus isolation. The nucleus was isolated by using small amounts of detergent (0.05% Triton X-100 in PBS) locally sprayed onto a living cell via an “isolation” micropipette. This gentle lysis allows the use of a second micropipette to retrieve the nucleus from the cell, using slight aspiration and non-specific adherence to the inside of the micropipette. A third micropipette was then attached to the opposite end of the nucleus in a similar fashion. This last “force” micropipette was pre-calibrated for its deflection spring constant, which is on the order of 2 nN/μm. A custom computer program written in LabView was then run to move the “pull” micropipette and track the position of both the “pull” and “force” pipettes. The “pull” pipette was instructed to move 5 μm at 45 nm/sec. The program then tracked the distance between the pipettes to provide a measure of nucleus extension ~3 μm. Tracking the distance that the “force” pipette moved/deflected multiplied by the pre-measured spring constant provides a calculation of force exerted. Calculations were done in Excel (Microsoft) to produce a force-extension plot from which the best-fit slope of the line would provide a spring constant of the nucleus (nN/μm). Isolated nuclei were measured twice initially to establish the native spring constant prior to treatment. After 50 μl of buffer only (control), 100 units DpnII (|GATC) with NEB buffer 3.1, or 100 units HindIII (A|AGCTT) with NEB buffer 2.1 was added to the 1.5 ml imaging well and mixed gently. Force measurements were performed 5 min, 30 min, and 60 min post-treatment. Example movies of micromanipulation experiments can be found in Supplementary Movies 1 and 2.
Data availability
All sequencing data have been submitted to a public data repository (GEO; accession number GSE134590). Data are available through the 4D Nucleome data portal.
Code availability
All code for data processing and analysis, described in detail in the Methods, is available through the following GitHub accounts:
https://github.com/tborrman/liquid-chromatin-Hi-C
https://github.com/tborrman/DpnII-seq
https://github.com/dekkerlab/5C-CBFb-SMMHC-Inhib
https://github.com/dekkerlab/cMapping
https://github.com/dekkerlab/cworld-dekker
Extended Data
Extended Data Fig. 1: Chromosome conformation in isolated nuclei.
(A) Hi-C 2.0 intra-chromosomal interaction maps for K562 cells (top) and purified nuclei (bottom).
(B) 5C interaction map of 1 Mb region surrounding the beta-globin locus in K562 cells. Top: cells. Bottom: purified nuclei. CTCF-mediated interactions are preserved in purified nuclei. Red circles: positions of CTCF sites, purple square Beta-globin locus control region (LCR).
(C) Representative 3C-PCR (out of two experiments) for a 44,120 kb region surrounding the beta-globin LCR on chromosome 11, detects at high resolution the known looping interactions between the LCR and the expressed gamma-globin genes (HBE1, HBG2) in K562 cells. Looping interactions are not detected in GM12878 cells that do not express these genes. Top: cells. Bottom: purified nuclei. Each data point is the average of 3 PCR reactions; error bars indicate standard error of the mean.
(D) Compartmentalization saddle plots: average intra-chromosomal interaction frequencies between 100 kb bins, normalized by genomic distance. Bins are sorted by their PC1 value derived from Hi-C data obtained with K562 cells. In these plots preferential B-B interactions are in the upper left corner, and preferential A-A interactions are in the lower right corner. Numbers in the corners represent the strength of AA interactions as compared to AB interactions and BB interactions over BA interactions. Left: cells. Right: purified nuclei.
(E) Spearman correlation of PC1 in cells vs PC1 in nuclei for chromosome 2 at 100kb resolution (ρ= 0.99).
Extended Data Fig. 2: Chromosome conformation dissolution upon chromatin fragmentation.
(A) Workflow for Liquid chromatin Hi-C.
(B) Illustration of loss of structure metric using a pre-digested sample and a control.
(C) Hi-C interaction maps and compartmentalization saddle plots for a second replicate of control nuclei (incubated for 4 hours in restriction buffer) and nuclei pre-digested with HindIII for 4 hours.
(D) Left: Spearman correlation of DpnII restriction digestion efficiency (DpnII-seq) and PC1 for chromosome 2 at 40 kb resolution. Right: Partial correlation of LOS (LOS residuals) with PC1 after controlling for restriction efficiency (DpnII-seq), for chromosome 2 at 40kb resolution. Spearman correlation is indicated.
(E) compartmentalization saddle plots for the corresponding conditions. Numbers indicate strength of A-A and B-B interactions for inter-chromosomal interactions.
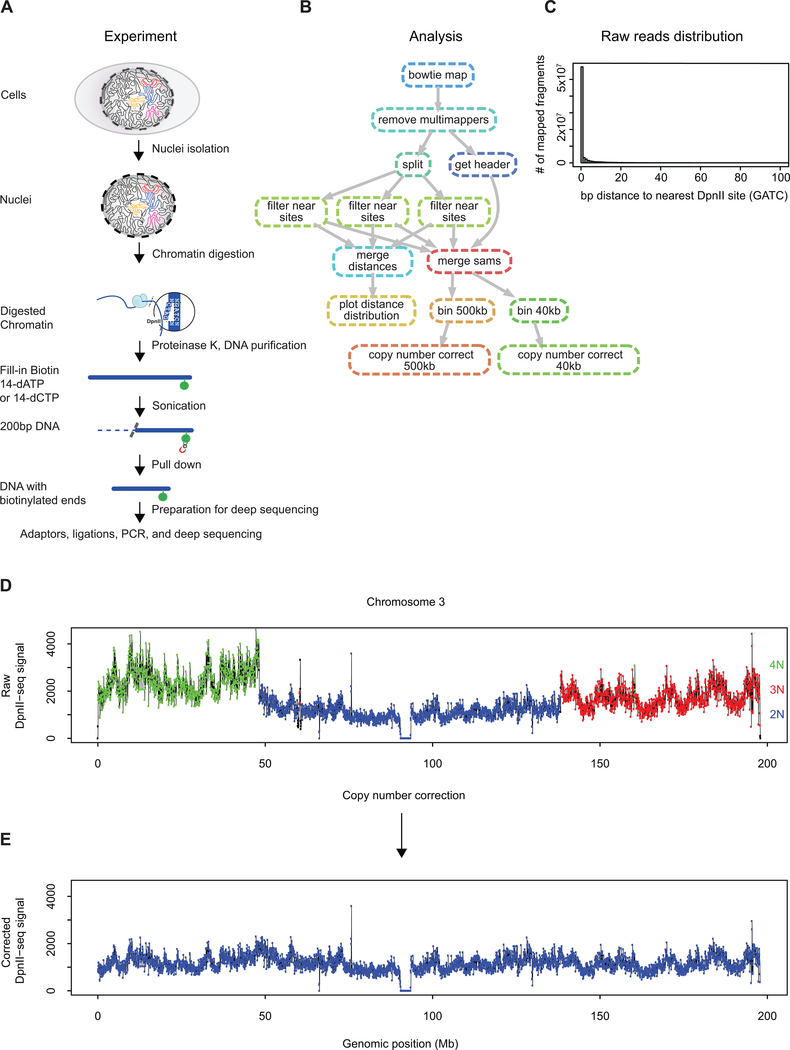
Extended Data Fig. 3: Experimental protocol and computational workflow for DpnII-seq.
(A) Schematic of DpnII-seq experimental protocol for recovering DNA fragments digested by the restriction enzyme DpnII.
(B) Directed graph of DpnII-seq computational pipeline
(C) Histogram of distance to nearest DpnII recognition site for each recovered DpnII digested fragment.
(D) Raw DpnII-seq signal displaying multiple copy number states (2N, 3N, 4N) within chromosome 3 (data binned at 40 kb).
(E) Copy number corrected DpnII-seq signal displaying single copy number state (2N) across chromosome 3.
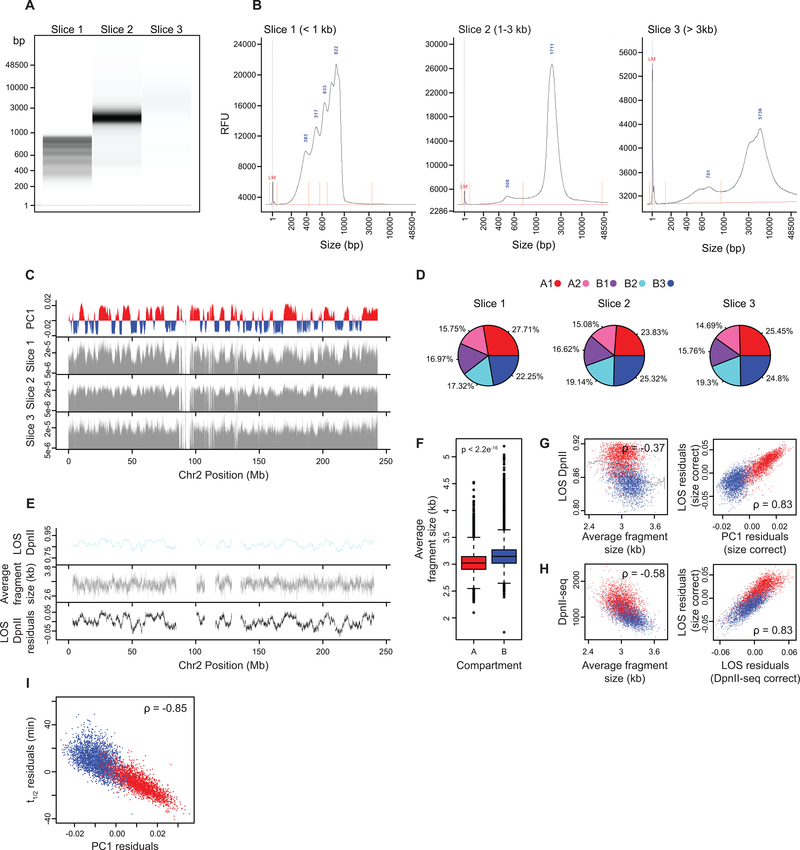
Extended Data Fig. 4: Average fragment size per bin and correlation with chromatin stability.
(A) DNA purified from nuclei pre-digested with DpnII for 4 hours were separated into slices of three sizes and run on a Fragment Analyzer. One experiment was performed.
(B) Fragment Analyzer distributions of DNA fragment sizes for the three separated slices (RFU: relative fluorescence unit, LM: lower marker, fragment sizes at distribution peaks are given in blue).
(C) Top plot: Eigenvector 1 values (PC1, 40 kb resolution) across a section of chromosome 2, representing A (red) and B (blue) compartments. Bottom three plots: Normalized coverage of fragments from given slice size across a section of chromosome 2.
(D) Percentages of fragments mapped to each subcompartment for given slice size.
(E) Top plot: LOS along chromosome 2 at 40 kb resolution for nuclei pre-digested with DpnII. Middle plot: Average fragment size estimated for every 40kb bin after pre-digestion with DpnII (Methods). Bottom plot: LOS-residuals for nuclei pre-digested with DpnII after correction for average fragment size.
(F) Boxplot of average fragment size for A compartment bins (n=35836) and B compartment bins (n=33252). Significance determined by two-sample two tailed t-test (p < 2.2e-16, t = −80.535, d.f. = 67270, 95% CI= −0.1228385,−0.1170014). Boxplot middle line is the median, the lower and upper edges of the box are the first and third quartiles, the whiskers extend to interquartile range (IQR) × 1.5 from the box. Outliers are represented as points.
(G) Left plot: correlation between LOS for nuclei pre-digested with DpnII and average fragment size. Grey line indicates moving average used for residual calculation. Right plot: partial correlation between residuals of LOS for nuclei pre-digested with DpnII and residuals of PC1 after correcting for correlations between LOS and average fragment size and PC1 and average fragment size (for chromosome 2, Spearman correlation values are indicated).
(H) Left plot: Correlation between DpnII-seq signal and average fragment size. Right plot: correlation between residuals of LOS after correcting for average fragment size and residuals of LOS after correcting for DpnII-seq signal (for chromosome 2, Spearman correlation values are indicated).
(I) Partial correlation between residuals of t1/2 and residuals of PC1 after correcting for correlations between t1/2 and average fragment size and PC1 and average fragment size.
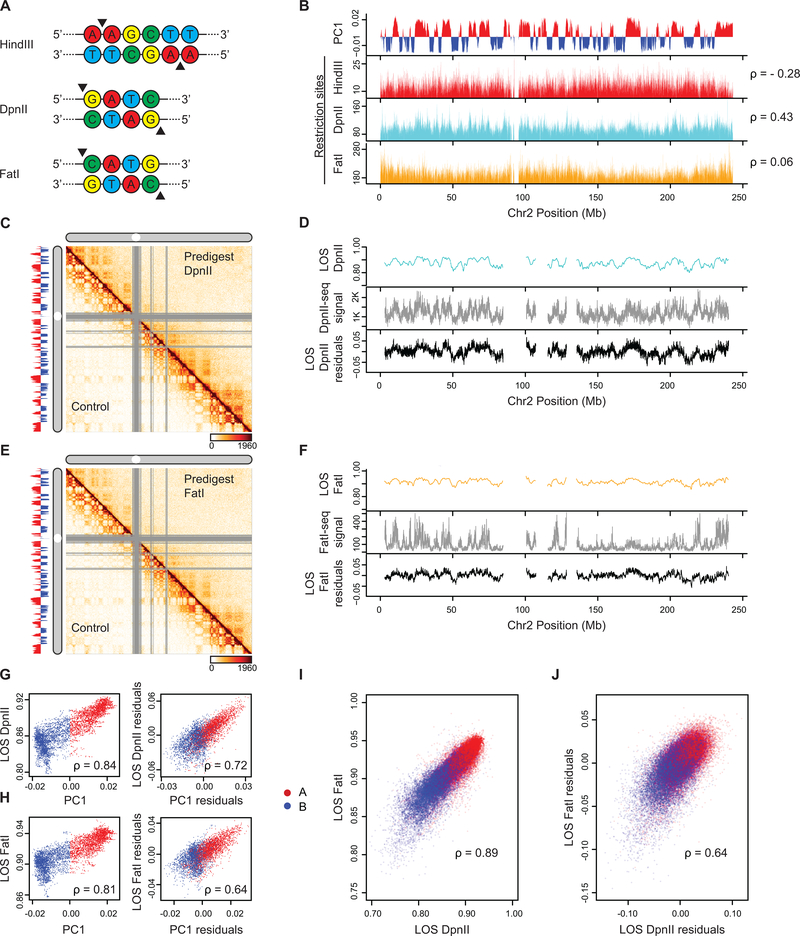
Extended Data Fig. 5: Liquid chromatin Hi-C results are reproducible using the restriction enzyme FatI.
(A) Restriction sites for the selected restriction enzymes. Black triangles denote cut sites.
(B) Top plot: Eigenvector 1 values (PC1, 40 kb resolution) across a section of chromosome 2, representing A (red) and B (blue) compartments. Bottom three plots: Coverage of restriction sites (40kb resolution). Spearman correlation between restriction site coverage and PC1 is given for each restriction site track.
(C) Third replicate of DpnII predigest liquid chromatin Hi-C. Hi-C interaction maps of chromosome 2 binned at 500 kb. Bottom left: control nuclei in restriction buffer for 4 hours. Top right: nuclei digested for 4 hours with DpnII prior to Hi-C. Left track: Eigenvector 1 values (PC1, 40 kb resolution) across a section of chromosome 2, representing A (red) and B (blue) compartments.
(D) Top plot: LOS along chromosome 2 at 40 kb resolution for nuclei pre-digested with DpnII. Middle plot: DpnII-seq signal. Bottom plot: LOS-residuals for nuclei pre-digested with DpnII after correction for DpnII-seq signal.
(E) FatI predigest liquid chromatin Hi-C. Hi-C interaction maps of chromosome 2 binned at 500 kb. Bottom left: control nuclei in restriction buffer for 4 hours. Top right: nuclei digested for 4 hours with FatI prior to Hi-C. Left track: Eigenvector 1 values (PC1, 40 kb resolution) across a section of chromosome 2, representing A (red) and B (blue) compartments.
(F) Top plot: LOS along chromosome 2 at 40 kb resolution for nuclei pre-digested with FatI. Middle plot: FatI-seq signal. Bottom plot: LOS-residuals for nuclei pre-digested with FatI after correction for FatI-seq signal.
(G) Left plot: Correlation between LOS for nuclei pre-digested with DpnII and PC1. Right plot: partial correlation between residuals of LOS for nuclei pre-digested with DpnII and residuals of PC1 after correcting for correlations between LOS and DpnII-seq and PC1 and DpnII-seq signal (for chromosome 2, Spearman correlation values are indicated).
(H) Left plot: Correlation between LOS for nuclei pre-digested with FatI and PC1. Right plot: partial correlation between residuals of LOS for nuclei pre-digested with FatI and residuals of PC1 after correcting for correlations between LOS and FatI-seq and PC1 and FatI-seq signal (for chromosome 2, Spearman correlation values are indicated).
(I) Correlation between LOS for nuclei pre-digested with FatI and LOS for nuclei pre-digested with DpnII (genome wide, Spearman correlation values are indicated).
(J) Correlation between residuals of LOS for nuclei pre-digested with FatI and residuals of LOS for nuclei pre-digested with DpnII after correcting for correlations between FatI LOS and FatI-seq and DpnII LOS and DpnII-seq (genome wide, Spearman correlation values are indicated).
Extended Data Fig. 6: Variations in Half-life and LOS are not explained by DpnII digestion kinetics.
(A) DpnII-seq signals along chromosome 2 after indicated times of digestion. Spearman correlations between DpnII-seq and t1/2 at each timepoint is indicated.
(B) t1/2 residuals along chromosome 2 after correcting t1/2 values by the correlation between t1/2 and DpnII-seq signals shown on the left obtained after the indicated times of digestion. Spearman correlation between t1/2 residuals and PC1 residuals are indicated.
(C) Top: Genome wide scatterplot of t1/2 versus 1 hour DpnII-seq signal. Gray line: moving average. Bar plot above shows the number of loci displaying various levels of DpnII-mediated cuts. Bottom: residuals of t1/2 calculated by subtracting t1/2 from the corresponding average t1/2 (gray line in top plot) plotted vs. number of DpnII cuts. Red dots: loci in the A compartment; Blue dots: loci in the B compartment. The majority of loci have 500–1100 cuts. When comparing loci with similar number of DpnII cut we observe that loci in the A compartment have shorter t1/2 values as compared to loci in the B compartment.
(D) Top: LOS along chromosome 2 at the indicated timepoints of digestion and calculated by comparison to Hi-C data obtained after 1 hour of digestion. Middle: calculation of t1/2 from LOS at different timepoints. Bottom: t1/2 along chromosome 2. This t1/2 is calculated using the Hi-C data obtained after 1 hour of pre-digestion as starting point.
(E) Partial correlation between LOS and PC1 after correcting for their correlations with DpnII-seq. LOS (at 2 hours) is calculated as in panel C using the Hi-C data obtained after 1 hour of pre-digestion as starting point
(F) Partial correlation between t1/2 and PC1 after correcting for their correlations with DpnII seq. t1/2 is calculated as in panel D using the Hi-C data obtained after 1 hour of pre-digestion as starting point. Spearman correlations are indicated.
Extended Data Fig. 7: Liquid chromatin-Hi-C protocol and quantification of loss of structure after chromatin pre-digestion.
(A) Workflow for Liquid chromatin Hi-C timecourse. CL = cross-linking step.
(B) Compartment strength derived from compartment saddle plots (See Methods). Left: Diagram depicting compartment strength calculation for B-B interactions. Plot to the right of diagram: B-B interaction strength as a function of bin number for all timepoints of the time course. Right: Diagram depicting compartment strength calculation for A-A interactions. Plot to the right of diagram: A-A interaction strength as a function of bin number for all time points of the time course.
(C) Top: LOS signal across a 40 Mb region on chromosome 2 calculated for indicated timepoints in the digestion timecourse. Line colors as in Figure 4E. Bottom: Exponential curve fit to LOS timepoints for a single 40kb bin. t1/2 (dashed vertical blue line) representing time elapsed to reach half saturation of LOS signal.
(D) Left: Density distributions of t1/2 for A and B compartments. Right: t1/2 saddle plots: average intra-chromosomal interaction frequencies between 40 kb bins, normalized by genomic distance. Bins are sorted by their t1/2 value derived from digestion timecourse. Bins with high t1/2 preferentially interact (bottom right of heatmap) and bins with low t1/2 preferentially interact (top left of heatmap).
(E) Scatterplot of t1/2 vs t1/2 for two timecourse replicates (R1 and R2) on chromosome 2. Regression line (red). Spearman correlation is indicated.
(F) Scatterplot of PC1 vs t1/2 for chromosome 2. A compartment (red); B compartment (blue).
(G) Left: Scatterplot of percent interactions occurring in cis within a 6 Mb distance out of total genome wide interactions for each 40 kb bin in control Hi-C map (Cis %) vs PC1. Middle: Cis% vs t1/2. Right: Scatterplot of partial correlation between PC1 and t1/2 controlled by Cis %. A compartment (red); B compartment (blue). Solid red lines are regression lines. Spearman correlations are indicated.
Extended Data Fig. 8: Associations between sub-nuclear structures and chromatin interaction stability.
(A) Spearman correlation matrix between signals for various chromatin state markers of various sub-nuclear structures, chromatin remodellers and histone modifications with row order determined by hierarchical clustering.
(B) The genome was split into 16 bins, where each bin corresponds to sets of loci that share the same t1/2 interval. For each t1/2 interval the mean z-score signal enrichment for various markers of sub-nuclear structures, chromatin remodellers and histone modifications was calculated and shown as a heatmap. Row order determined by hierarchical clustering.
(C) 3 Mb region surrounding HoxD locus. Top: Hi-C contact map for K562 control nuclei showing the position of the HoxD locus. Tracks: ChIP-seq tracks for polycomb subunits (cyan) and the polycomb associated histone modification H3K27me3 (green). t1/2 (blue). Minus strand and plus-strand signal of total RNA-seq (red). Refseq Genes (blue/black). The polycomb-bound domain displays shorter half-life compared to expressed genes in flanking regions.
Supplementary Material
Acknowledgements
J.D. and J.F.M. acknowledge support from the National Institutes of Health Common Fund 4D Nucleome Program (U54-DK107980). This work was also supported by a grant from the National Human Genome Research Institute (NHGRI) to J.D. (HG003143), another NHGRI grant to Z.W. (HG009446), and by grants from the National Cancer Institute (U54-CA193419) and from the National Institutes of Health (R01-GM105847 to J.F.M. and K99-GM123195 to A.D.S.). J.D. is an investigator of the Howard Hughes Medical Institute. We thank Leonid A. Mirny and Edward J. Banigan for discussions and Jian Ma for sharing K562 sub-compartment assignments.
Footnotes
Competing interests statement
The authors declare no competing interests.
REFERENCES
- 1.Lieberman-Aiden E et al. Comprehensive mapping of long-range interactions reveals folding principles of the human genome. Science 326, 289–293 (2009). [DOI] [PMC free article] [PubMed] [Google Scholar]
- 2.Rao SSP et al. A 3D map of the human genome at kilobase resolution reveals principles of chromatin looping. Cell 159, 1665–1680 (2014). [DOI] [PMC free article] [PubMed] [Google Scholar]
- 3.Chen Y et al. Mapping 3D genome organization relative to nuclear compartments using TSA-Seq as a cytological ruler. J Cell Biol 217, 4025–4048 (2018). [DOI] [PMC free article] [PubMed] [Google Scholar]
- 4.Nir G et al. Walking along chromosomes with super-resolution imaging, contact maps, and integrative modeling. PLoS Genet 14, e1007872 (2018). [DOI] [PMC free article] [PubMed] [Google Scholar]
- 5.Wang S et al. Spatial organization of chromatin domains and compartments in single chromosomes. Science 353, 598–602 (2016). [DOI] [PMC free article] [PubMed] [Google Scholar]
- 6.Dekker J & Mirny LA The 3D genome as moderator of chromosomal communication. Cell 164, 1110–1121 (2016). [DOI] [PMC free article] [PubMed] [Google Scholar]
- 7.Nagano T et al. Single-cell Hi-C reveals cell-to-cell variability in chromosome structure. Nature 502, 59–64 (2013). [DOI] [PMC free article] [PubMed] [Google Scholar]
- 8.Nagano T et al. Cell-cycle dynamics of chromosomal organization at single-cell resolution. Nature 547, 61–67 (2017). [DOI] [PMC free article] [PubMed] [Google Scholar]
- 9.Ramani V et al. Massively multiplex single-cell Hi-C. Nat Methods 14, 263–266 (2017). [DOI] [PMC free article] [PubMed] [Google Scholar]
- 10.Naumova N et al. Organization of the mitotic chromosome. Science 342, 948–953 (2013). [DOI] [PMC free article] [PubMed] [Google Scholar]
- 11.Gibcus JH et al. A pathway for mitotic chromosome formation. Science 359(2018). [DOI] [PMC free article] [PubMed] [Google Scholar]
- 12.Kaaij LJT, van der Weide RH, Ketting RF & de Wit E Systemic Loss and Gain of Chromatin Architecture throughout Zebrafish Development. Cell Rep 24, 1–10 e4 (2018). [DOI] [PMC free article] [PubMed] [Google Scholar]
- 13.Hug CB, Grimaldi AG, Kruse K & Vaquerizas JM Chromatin Architecture Emerges during Zygotic Genome Activation Independent of Transcription. Cell 169, 216–228 e19 (2017). [DOI] [PubMed] [Google Scholar]
- 14.Bickmore WA & van Steensel B Genome architecture: domain organization of interphase chromosomes. Cell 152, 1270–1284 (2013). [DOI] [PubMed] [Google Scholar]
- 15.Bonev B & Cavalli G Organization and function of the 3D genome. Nat Rev Genet 17, 772 (2016). [DOI] [PubMed] [Google Scholar]
- 16.Dekker J et al. The 4D nucleome project. Nature 549, 219–226 (2017). [DOI] [PMC free article] [PubMed] [Google Scholar]
- 17.Simonis M et al. Nuclear organization of active and inactive chromatin domains uncovered by chromosome conformation capture-on-chip (4C). Nat. Genet. 38, 1348–1354 (2006). [DOI] [PubMed] [Google Scholar]
- 18.Tang Z et al. CTCF-Mediated Human 3D Genome Architecture Reveals Chromatin Topology for Transcription. Cell 163, 1611–1627 (2015). [DOI] [PMC free article] [PubMed] [Google Scholar]
- 19.de Wit E et al. CTCF Binding Polarity Determines Chromatin Looping. Mol Cell. 60, 676–684 (2015). [DOI] [PubMed] [Google Scholar]
- 20.Guo Y et al. CRISPR Inversion of CTCF Sites Alters Genome Topology and Enhancer/Promoter Function. Cell 162, 900–910 (2015). [DOI] [PMC free article] [PubMed] [Google Scholar]
- 21.Vietri Rudan M et al. Comparative Hi-C reveals that CTCF underlies evolution of chromosomal domain architecture. Cell Rep. 10, 1297–1309 (2015). [DOI] [PMC free article] [PubMed] [Google Scholar]
- 22.Riggs AD DNA methylation and late replication probably aid cell memory, and type I DNA reeling could aid chromosome folding and enhancer function. Philos Trans R Soc Lond B Biol Sci 326, 285–97 (1990). [DOI] [PubMed] [Google Scholar]
- 23.Nasmyth K Disseminating the genome: joining, resolving, and separating sister chromatids during mitosis and meiosis. Annu Rev Genet. 35, 673–745 (2001). [DOI] [PubMed] [Google Scholar]
- 24.Alipour E & Marko JF Self-organization of domain structures by DNA-loop-extruding enzymes. Nucleic Acids Res 40, 11202–11212 (2012). [DOI] [PMC free article] [PubMed] [Google Scholar]
- 25.Sanborn AL et al. Chromatin extrusion explains key features of loop and domain formation in wild-type and engineered genomes. Proc Natl Acad Sci U S A. 112, E6456–65 (2015). [DOI] [PMC free article] [PubMed] [Google Scholar]
- 26.Fudenberg G et al. Formation of chromosomal domains by loop extrusion. Cell Rep. 15, 2038–2049 (2016). [DOI] [PMC free article] [PubMed] [Google Scholar]
- 27.Fudenberg G, Abdennur N, Imakaev M, Goloborodko A & Mirny LA Emerging Evidence of Chromosome Folding by Loop Extrusion. Cold Spring Harb Symp Quant Biol 82, 45–55 (2017). [DOI] [PMC free article] [PubMed] [Google Scholar]
- 28.Rao SSP et al. Cohesin Loss Eliminates All Loop Domains. Cell 171, 305–320 e24 (2017). [DOI] [PMC free article] [PubMed] [Google Scholar]
- 29.Falk M et al. Heterochromatin drives organization of conventional and inverted nuclei. Nature 570, 395–399 (2019). [DOI] [PMC free article] [PubMed] [Google Scholar]
- 30.Nuebler J, Fudenberg G, Imakaev M, Abdennur N & Mirny LA Chromatin organization by an interplay of loop extrusion and compartmental segregation. Proc Natl Acad Sci U S A 115, E6697–E6706 (2018). [DOI] [PMC free article] [PubMed] [Google Scholar]
- 31.Di Pierro M, Zhang B, Aiden EL, Wolynes PG & Onuchic JN Transferable model for chromosome architecture. Proc Natl Acad Sci U S A 113, 12168–12173 (2016). [DOI] [PMC free article] [PubMed] [Google Scholar]
- 32.Jost D, Carrivain P, Cavalli G & Vaillant C Modeling epigenome folding: formation and dynamics of topologically associated chromatin domains. Nucleic Acids Res 42, 9553–61 (2014). [DOI] [PMC free article] [PubMed] [Google Scholar]
- 33.Erdel F & Rippe K Formation of Chromatin Subcompartments by Phase Separation. Biophys J 114, 2262–2270 (2018). [DOI] [PMC free article] [PubMed] [Google Scholar]
- 34.Michieletto D, Orlandini E & Marenduzzo D Polymer model with epigenetic recoloring reveals a pathway for the de novo establishment and 3D organization of chromatin domains. Phys. Rev. X 6, 041047 (2016). [Google Scholar]
- 35.Shi G, Liu L, Hyeon C & Thirumalai D Interphase human chromosome exhibits out of equilibrium glassy dynamics. Nat Commun 9, 3161 (2018). [DOI] [PMC free article] [PubMed] [Google Scholar]
- 36.MacPherson Q, Beltran B & Spakowitz AJ Bottom-up modeling of chromatin segregation due to epigenetic modifications. Proc Natl Acad Sci U S A 115, 12739–12744 (2018). [DOI] [PMC free article] [PubMed] [Google Scholar]
- 37.Marshall WF et al. Interphase chromosomes undergo constrained diffusional motion in living cells. Curr Biol 7, 930–939 (1997). [DOI] [PubMed] [Google Scholar]
- 38.Shinkai S, Nozaki T, Maeshima K & Togashi Y Dynamic Nucleosome Movement Provides Structural Information of Topological Chromatin Domains in Living Human Cells. PLoS Comput Biol 12, e1005136 (2016). [DOI] [PMC free article] [PubMed] [Google Scholar]
- 39.Nagashima R et al. Single nucleosome imaging reveals loose genome chromatin networks via active RNA polymerase II. J Cell Biol (2019). [DOI] [PMC free article] [PubMed] [Google Scholar]
- 40.Bronshtein I et al. Transient anomalous diffusion of telomeres in the nucleus of mammalian cells. Phys Rev Lett. 103, 018102 (2009). [DOI] [PubMed] [Google Scholar]
- 41.Hediger F, Neumann FR, Van Houwe G, Dubrana K & Gasser SM Live imaging of telomeres: yKu and Sir proteins define redundant telomere-anchoring pathways in yeast. Curr Biol. 12, 2076–2089 (2002). [DOI] [PubMed] [Google Scholar]
- 42.Bronshtein I et al. Loss of lamin A function increases chromatin dynamics in the nuclear interior. Nat Commun 6, 8044 (2015). [DOI] [PMC free article] [PubMed] [Google Scholar]
- 43.Thakar R, Gordon G & Csink AK Dynamics and anchoring of heterochromatic loci during development. J Cell Sci 119, 4165–75 (2006). [DOI] [PubMed] [Google Scholar]
- 44.Therizols P, Duong T, Dujon B, Zimmer C & Fabre E Chromosome arm length and nuclear constraints determine the dynamic relationship of yeast subtelomeres. Proc Natl Acad Sci U S A. 107, 2025–2030 (2010). [DOI] [PMC free article] [PubMed] [Google Scholar]
- 45.Zidovska A, Weitz DA & Mitchison TJ Micron-scale coherence in interphase chromatin dynamics. Proc Natl Acad Sci U S A 110, 15555–60 (2013). [DOI] [PMC free article] [PubMed] [Google Scholar]
- 46.Leibler L Theory of microphase separation in block copolymers. Macromolecules 13, 1602–1617 (1980). [Google Scholar]
- 47.de Gennes P-G Scaling theory of polymer physics, (Cornell University Press, 1979). [Google Scholar]
- 48.Matsen MW & Schick M Stable and unstable phases of a linear multiblcok copolymer melt. Macromolecules 27, 7157–7163 (1994). [DOI] [PubMed] [Google Scholar]
- 49.Dekker J, Rippe K, Dekker M & Kleckner N Capturing Chromosome Conformation. Science 295, 1306–1311 (2002). [DOI] [PubMed] [Google Scholar]
- 50.Dostie J et al. Chromosome Conformation Capture Carbon Copy (5C): A Massively Parallel Solution for Mapping Interactions between Genomic Elements. Genome Res. 16, 1299–1309 (2006). [DOI] [PMC free article] [PubMed] [Google Scholar]
- 51.Chien R et al. Cohesin mediates chromatin interactions that regulate mammalian beta-globin expression. J Biol Chem 286, 17870–8 (2011). [DOI] [PMC free article] [PubMed] [Google Scholar]
- 52.Kang Y, Kim YW, Kang J, Yun WJ & Kim A Erythroid specific activator GATA-1-dependent interactions between CTCF sites around the beta-globin locus. Biochim Biophys Acta Gene Regul Mech 1860, 416–426 (2017). [DOI] [PubMed] [Google Scholar]
- 53.Tolhuis B, Palstra RJ, Splinter E, Grosveld F & de Laat W Looping and Interaction between Hypersensitive Sites in the Active beta-globin Locus. Mol Cell 10, 1453–1465 (2002). [DOI] [PubMed] [Google Scholar]
- 54.Splinter E et al. CTCF mediates long-range chromatin looping and local histone modification in the beta-globin locus. Genes Dev. 20, 2349–2354 (2006). [DOI] [PMC free article] [PubMed] [Google Scholar]
- 55.Belaghzal H, Dekker J & Gibcus JH Hi-C 2.0: An optimized Hi-C procedure for high-resolution genome-wide mapping of chromosome conformation. Methods 123, 56–65 (2017). [DOI] [PMC free article] [PubMed] [Google Scholar]
- 56.Stephens AD, Banigan EJ, Adam SA, Goldman RD & Marko JF Chromatin and lamin A determine two different mechanical response regimes of the cell nucleus. Mol Biol Cell 28, 1984–1996 (2017). [DOI] [PMC free article] [PubMed] [Google Scholar]
- 57.Stephens AD et al. Chromatin histone modifications and rigidity affect nuclear morphology independent of lamins. Mol Biol Cell 29, 220–233 (2018). [DOI] [PMC free article] [PubMed] [Google Scholar]
- 58.Banigan EJ, Stephens AD & Marko JF Mechanics and Buckling of Biopolymeric Shells and Cell Nuclei. Biophys J 113, 1654–1663 (2017). [DOI] [PMC free article] [PubMed] [Google Scholar]
- 59.Quinodoz SA et al. Higher-Order Inter-chromosomal Hubs Shape 3D Genome Organization in the Nucleus. Cell 174, 744–757 e24 (2018). [DOI] [PMC free article] [PubMed] [Google Scholar]
- 60.Xiong K & Ma J Revealing Hi-C subcompartments by imputing high-resolution inter-chromosomal interactions. Nature Communications 10: 5069 (2019). [DOI] [PMC free article] [PubMed] [Google Scholar]
- 61.Dialynas GK et al. Plasticity of HP1 proteins in mammalian cells. J Cell Sci 120, 3415–24 (2007). [DOI] [PubMed] [Google Scholar]
- 62.Liang C & Stillman B Persistent initiation of DNA replication and chromatin-bound MCM proteins during the cell cycle in cdc6 mutants. Genes Dev 11, 3375–86 (1997). [DOI] [PMC free article] [PubMed] [Google Scholar]
- 63.Ciosk R et al. Cohesin’s binding to chromosomes depends on a separate complex consisting of Scc2 and Scc4 proteins. Mol Cell 5, 243–54 (2000). [DOI] [PubMed] [Google Scholar]
- 64.Srinivasan M et al. The Cohesin Ring Uses Its Hinge to Organize DNA Using Non-topological as well as Topological Mechanisms. Cell 173, 1508–1519 e18 (2018). [DOI] [PMC free article] [PubMed] [Google Scholar]
- 65.Gartenberg MR, Neumann FR, Laroche T, Blaszczyk M & Gasser SM Sir-mediated repression can occur independently of chromosomal and subnuclear contexts. Cell. 119, 955–967 (2004). [DOI] [PubMed] [Google Scholar]
- 66.Gibson BA et al. Organization of Chromatin by Intrinsic and Regulated Phase Separation. Cell 179(2):470–484.e21 (2019). [DOI] [PMC free article] [PubMed] [Google Scholar]
- 67.Larson AG et al. Liquid droplet formation by HP1alpha suggests a role for phase separation in heterochromatin. Nature 547, 236–240 (2017). [DOI] [PMC free article] [PubMed] [Google Scholar]
- 68.Tatavosian R et al. Nuclear condensates of the Polycomb protein chromobox 2 (CBX2) assemble through phase separation. J Biol Chem 294, 1451–1463 (2019). [DOI] [PMC free article] [PubMed] [Google Scholar]
- 69.Plys AJ et al. Phase separation of Polycomb-repressive complex 1 is governed by a charged disordered region of CBX2. Genes Dev (2019). [DOI] [PMC free article] [PubMed] [Google Scholar]
- 70.Kaustov L et al. Recognition and specificity determinants of the human cbx chromodomains. J Biol Chem 286, 521–9 (2011). [DOI] [PMC free article] [PubMed] [Google Scholar]
- 71.Ferraiuolo MA, Sanyal A, Naumova N, Dekker J & Dostie J From cells to chromatin: capturing snapshots of genome organization with 5C technology. Methods 58, 255–267 (2012). [DOI] [PMC free article] [PubMed] [Google Scholar]
- 72.Lajoie BR, van Berkum NL, Sanyal A & Dekker J My5C: web tools for chromosome conformation capture studies. Nat. Methods 6, 690–691 (2009). [DOI] [PMC free article] [PubMed] [Google Scholar]
Associated Data
This section collects any data citations, data availability statements, or supplementary materials included in this article.
Supplementary Materials
Data Availability Statement
All sequencing data have been submitted to a public data repository (GEO; accession number GSE134590). Data are available through the 4D Nucleome data portal.


