Abstract
Spontaneous brain activities consume most of the brain’s energy. So if we want to understand how the brain operates, we must take into account these spontaneous activities. Up and down transitions of membrane potentials are considered to be one of significant spontaneous activities. This kind of oscillation always shows bistable and bimodal distribution of membrane potentials. Our previous theoretical studies on up and down oscillations mainly looked at the ion channel dynamics. In this paper, we focus on energy feature of spontaneous up and down transitions based on a network model and its simulation. The simulated results indicate that the energy is a robust index and distinguishable of excitatory and inhibitory neurons. Meanwhile, one the whole, energy consumption of neurons shows bistable feature and bimodal distribution as well as the membrane potential, which turns out that the indicator of energy consumption encodes up and down states in this spontaneous activity. In detail, energy consumption mainly occurs during up states temporally, and mostly concentrates inside neurons rather than synapses spatially. The stimulation related energy is small, indicating that energy consumption is not driven by external stimulus, but internal spontaneous activity. This point of view is also consistent with brain imaging results. Through the observation and analysis of the findings, we prove the validity of the model again, and we can further explore the energy mechanism of more spontaneous activities.
Keywords: Up and down states, Spontaneous activity, Energy consumption, Energy feature
Introduction
Brain imaging shows that spontaneous brain activities consume most of the brain’s energy at rest (Raichle and Mintun 2006; Fox and Raichle 2007; Buzsaki and Draguhn 2004; Laufs et al. 2003). But most studies on brain always focus on its response to tasks or stimulus. So if we want to understand how the brain works, we must take into account these spontaneous activities, which consume most energy. The periodic up and down transitions of membrane potentials is considered to be one kind of significant spontaneous activities, which have been found in many vivo and vitro neural electrophysiology experiments (Parga and Abbott 2007; Petersen et al. 2003; Lampl et al. 1999; Steriade et al. 1993). This kind of subthreshold spontaneous oscillation always shows bistable and bimodal distribution of membrane potentials (Parga and Abbott 2007; Petersen et al. 2003; Anderson et al. 2000; Compte et al. 2003).
Our previous theoretical studies on up and down oscillations mainly looked at the ion channel dynamics. We introduced and demonstrated three significant characteristics—bistability, directivity and spontaneity—of membrane potential up and down transition at the single neuron and network level (Xu and Wang 2014, 2013). Further, we put forward a neural network model of spontaneous up and down transitions conforming to the physiological mechanism better, and explored the factors that influence spontaneous transitions, synchronous transitions and suprathreshold spontaneous firing of up and down activities (Xu et al. 2016, 2017; Wang et al. 2018c). Now, in this paper, we focus on the energy feature of up and down activities, and hope to add the literature studying spontaneous neural activities’ energy.
Some ideas have been put forward in studies of brain energy (Zhu et al. 2018; Wang and Rubin 2014; Wang et al. 2018a; Khajehpour et al. 2019; Déli et al. 2017; Xu et al. 2019; Daneshi et al. 2020; Balasubramani and Chakravarthy 2020) and state transition (Mora-Sánchez et al. 2019; Schöller et al. 2018; Sen et al. 2020). In previous studies, some researchers proposed the theory of energy coding and revealed mechanisms of brain information processing in biological neural networks (Wang et al. 2008, 2015). When studying the formation of long-term memory, we also developed methods to measure the changes in energy input and energy consumption of the memory system (Wang et al. 2018b, 2019; Zheng et al. 2014; Zheng et al. 2016).
In this paper, we focus on energy feature of spontaneous up and down transitions based on a network model and its simulation. The simulated results indicate that the energy is a robust index and distinguishable of excitatory and inhibitory neurons. Meanwhile, one the whole, energy consumption of neurons shows bistable feature and bimodal distribution as well as the membrane potential, which turns out that the indicator of energy consumption encodes up and down states in this spontaneous activity. In detail, energy consumption mainly occurs during up states temporally, and mostly concentrates inside neurons rather than synapses spatially. The stimulation related energy is small, indicating that energy consumption is not driven by external stimulus, but internal spontaneous activity. This point of view is also consistent with brain imaging results. Through the observation and analysis of the findings, we prove the validity of the model again, and we can further explore the energy mechanism of more spontaneous activities.
Methods
Model and parameters
Both excitatory and inhibitory neurons were took into consideration in this paper. Main dynamical equations for excitatory and inhibitory neurons are described as follows, respectively.
| 1 |
| 2 |
Here, intrinsic currents, a fast sodium current (), a persistent sodium current (), a slow h-like current (), a slow potassium current (), a leak current (), and synaptic currents, , , , are integrated together, which described in detail later. The membrane capacitance . The external stimulation current, , is a pulse current adding to excitatory neurons.
Roughly speaking, the fast sodium current is also known as transient sodium current, and the persistent one is also called as slow sodium current. The fast sodium current has a rapid activation variable and an inactivation one. While the persistent sodium current activates instantaneously and it does not inactivate. The word slow in its name refers to inactivation. These two kinds of sodium currents are given by Golomb and Amitai (1997) and Loewenstein et al. (2005)
| 3 |
and
| 4 |
The slow h-like current is an inward voltage-gated current, involving sodium and potassium ions. So the reversal potential lies between that of sodium and that of potassium. This kind of current requires hyperpolarization to become active, and then it repolarizes the membrane potential. The activation curve decreases monotonically, so it’s also called sag current (Ermentrout and Terman 2010). It can be described by (Loewenstein et al. 2005)
| 5 |
The potassium current is a slow outward current given by (Loewenstein et al. 2005)
| 6 |
The leak current is described by
| 7 |
Here, we considered three types of synaptic currents, including two excitatory currents and one inhibitory one. The excitatory currents are mediated by excitatory neurotransmitter—Glutamate. The receptors called AMPA are responsible for most of the fast excitatory synaptic transmission, and those called NMDA are responsible for the slow process. So there is a slow component of the NMDA synaptic receptor (Destexhe et al. 1994) in the following equations. Here, [T] is the transmitter concentration (Koch and Segev 1998). On the other hand, inhibitory neurotransmitter GABA mediates the GABAA receptors which mainly acts on excitatory neurons generously. Equations for the above three synaptic currents are given by
| 8 |
| 9 |
| 10 |
In these equations, the variables , and are defined as the degree of opening of the protein channels, with and representing the forward and backward constants, respectively.
Value of the above parameters for intrinsic currents used in this paper is given in Table 1, and that for synaptic currents is displayed in Table 2 (Destexhe et al. 1994; Koch and Segev 1998; Golomb and Amitai 1997; Loewenstein et al. 2005).
Table 1.
Parameters for intrinsic currents
| Current | Parameter | Value |
|---|---|---|
| 12 ms/cm | ||
| 55 mV | ||
| − 30 mV | ||
| 9.5 mV | ||
| − 53 mV | ||
| − 7 mV | ||
| − 40.5 mV | ||
| − 6 mV | ||
| 0.06 ms/cm | ||
| 55 mV | ||
| − 53.8 mV | ||
| 3 mV | ||
| 0.2 ms/cm | ||
| − 30 mV | ||
| − 76.4 mV | ||
| 20 mV | ||
| − 2.89/(mV s) | ||
| − 445/s | ||
| 24.02 mV | ||
| 27.1/(mV s) | ||
| − 1024/s | ||
| − 17.4 mV | ||
| 0.165 ms/cm | ||
| − 85 mV | ||
| − 54 mV | ||
| 5 mV | ||
| 3000 ms | ||
| 0.1 ms/cm | ||
| − 70 mV |
Table 2.
Parameters for synaptic currents
| Current | Parameter | Value |
|---|---|---|
| 0.9 ms/cm | ||
| 0 mV | ||
| 1 | ||
| 0.2 | ||
| 1 | ||
| 5 mV | ||
| 2 mV | ||
| 0.9 ms/cm | ||
| 0 mV | ||
| 0.072 | ||
| 0.0067 | ||
| − 25 mV | ||
| 12.5 mV | ||
| 1 | ||
| 5 mV | ||
| 2 mV | ||
| 1 ms/cm | ||
| − 80 mV | ||
| 5 | ||
| 0.18 | ||
| 1 | ||
| 5 mV | ||
| 2 mV |
The synaptic weight from the model neuron i to j is defined as w(i, j), the value of which depends on the network topology that one excitatory neuron is excited by other four connected excitatory neurons and inhibited by one connected inhibitory neuron, while one inhibitory neuron is only excited by four excitatory neurons but without inhibition from other inhibitory ones. We built a network model that 80% neurons in the network are excitatory ones and the rest are inhibitory ones, which also employed in our previous study (Xu et al. 2016, 2017; Wang et al. 2018c). Network size we adopt in this paper depends on the simulation tests, but most of them are more than 500, making the synaptic weight a sparse asymmetric matrix.
Analyses of simulated results
In the next section, we consider three indicators, the mean firing rate, mean synchronous rate and mean energy consumption, to characterize the up and down activities of the network, which we introduce as follows.
First, mean firing rate of the network is an indicator to measure the degree of spontaneous firing activity in the up and down network. Let be the spiking sequence of a model neuron i at time t, when it fires, the value is 1, otherwise assigns 0. Then, the firing rate of the model neuron i is defined by the total counts of spikes per second. Mean firing rate of the network is characterized by the average value of firing rate of all the neurons in the network.
On the other hand, we use mean synchronization rate to characterize the degree of synchronous activity of the network. Let , be membrane potential sequences of two model neurons i and j at time t. Here, we adopt Pearson correlation coefficient of these two sequences to depict synchronization between two neurons. According to this definition, it is obvious that the correlation coefficient matrix is a symmetric matrix with all elements between − 1 and 1. Then, mean synchronization rate of the network is given by the average value of all the correlation coefficients of every two neurons in the network. Specific calculation formulas for these two indicators were given in our former work (Wang et al. 2018c).
Here, we also take into consideration the types of excitatory and inhibitory neurons, respectively. Therefore, we average firing rates and synchronization rates according to the neuron types for further analysis.
The third one, mean energy consumption, is a new indicator we introduce here, which is mainly discussed and analysed in this paper. Let be the energy consumption of a model neuron i at time t, which is given by a dynamical equation as follows.
| 11 |
| 12 |
The energy discussed in this manuscript is based on the following two hypotheses, which supported by our previous study on neural energy supply-consumption properties on the Hodgkin–Huxley model (Wang et al. 2017). First, we regard metabolic energy as the net metabolic energy which is the difference between metabolic energy supply and consumption, and the sum effect is energy supply for model neurons and network. Second, we hypothesize net metabolic energy supply is equal to the energy consumption of model neurons and network, means, power of currents.
And we define energy gradient as power. So we consider both energy curve and power curve to characterize the energy consumption of one neuron. Similar to another two indicators, we define mean energy consumption of the network by calculating the average value.
All the following analyses and results were done with custom scripts written in MATLAB.
Results
The energy index is robust and distinguishable of excitatory and inhibitory neurons
In this section, we considered all three indicators mentioned above, mean firing rate, mean synchronous rate and mean energy consumption, to characterize the up and down activities of the network.
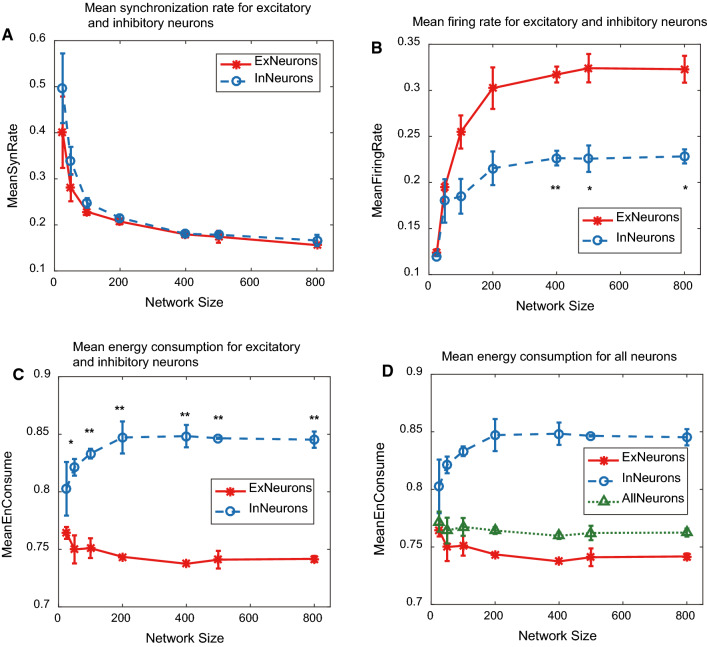
As network size increasing, these three indicators illustrated different changing trends as shown in Fig. 1. Compared with mean synchronous rate (subplot Fig. 1a), or mean firing rate (subplot Fig. 1b), mean energy consumption (subplot Fig. 1d, the green dotted line) was more robust to network size, also with good distinction between excitatory and inhibitory neurons (subplot Fig. 1c, red solid line for excitatory neurons, blue dash line for inhibitory ones), P value 0.01 (marked by **) for most data, which the other two indicators were fail to differentiate them.
Fig. 1.
The network size-dependent change of three indicators. a Mean synchronization rate for excitatory and inhibitory neurons. b Mean firing rate for excitatory and inhibitory neurons. c Mean energy consumption for excitatory and inhibitory neurons. d Mean energy consumption for all neurons (the green dotted line) in the network. (Color figure online)
It is fair to say that the energy consumption is a better indicator with two advantages to characterize the network activities. So we would like to discuss the energy feature of up and down activities in the following sections.
Energy gradient shows bimodal distribution similar to membrane potential distribution
In this section, we mainly concerned about the overall distribution characteristics of energy consumption.
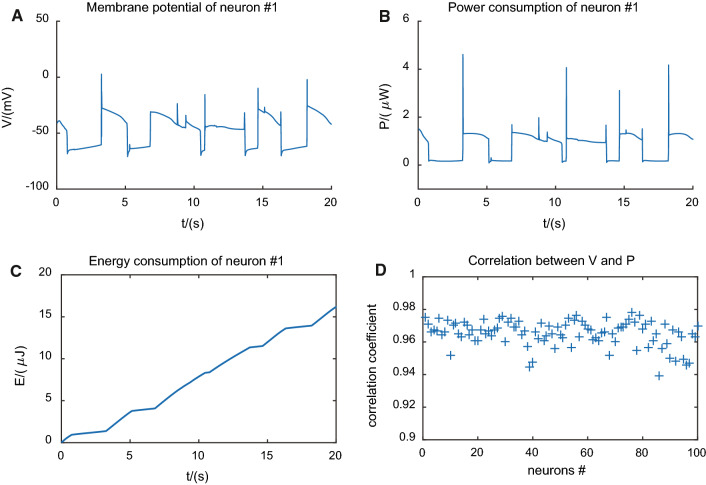
In the case of spontaneous activity, the energy consumption of neurons showed bistable feature and bimodal distribution as well as the membrane potential. In Fig. 2a, b, we gave spontaneous membrane potential activity and power consumption of an example neuron #1, respectively. They both exhibited two preferred states, the so-called up and down states, and also had high relevance between each other.
Fig. 2.
Energy gradient of one single neuron shows up and down oscillations similar to membrane potential oscillations. a Membrane potential of neuron#1. b Power consumption of neuron#1. c Energy consumption of neuron#1. d Correlation between membrane potential and power consumption of neurons in the network
Other neurons in the network showed the same results. The correlation coefficients of all the neurons in the network was very close to 1, which were quantitatively depicted in subplot Fig. 2d. Therefore, as it turned out, the indicator of energy consumption encoded up and down states in this spontaneous activity.
In subplot Fig. 2c, we gave the energy consumption of the example neuron #1 versus time curve. Comparing subfigures Fig. 2a, c, it was obvious that the slope of energy consumption of up states was larger than that of down states, indicating that energy consumption was mainly took place during up states.
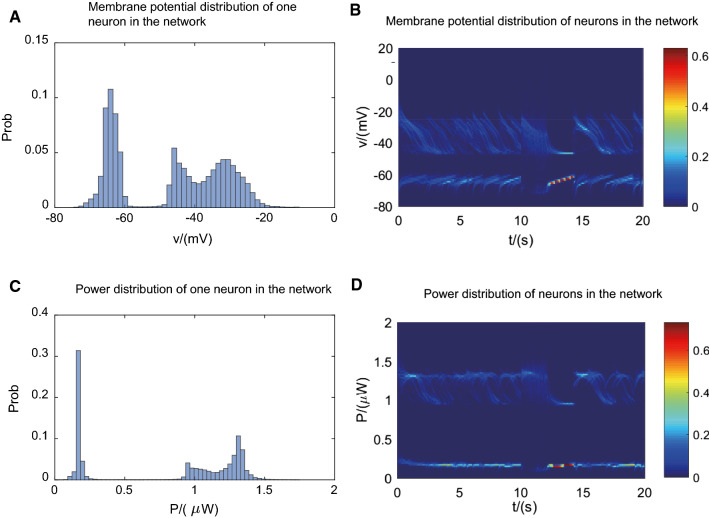
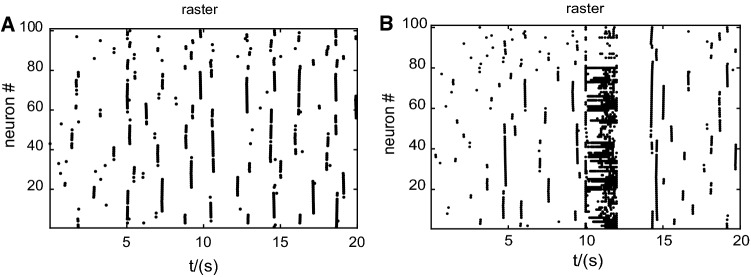
In Fig. 3, we also considered the circumstance of existence of external stimulus. We found from Figs. 2 and 3 that power and membrane potential was always stable in two states and both showed bimodal distribution, whenever in spontaneous activities or during continuous external stimulus. In subplots Fig. 3a, c, it showed membrane potential and power distribution of one neuron, while those of all neurons in the network were displayed in subplots Fig. 3b, d. Here, we added 2 s impulse current from 10 to 12 s. After that, membrane potential was deprived of spiking activity so that it kept for a longer period in down state. And then it returned to spontaneous bistable activity again. The spike raster plots of all the neurons in the network, which exhibited in Fig. 4 also indicated the same results.
Fig. 3.
Power and membrane potential are always stable at two states and both show bimodal distribution, whenever in spontaneous activities or during continuous external stimulus (10–12 s). a Membrane potential distribution of one neuron in the network. b Membrane potential distribution of all the neurons in the network. c Power distribution of one neuron in the network. d Power distribution of all the neurons in the network
Fig. 4.
Spike raster plots of neurons in the network. a In the case of spontaneous oscillations. b In the case of 2 s external stimulus from 10–12 s
Network membrane potential activity indicated by spike raster in Fig. 4a demonstrated low spiking rate (about 0.2–0.3 Hz) and low spiking synchronicity in spontaneous oscillations. Obviously, during 2 s external stimulus, the spiking rate increased, especially for excitatory neurons as was shown in Fig. 4b. And spiking of all the neurons was inhibited lasting almost 2 s after that, which resulted in synchronous firing immediately after that inhibition. Afterwards, it came back to spontaneous activity again.
Energy consumption features of spontaneous up and down activities
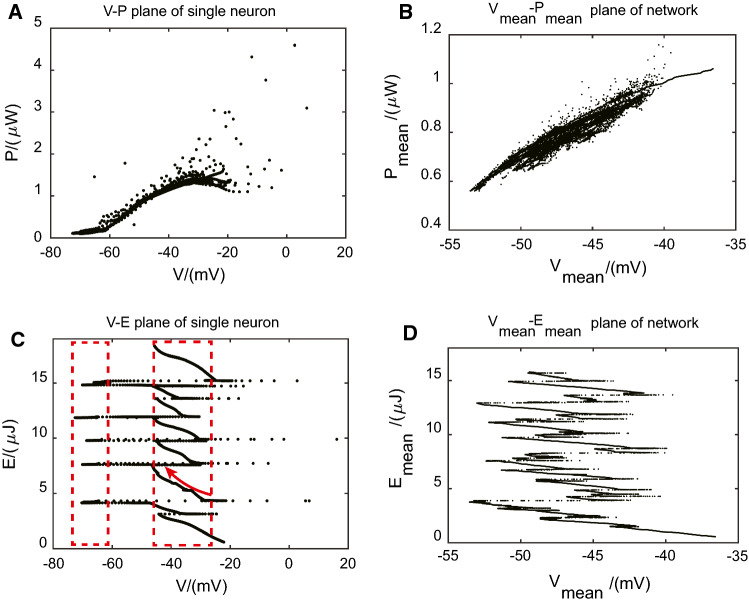
First, we analyzed temporal difference in energy consumption. In Fig. 5, we gave four subfigures demonstrating membrane potential versus energy consumption planes of a single neuron and network, respectively.
Fig. 5.
Membrane potential versus energy consumption planes of a single neuron and network, respectively. a Membrane potential versus energy consumption rate plane of a single neuron. b Mean membrane potential versus mean energy consumption rate plane of the network. c Membrane potential versus energy consumption plane of a single neuron. d Mean membrane potential versus mean energy consumption plane of the network
In subfigure Fig. 5c, we gave membrane potential versus energy consumption plane of a single neuron with two rectangle boxes referring to down states and up states, respectively. It indicated that the increase of the energy consumption mainly occurred during up states, as indicated by the red arrow. While energy consumption during down states and even spikes was very low compared with those during up states, which was in accordance with the result of Fig. 2c.
The relationship between mean membrane potential and mean energy consumption of network also showed the same feature that most of the energy consumption took place during up states as illustrated in subfigure Fig. 5d. In subfigure Fig. 5a, b, we found the higher energy consumption rate assembled in up states, and there existed a positive correlation between energy consumption rate and membrane potential in up states.
All these results suggested that, in spontaneous up and down oscillations, much energy was utilized to maintain the membrane potential stable at these up states, rather than to induce some occasional action potentials. This point of view was consistent with brain imaging results (Raichle and Mintun 2006; Fox and Raichle 2007) that task-related increases in neuronal metabolism are usually small when compared with resting energy consumption.
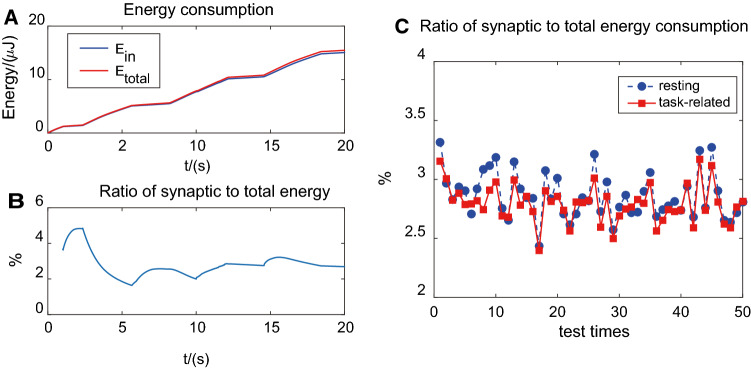
Then, we considered the spatial difference in energy consumption. In Fig. 6, we showed the intrinsic and synaptic energy consumption of one neuron and network.
Fig. 6.
Intrinsic and synaptic energy consumption of a single neuron and network. a Intrinsic and total energy consumption of one neuron in the network. b Ratio of synaptic to total energy consumption of one neuron in the network. c Mean ratio of synaptic to total energy consumption of all the neurons in the network
We could find directly from Fig. 6a that internal and total energy consumption of one single neuron was very close to each other, while the synaptic one, the difference between these two curves, was quite small. So in Fig. 6b, we calculated the ratio of synaptic to total energy consumption, and the percentage was around 2–3%, with or without external stimulus. Here, we also added 2 s continuous stimulations from 10 to 12 s as mentioned before.
Cases of all the neurons were also examined, and the results were demonstrated in Fig. 6c. The average ratio of synaptic to total energy consumption of all the neurons during spontaneous period (marked by blue circles) and stimulus period (marked by red squares) were both near about 3% and no significant difference between them.
The results indicated that internal energy consumption accounted for a much more significant share in total consumption than synaptic one, and stimulus had little influence in it.
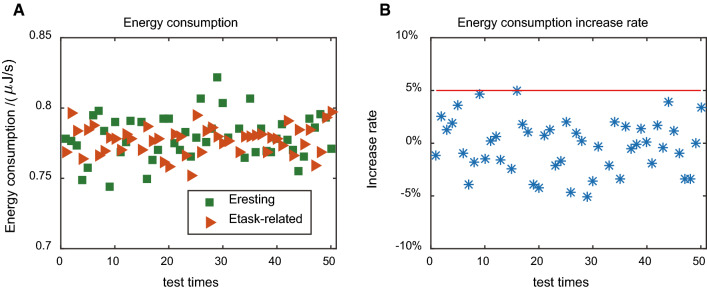
So we further studied the role of stimulus in energy consumption, and the results were shown in Fig. 7. We computed average energy consumption of all the neurons both in spontaneous period and in the stimulation period, marked by green squares and orange triangles, respectively, for one test. In Fig. 7a, we gave the results for 50 tests, and it displayed similar energy consumption without significant difference.
Fig. 7.
Spontaneous and stimulation related energy consumption of neurons in the network. a Mean energy consumption of neurons in the network during spontaneous and stimulated periods. b Stimulation related increases in energy consumption of neurons in the network
Meanwhile, we calculated the increase rate of energy consumption after stimulation. It turned out that the energy consumption increase rates in stimulation period were usually less than 5% when compared with this large spontaneous energy consumption, as demonstrated in Fig. 7b. This point of view was also consistent with brain imaging results (Raichle and Mintun 2006; Fox and Raichle 2007) again.
In summary, we observed energy consumption features of spontaneous up and down activities in this section. Temporally, energy consumption mainly occurred during up states, and mostly concentrated in neurons rather than synapses, spatially. Comparing to spontaneous resting energy consumption, the stimulation related energy was small, indicating that energy consumption was not driven by external stimulus, but internal spontaneous activity. Therefore, if we would like to understand the brain, we must consider this spontaneous activity that consumes most of energy.
Conclusion
In this paper, we mainly discussed about the energy features of spontaneous up and down neural activities based on a network model and its simulation. First, we considered three indicators—the mean firing rate, mean synchronous rate and mean energy consumption—to characterize the up and down activities of the network, and found that compared to another two indicators, the energy index was robust and distinguishable of excitatory and inhibitory neurons. So it could be a better indicator and should deserve more attention when studying neural activities.
Then, we focused on the whole energy consumption distribution and the components playing the leading roles. Overall, energy gradient of neurons showed bistable feature and bimodal distribution as well as the membrane potential, which indicating that the energy consumption index also encoded up and down states in this spontaneous activity as the membrane potential did.
Further more, we studied the components playing the leading roles in detail. It turned out that, temporally, energy consumption mainly occurred during up states, and spatially, it mostly accumulated inside neurons rather than synapses between neurons. Comparing the energy consumption before stimulation with that during stimulation, we found that the stimulation related energy was small, indicating that energy consumption was not driven by external stimulus, but internal spontaneous activity. This point of view was in line with brain imaging results (Raichle and Mintun 2006; Fox and Raichle 2007) that task-related increases in neuronal metabolism are usually small when compared with resting energy consumption.
Therefore, we proved the validity of our model again in this paper, and through the observation and analysis of the findings, we believe that these results shed light on the energy feature of spontaneous up and down activities, which also laid the foundation for further exploration on the energy mechanism of more spontaneous activities.
Acknowledgements
This work is supported by the National Natural Science Foundation of China (Nos. 11702096, 11802095, 11972159), the Natural Science Foundation of Shanghai (No. 19zr1473100) and the Fundamental Research Funds for the Central Universities (Nos. 222201714020, 22201814025). We also thank reviewers for comments on the manuscript to improve our work.
Footnotes
Publisher's Note
Springer Nature remains neutral with regard to jurisdictional claims in published maps and institutional affiliations.
References
- Anderson J, Lampl I, Reichova I, Carandini M, Ferster D. Stimulus dependence of two-state fluctuations of membrane potential in cat visual cortex. Nat Neurosci. 2000;3(6):617–621. doi: 10.1038/75797. [DOI] [PubMed] [Google Scholar]
- Balasubramani PP, Chakravarthy VS. Bipolar oscillations between positive and negative mood states in a computational model of Basal Ganglia. Cogn Neurodyn. 2020;14:181–202. doi: 10.1007/s11571-019-09564-7. [DOI] [PMC free article] [PubMed] [Google Scholar]
- Buzsaki G, Draguhn A. Neuronal oscillations in cortical networks. Science. 2004;304(5679):1926–1929. doi: 10.1126/science.1099745. [DOI] [PubMed] [Google Scholar]
- Compte A, Sanchez-Vives MV, McCormick DA, Wang XJ. Cellular and network mechanisms of slow oscillatory activity (< 1 Hz) and wave propagations in a cortical network model. J Neurophysiol. 2003;89:2707–2725. doi: 10.1152/jn.00845.2002. [DOI] [PubMed] [Google Scholar]
- Daneshi A, Azarnoush H, Towhidkhah F, Bernardin D, Faubert J. Brain activity during time to contact estimation: an EEG study. Cogn Neurodyn. 2020;14:155–168. doi: 10.1007/s11571-019-09563-8. [DOI] [PMC free article] [PubMed] [Google Scholar]
- Déli E, Tozzi A, Peters JF. Relationships between short and fast brain timescales. Cogn Neurodyn. 2017;11(6):539–552. doi: 10.1007/s11571-017-9450-4. [DOI] [PMC free article] [PubMed] [Google Scholar]
- Destexhe A, Mainen ZF, Sejnowski TJ. Synthesis of models for excitable membranes, synaptic transmission and neuromodulation using a common kinetic formalism. J Comput Neurosci. 1994;1(3):195–230. doi: 10.1007/BF00961734. [DOI] [PubMed] [Google Scholar]
- Ermentrout GB, Terman DH. Mathematical foundations of neuroscience. Berlin: Springer; 2010. [Google Scholar]
- Fox MD, Raichle ME. Spontaneous fluctuations in brain activity observed with functional magnetic resonance imaging. Nat Rev Neurosci. 2007;8(9):700–711. doi: 10.1038/nrn2201. [DOI] [PubMed] [Google Scholar]
- Golomb D, Amitai Y. Propagating neuronal discharges in neocortical slices: computational and experimental study. J Neurophysiol. 1997;78(3):1199–211. doi: 10.1152/jn.1997.78.3.1199. [DOI] [PubMed] [Google Scholar]
- Khajehpour H, Mohagheghian F, Ekhtiari H, Makkiabadi B, Jafari AH, Eqlimi E, Harirchian MH. Computer-aided classifying and characterizing of methamphetamine use disorder using resting-state eeg. Cogn Neurodyn. 2019;13(6):519–530. doi: 10.1007/s11571-019-09550-z. [DOI] [PMC free article] [PubMed] [Google Scholar]
- Koch C, Segev I. Methods in neuronal modeling: from ions to networks. Cambridge: MIT Press; 1998. [Google Scholar]
- Lampl I, Reichova I, Ferster D. Synchronous membrane potential fluctuations in neurons of the cat visual cortex. Neuron. 1999;22(2):361–374. doi: 10.1016/S0896-6273(00)81096-X. [DOI] [PubMed] [Google Scholar]
- Laufs H, Krakow K, Sterzer P, et al. Electroencephalographic signatures of attentional and cognitive default modes in spontaneous brain activity fluctuations at rest. Proc Natl Acad Sci USA. 2003;100(19):11053–11058. doi: 10.1073/pnas.1831638100. [DOI] [PMC free article] [PubMed] [Google Scholar]
- Loewenstein Y, Mahon S, Chadderton P, Kitamura K, Sompolinsky H, Yarom Y, Häusser M. Bistability of cerebellar purkinje cells modulated by sensory stimulation. Nat Neurosci. 2005;8(2):202–211. doi: 10.1038/nn1393. [DOI] [PubMed] [Google Scholar]
- Mora-Sánchez A, Dreyfus G, Vialatte FB. Scale-free behaviour and metastable brain-state switching driven by human cognition, an empirical approach. Cogn Neurodyn. 2019;13(5):437–452. doi: 10.1007/s11571-019-09533-0. [DOI] [PMC free article] [PubMed] [Google Scholar]
- Parga N, Abbott LF. Network model of spontaneous activity exhibiting synchronous transitions between up and down states. Front Neurosci. 2007;1(1):57. doi: 10.3389/neuro.01.1.1.004.2007. [DOI] [PMC free article] [PubMed] [Google Scholar]
- Petersen CC, Hahn TT, Mehta M, Grinvald A, Sakmann B. Interaction of sensory responses with spontaneous depolarization in layer 2/3 barrel cortex. Proc Natl Acad Sci. 2003;100(23):13638–13643. doi: 10.1073/pnas.2235811100. [DOI] [PMC free article] [PubMed] [Google Scholar]
- Raichle ME, Mintun MA. Brain work and brain imaging. Annu Rev Neurosci. 2006;29(1):449–476. doi: 10.1146/annurev.neuro.29.051605.112819. [DOI] [PubMed] [Google Scholar]
- Schöller H, Viol K, Aichhorn W, Hütt MT, Schiepek G. Personality development in psychotherapy: a synergetic model of state-trait dynamics. Cogn Neurodyn. 2018;12(5):441–459. doi: 10.1007/s11571-018-9488-y. [DOI] [PMC free article] [PubMed] [Google Scholar]
- Sen S, Daimi SN, Watanabe K, Takahashi K, Bhattacharya J, Saha G. Switch or stay?: Automatic classification of internal mental states in bistable perception. Cogn Neurodyn. 2020;14(1):95–113. doi: 10.1007/s11571-019-09548-7. [DOI] [PMC free article] [PubMed] [Google Scholar]
- Steriade M, Nuñez A, Amzica F. Intracellular analysis of relations between the slow (< 1 Hz) neocortical oscillation and other sleep rhythms of the electroencephalogram. J Neurosci. 1993;13(8):3266–3283. doi: 10.1523/JNEUROSCI.13-08-03266.1993. [DOI] [PMC free article] [PubMed] [Google Scholar]
- Wang Z, Rubin W. Energy distribution property and energy coding of a structural neural network. Front Comput Neurosci. 2014;8:14. doi: 10.3389/fncom.2014.00014. [DOI] [PMC free article] [PubMed] [Google Scholar]
- Wang R, Zhang Z, Chen G. Energy function and energy evolution on neuronal populations. IEEE Trans Neural Netw. 2008;19(3):535–538. doi: 10.1109/TNN.2007.914177. [DOI] [PubMed] [Google Scholar]
- Wang R, Tsuda I, Zhang Z. A new work mechanism on neuronal activity. Int J Neural Syst. 2015;25(03):1450037. doi: 10.1142/S0129065714500373. [DOI] [PubMed] [Google Scholar]
- Wang Y, Wang R, Xu X. Neural energy supply-consumption properties based on Hodgkin–Huxley model. Neural Plast. 2017;2017:6207141. doi: 10.1155/2017/6207141. [DOI] [PMC free article] [PubMed] [Google Scholar]
- Wang R, Wang Z, Zhu Z. The essence of neuronal activity from the consistency of two different neuron models. Nonlinear Dyn. 2018;92(3):973–982. doi: 10.1007/s11071-018-4103-7. [DOI] [Google Scholar]
- Wang Y, Xu X, Wang R. An energy model of place cell network in three dimensional space. Front Neurosci. 2018;12:264. doi: 10.3389/fnins.2018.00264. [DOI] [PMC free article] [PubMed] [Google Scholar]
- Wang Y, Xu X, Wang R. Intrinsic sodium currents and excitatory synaptic transmission influence spontaneous firing in up and down activities. Neural Netw. 2018;98:42–50. doi: 10.1016/j.neunet.2017.10.008. [DOI] [PubMed] [Google Scholar]
- Wang Y, Xu X, Zhu Y, Wang R. Neural energy mechanism and neurodynamics of memory transformation. Nonlinear Dyn. 2019;97(1):697–714. doi: 10.1007/s11071-019-05007-4. [DOI] [Google Scholar]
- Xu X, Wang R (2013) Neurodynamics of up and down transitions in network model. In: Abstract and applied analysis, vol 2013, Article ID 486178
- Xu X, Wang R. Neurodynamics of up and down transitions in a single neuron. Cogn Neurodyn. 2014;8(6):509–515. doi: 10.1007/s11571-014-9298-9. [DOI] [PMC free article] [PubMed] [Google Scholar]
- Xu X, Ni L, Wang R. A neural network model of spontaneous up and down transitions. Nonlinear Dyn. 2016;84(3):1541–1551. doi: 10.1007/s11071-015-2587-y. [DOI] [Google Scholar]
- Xu X, Ni L, Wang R. Synchronous transitions of up and down states in a network model based on stimulations. J Theor Biol. 2017;412:130–137. doi: 10.1016/j.jtbi.2016.10.012. [DOI] [PubMed] [Google Scholar]
- Xu Y, Ma J, Zhan X, Yang L, Jia Y. Temperature effect on memristive ion channels. Cogn Neurodyn. 2019;13(1):601–611. doi: 10.1007/s11571-019-09547-8. [DOI] [PMC free article] [PubMed] [Google Scholar]
- Zheng HW, Wang R, Qiao L, Du Y. The molecular dynamics of neural metabolism during the action potential. Sci China Technol Sci. 2014;57(5):857–863. doi: 10.1007/s11431-014-5530-4. [DOI] [Google Scholar]
- Zheng H, Wang R, Qu J. Effect of different glucose supply conditions on neuronal energy metabolism. Cogn Neurodyn. 2016;10:563–571. doi: 10.1007/s11571-016-9401-5. [DOI] [PMC free article] [PubMed] [Google Scholar]
- Zhu Z, Rubin W, Fengyun Z. The energy coding of a structural neural network based on the Hodgkin–Huxley model. Front Neurosci. 2018;12:122. doi: 10.3389/fnins.2018.00122. [DOI] [PMC free article] [PubMed] [Google Scholar]


