

Abstract
Protein malnutrition during gestation alters brain development and produces specific behavioral and cognitive changes that persist into adulthood and increase the risks of neuropsychiatric disorders. Given evidence for the role of the prefrontal cortex in such diseases, it is significant that studies in humans and animal models have shown that prenatal protein malnutrition specifically affects functions associated with prefrontal cortex. However, the neural basis underlying these changes is unclear. In the current study, prenatally malnourished and control rats performed a sustained attention task with an unpredictable distractor, a task that depends on intact prefrontal cortical function. Radiolabeled 2-deoxyglucose was used to measure neural and brain network activity during the task. Results confirmed that adult prenatally malnourished rats were more distractible than controls and exhibited lower functional activity in prefrontal cortices. Thus, prefrontal activity was a predictor of task performance in controls but not prenatally malnourished animals. Instead, prenatally malnourished animals relied on different brain networks involving limbic structures such as the hippocampus. These results provide evidence that protein reduction during brain development has more wide-reaching effects on brain networks than previously appreciated, resulting in the formation of brain networks that may reflect compensatory responses in prenatally malnourished brains.
Keywords: Prenatal protein malnutrition, brain development, undernutrition, attention, prefrontal cortex
Introduction
Malnutrition during brain development produces effects on brain structure and function that persist throughout the lifespan. In humans, early life malnutrition produces impairments in adult behavior and cognitive function, including reductions in measures of intelligence, cognitive flexibility and visuospatial processing capabilities, along with increased impulsivity, inattention and attentional dysregulation (DeRooij et al., 2010; Galler et al., 2012; Waber, Bryce, Fitzmaurice, 2014; Waber, Bryce, Girard. 2014). Many of the identified cognitive impairments observed after early life malnutrition are in domains mediated by the prefrontal cortex (Galler, Ramsey, Solimano, Lowell and Mason, 1983; Galler, Ramsey, Solimano and Lowell, 1983; Galler et al., 1990; Galler et al., 2012; Waber, Bryce, Girard. 2014; Peter et al., 2016), but the neural bases of these changes have been difficult to investigate in humans. Preclinical studies from our laboratory have shown that rats with prenatal protein malnutrition exhibit many of the same behavioral deficits, are impaired on attentional tasks as adults, and exhibit a hypometabolism of prefrontal brain regions (McGaughy et al., 2014; Peter et al., 2016; Newman et al., 2019). While the prefrontal cortex appears to be susceptible to the effects of prenatal protein malnutrition, a more complete understanding of the impact of prenatal protein malnutrition on the brain requires a thorough analysis of the brain networks that underlie performance of a prefrontally-mediated task.
In the current study, we trained a group of prenatal protein malnutrition and control rats on a previously validated test of sustained attention (McGaughy and Sarter, 1995) that depends in large part on the integrity of the prefrontal cortex (Newman and McGaughy, 2008, 2011) and is sensitive to prenatal malnutrition (Newman et al., 2019). After training to criterion, 2-deoxyglucose (2DG) was used to label loci of neural activity during the task in both groups of rats. Levels of neural activity were quantified, and graph theoretical methods used to derive and compare functional brain networks, an approach commonly used to evaluate network structure in imaging techniques such as positron emission tomography and functional MRI imaging (Bullmore and Sporns, 2009). We hypothesized that prenatal malnourished animals would be impaired in the sustained attention task, and that this impairment would be associated with a reduction of neural activity in prefrontal cortical areas as well as changes in brain network organization relative to controls.
Materials and Methods
Subjects
Detailed methods of breeding and nutritional treatment have been previously described (Galler and Tonkiss, 1991; McGaughy et al., 2014). Briefly, virgin female Long-Evans hooded rats (Charles River, Wilmington, MA USA) were randomly assigned to receive an adequate (25% casein) or low protein (6% casein) diet, supplemented with methionine, beginning 5 weeks before mating to minimize the impact of the change in diet on conception and approximate the chronic exposure to malnutrition in human populations (Galler and Tonkiss, 1991). Both diets were isocaloric and were obtained from Harlan Laboratories (Teklad, Harlan Laboratories, Madison WI, USA). Female rats were maintained on the diets prior to and throughout their pregnancies and were mated with males that had been fed the same diets for 1 week prior to mating. After birth, each litter was culled to 8 pups (6 male and 2 female) and cross-fostered as whole litters to control dams that had received the 25% protein diet during gestation. Pups that had been prenatally malnourished and then fostered to normally nourished dams after birth were designated as the 6/25 (prenatally malnourished) group, while control animals that had been well-nourished prior to and during gestation and then cross fostered to well-nourished dams were designated as the 25/25 group. This animal model was designed to investigate the effects of prenatal protein malnutrition with nutritional rehabilitation beginning at birth. All pups were weaned at post-natal day 21, and thereafter housed with same sex animals and given ad libitum access to standard laboratory chow (Formula 5001, Purina Mills, Richmond, Indiana USA). All animal procedures were approved by the IACUC at University of New England (Protocol No. 20101005MOK), in accordance with guidelines outlined in the Guide for the Care and Use of Laboratory Animals, and all effort was made to minimize pain and discomfort. Laboratory personnel were blind to dietary conditions until the completion of data collection.
Behavioral Task
Apparatus
Nine operant chambers (MedAssociates, St. Albans, VT, USA) equipped with two retractable levers, a house light (2.8 W), a 45 mg pellet dispenser, a 2900-Hz sonalert tone generator, and three panel lights (2.8 W) were used. Each chamber was outfitted with two retractable response levers mounted 11 cm apart with associated stimulus lights. A third central panel light was located between the two other lights and above the food hopper. A house light, located at the top of the back panel of each operant chamber, provided ambient illumination during a test session. A pellet dispenser delivered reinforcers (Bioserv precision pellets, 45 mg; Research Diets, Frenchtown, NJ, USA) into a food hopper. Signal presentation, lever operation, and food pellet delivery were recorded using a PC with Windows XP and the Med-PC IV software (MedAssociates, St. Albans, VT, USA).
Behavioral Training
Behavioral data were collected from male rats with training starting in adulthood (PND. 90) and occurring between 9:00 and 13:00 hrs six days/week. A total of 16 rats were used in these experiments with 8 from each dietary condition. Each rat was selected from a separate litter to control for the potential confound of litter effects, i.e., the sixteen subjects were taken from sixteen dams. Prior work has shown no difference between male and female rats in the performance of the SAT (McGaughy and Sarter 1999) and to be equally deleterious to attention in both males and females (Galler et al. 2012). Hence to increase statistical power, we utilized male subjects in the present experiment. Follow-up in the future comparing network activation of males with females will be done as soon as feasible. Animals were maintained on a reverse light/cycle with lights on at 7:00 pm. Individual rats were assigned the same daily testing time as rats entrain their circadian rhythms to testing in the SAT (Gritton et al., 2009). Mild food restriction began three days prior to the onset on behavioral training with subjects given 20 grams of food per day. For the duration of testing until rats were sacrificed, subjects were given ~ 18 grams of food per day in addition to the food earned in the task.
Because detailed methods and training procedures are available in several other publications (Newman and McGaughy, 2008; Newman et al 2019), we present a brief summary of training here.
Sustained Attention Task: Shaping
Rats were initially trained to bar press for food in the operant chamber in accordance with a fixed ratio 1 (FR1) schedule of reinforcement with the house light illuminated. Reinforcement was suspended when the rat pressed one lever over five times more than the other lever. This contingency prevented development of a positional bias.
Once the animals made at least 50 responses on both levers for two consecutive days, training in the sustained attention task (SAT) began. Rats were placed into the operant chambers for one minute prior to the onset of training, signaled by the illumination of the house light. The SAT requires animals to distinguish signal events (panel light illumination) from non-signals. Initially, signal trials consisted of illuminating both the central and left panel lights for 1 second. The extension of both levers into the box cued the animal to respond within a 4 sec limited hold. Animals were reinforced for responding to the light stimuli by depressing the left lever (hit) and the absence of the lights by pressing the right lever (correct rejection). Incorrect lever presses were defined as misses when they occurred on a signal trial and false alarms when they occurred on a non-signal trial. After animals achieved ≥70% accuracy for at least 2 consecutive testing days, they entered a second shaping task. In this task, only the central panel light was illuminated for 1 sec during signal trials. All other aspects of the task were the same as the previous shaping task. The criterion to move to the final task was the same as above.
Sustained Attention Task (SAT) Baseline Task
In the final stage of the SAT, the length of the signal duration was shortened from 1 sec to 25, 100, or 500 msec to provide a dynamic stimulus range to further tax attention (McGaughy and Sarter, 1995; Newman and McGaughy 2008). Sessions consisted of 27 trials of each of the three signal lengths and 81 trials of the non-signal trials, yielding a total of 162 trials per session. Performance changes were analyzed across three blocks of 54 trials each to determine the effects of prolonged testing on performance. The sequence of signal and non-signal trials was pseudo-randomized so that one block consisted of 27 signal and 27 non-signal trials with each signal length being presented 9 times. Both correction and forced-choice trials were discontinued. Animals were trained to a criterion of > 70% hits to the 500 msec signals and > 70% correct rejections to non-signal trials for at least two consecutive sessions, at which point they were considered ready to receive tests of altered attentional demand. Training on the SAT continued until rats were ready for sacrifice on PND 147 or PND 152. On days when rats were sacrificed, subjects from both dietary groups were used so there was no confound of age.
Effects of distracting visual stimuli
To allow comparison with previously published studies (Newman et al., 2008, 2019), we assessed the effects of flashing the houselight in an unpredictable pattern throughout the testing session (0.25, 0.5, 1.0, 1.5, 2.0, or 3.0 sec on/off; Unpredictable Distractor). This distractor is similar to the standard distractor (McGaughy and Sarter 1995) in terms of its average cycle (~ 0. 5 Hz) but prevents floor effects (Newman and McGaughy 2008). Injections of 2DG were given prior to testing in the uSAT. Rats were sacrificed immediately after the completion of these sessions.
Weekly Weights
Rats were weighed every week beginning on PND 21 and ending on the day of sacrifice. Weights were taken after feedings except on the day of sacrifice when weights were recorded prior to behavioral testing to allow accurate dosing of 2DG.
For each test session, the number of hits, misses, correct rejections, false alarms and errors of omission were recorded. The relative number of hits (hits/(hits + misses)) was computed for each signal length as well as the relative number of correct rejections (correct rejections/(correct rejections + false alarms)). The relative number of left lever presses ((hits + false alarms)/all responses) was also calculated in order to detect any side-biases the animal may have developed.
Metabolic Labeling
On the final day of the experiment, adult rats were injected with 2-deoxyglucose (2-deoxy-[14C]-glucose (2DG)), specific activity 390 mCi/ml, 100 μCi/kg, i.p.; VWR/GE Healthsource, Radnor, PA) and then placed in the testing chamber. 2DG is taken up by glucose transporters into neurons as a function of demand and hence is a marker of neural activity. It is catabolized by initial steps of the glycolytic pathway, but given structural differences from glucose, 2DG is unable to be fully catabolized and can be used as a proxy for metabolic demand as it accumulates with activity. When labeled with [14C] it can be localized and quantified using radiographic methods (Sokoloff et al., 1977). Each rat performed the SAT task with the unpredictable visual distractor (uSAT) for 45 minutes which is sufficient for peak uptake of 2DG in neural tissues, after which the rat was removed from the testing box, immediately anesthetized with sodium pentobarbital (65 mg/kg, i.p.) and perfused with 250 mL of fixative (2% paraformaldehyde in 0.1 M phosphate buffer and 15% sucrose, pH = 7.4) through the left ventricle for five minutes. The brain was quickly removed (<1 min), coated in albumen to cryoprotect the brain, flash frozen in a − 30°C isopentane bath for 30 minutes and then stored at −80°C.
A Hacker-Bright OTF cryostat was used to cut brains into 20 μm sections. Brain sections were separated into one-in-five series that were thaw mounted onto gelatin-chrome alum subbed coverslips. Mounted sections were then stored at −80°C until all brains had been cut. Then sections from all animals were batch processed side-by-side to eliminate variability inherent in sequential processing. Coverslips were secured to Bristol board, then apposed to high resolution X-ray film (AGFA, Structurix D7; Agfa-Gevaert, Mortsel, Belgium) along with 14C standards (Amersham; GE Heathsource, Radnor, PA) at −80°C. After 9 days, all films were processed using D19 Developer (Kodak, Rochester NY) at 10°C for 10 minutes, then fixed (Kodak Fixer; Kodak, Rochester NY) and dried. Images were digitized using a Northern Light Illuminator (Imaging Research, Ste. Catherine, Ontario) and an MCID computer system (Imaging Research, Ste. Catherine, Ontario). Illumination was flat field corrected, and images were calibrated for density using 14C standards and distance using a micrometer.
Data Analysis
Weekly weights
Weekly weights were analyzed in two separate ANOVA’s. The first assessed the effects of prenatal diet on weight during the free-fed period starting on PND 21, (Diet (2) x Week (10)). The second analyses assessed weights during the period of food restriction (Diet (2) x Week (9). The final weights were taken on the day the subject was sacrificed, (PND 147 or PND 152) prior to testing.
Behavior
Performance for each dependent measure was compared to performance in the standard task (ITI: 12 ± 3 sec) on the day prior to the uSAT using separate ANOVA’s for each dependent measure. The effects on signal trial performance (% Hits) were analyzed using a mixed factors ANOVA with the between subjects factor of Nutrition (2) and the within-subjects factors of Day (2), Block (3) and Signal Length (3). The effects on correct rejection accuracy, side bias and omissions were analyzed using mixed-factors ANOVAs with one between-subjects factor (Nutrition (2)) and two within-subject factors (Day (2) and Block (3)). All behavioral analyses were performed using SPSS v 25.0 (IBM, Armonk, NY).
Metabolic Labeling
Regions of interest (ROI) were defined by anatomical criteria visible on 2DG images and verified on a co-processed series of adjacent sections stained for Nissl substance. Densitometry was used to quantify 2DG uptake in each ROI and compared across groups (McGaughy et al., 2014; Amaral et al., 2015). Values in gray matter ROIs were normalized to white matter ROIs present on the same section to minimize interanimal variability (Sharp et al., 1983; Rushmore et al., 2006). 2DG uptake values in a total of 32 ROIs were measured for each animal in the malnourished (n = 8) and well-nourished (n = 8) groups. Comparisons of 2DG uptake between regions were performed with a two-tailed Student’s t-test, with the p < 0.05 adjusted for multiple comparisons using the false discovery rate correction (Matlab, Mathworks, Natick MA).
Network analysis
Graph Construction Based on previous studies applying a graph theoretical approach to rodent 2DG data (Dawson et al., 2012, 2013; 2014; 2015), 2DG uptake measures were used to compute the correlation coefficients (Pearson’s rho) for each region with every other region. This calculation produces undirected adjacency matrices for each group. These data were converted to a normal distribution using a Fisher’s Z transformation and all negative weights were set to zero to focus on positive correlations (Dawson et al., 2014). The matrix was then rescaled such that weights were set to values between zero and one, and the diagonal was set to 0. Matrix values were then thresholded at 0.01 increments and the resulting thresholded values binarized. This approach yielded undirected adjacency matrices of 32 x 32 with a progressive range of connection densities. Connection densities in the 39%–50% range were selected for analysis. The lower limit was selected to ensure that graphs were fully connected, and the upper limit was selected to minimize the contribution of random connections (Bassett et al., 2008). For each group at each connection density, graphs were rewired and connections randomized to generate 1000 random matrices. Graphs from the two groups were then matched according to connection density. Local and global metrics were calculated from the average of the above thresholded range for the real and random graphs. The mean and standard deviation of each metric derived from the random matrices was used to calculate a Z statistic, such that
 .
.
Z statistics were calculated for global and local graph statistics using the brain connectivity toolbox (BCT 2017, Rubinov and Sporns, 2010) for MATLAB (v.2015a, The Mathworks, Natick MA). The personnel selecting the regions of interest and analyzing the data were blind to the nutritional group.
Global Network Measures A primary aim of this research was to compare the structures of the networks in well-nourished and prenatally malnourished brains. The most common metrics of global network structure are the characteristic path length and the average clustering coefficient. The characteristic path length is a measure of the average shortest path length between component pairs of nodes in a network. This is derived by computing a distance matrix from the weighted adjacency matrix to determine path length between nodes. The clustering coefficient for each node is a measure of connectivity between nodes connected to the original node. The global metric is the average of the clustering coefficient for each node of the graph such that a higher clustering coefficient denotes overall higher functional segregation (Rubinov and Sporns, 2010). The global efficiency (GE) of networks was evaluated as the inverse of the characteristic path length.
Each global metric was calculated for each real graph, converted to a Z statistic using values from the associated random graphs, and the normalized measures for each nutrition group (6/25 vs/25/25) were then compared using a two tailed Student’s t-test. Statistical significance was set at a threshold of p < 0.01 for all global measures of this graph theory analysis.
Local metrics
A second aim of this analysis was to determine the extent to which the effect of prenatal protein malnutrition extended to brain regions beyond the prefrontal cortex. Graph theoretical analysis allows for component regions of a network to be investigated by measuring the network properties of individual brain nodes. Analysis of the connectivity of brain regions was carried out by examining regional clustering coefficients, betweenness centrality, and local efficiency. The regional clustering coefficient is a measure of the number of neighbors of a node that are also neighbors themselves. Betweenness centrality of a node is related to how many short paths the node participates in, and the local efficiency measures the capacity of a particular node to transfer information. As above, regional metrics were normalized to measures derived from matched random graphs using Z-statistics and compared using a two-tailed Student’s t-test. Since multiple comparisons were made for each measure, the p values were adjusted to account for multiple comparisons using the Bonferroni adjustment, such that statistical significance was inferred if the p-value was less than 0.0003 (a priori p-value (0.01)/number of comparisons (32)).
Results
Weekly weights
As shown in Fig. 1 in the supplemental materials, both control and PPM subjects showed similar weight gain over the free-feed period from weaning until the week prior to food restriction (Week: F (9,126) = 795.87, p < 0.001; Diet: F(1,14) = 0.79; Diet x Week: F(9, 126) = 1.00, both p > 0.39). After food restriction, both control and PPM rats continued to show small gains in weight over weeks (Supplementary Figure 1; Week: F(8, 112) = 6.00; p = 0.003). There was no difference based on prenatal diet (Diet: F(1,14) = 0.31; p = 0.59; Diet x Week F(8,112) = 0.59; p = 0.61). Post-hoc analyses showed that both groups experienced a less than 5% loss of body weight during the first week of food restriction (25/25: 4.3 ± 1.3%; 6/25: 4.6 ± 0.6%.) The amount of weight loss after restriction did not differ based on prenatal dietary treatment (t(14) = 0.17; p = 0.86).
Figure 1.
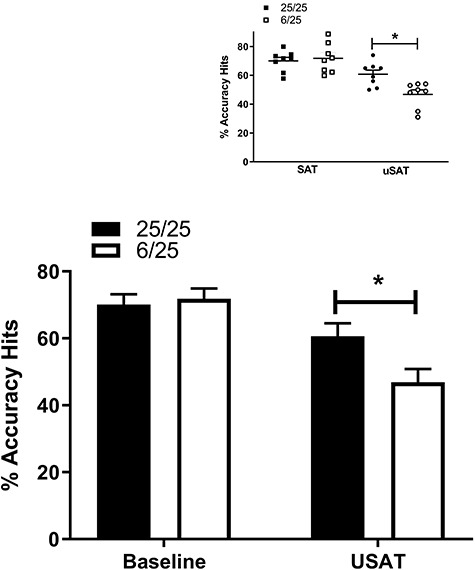
Baseline behavioral performance (left) in the sustained attention task for prenatally malnourished (6/25) rats (white, n = 8), and 25/25 control rats (black, n = 8), and performance during an unpredictable visual distractor session (right). Data represent mean values and error bars represent standard error of the mean collapsed across all stimuli lengths, * = p < 0.05. The inset shows individual data points for all subjects in the SAT and USAT. Squares show the performance of control (black) and PPM subjects (white) during the SAT. Circles show performance during the USAT for controls (black) and PPM (white) subjects.
Behavior
Task acquisition
Prenatal dietary treatment did not impact the number of sessions required to achieve criterion performance in the baseline SAT (t(14) = 0.55, p = 0.59.; Mean ± SEM 25/25 = 30.34 ± 6.00; 6/25 = 33.75 ± 1.29). There was no difference in age between groups at the time of sacrifice (t(14) = 0.00, p = 1.00).
Hits
The presence of the unpredictable distractor decreased hits by all subjects (Hits: F(1,14) = 34.56; p < 0.001). Prenatal malnutrition significantly increased this impairment in hits [Nutrition x Day: F (1, 14) = 5.17; p = 0.04] as shown in Fig. 1. As expected, all rats were more accurate in detecting the longer signals [Stimulus Length: F(2,28) = 67.02; p < 0.001] and there were no differences between 6/25 prenatally malnourished and 25/25 control groups or any interaction effects [Nutrition x Stimulus Length: F(2,28) = 0.26; p = 0.62; Nutrition x Day x Stimulus Length: (F(2,28) = 2.24; p = 0.14]. The demands of prolonged time on task, however, decreased the performance of all subjects regardless of nutritional treatment [Block: F(2,28) = 11.24; p < 0.001; Nutrition x Block: F(2,28) = 0.91; p = 0.42]. The effects of prolonged testing were greater in the distractor than the baseline session [Day x Block: F(2,28) = 6.89; p = 0.004] in both nutrition groups [F(2,28) = 1.97; p = 0 0.18]. There was also a significant interaction of the effects of prenatal nutrition, testing day, stimulus length and block [F(4,56) = 3.01; p = 0.03]. The basis of this interaction is difficult to resolve in the absence of any significant three-way interactions.
Correct Rejections
The unpredictable distractor impaired the ability of all subjects to discriminate non-signal from signals [F(1,14) = 58.73; p < 0.001]. Exposure to prenatal protein malnutrition did not modify this effect [Supplementary Table 1, Nutrition: F(1,14) = 0.62; p = 0.44; Nutrition x Day F(1,14) = 0.19; p = 0.67]. Performance on non-signal trials varied with time on task [Block: F(2,28) = 7.76; p = 0.02]. Correct rejection accuracy was lower during the first block of the unpredictable distractor than subsequent blocks [Day x Block: F(2,28) = 8.54; p = 0.001]. There were no other significant main effects or interactions in the analyses of correct rejections.
Side bias
The effects of prenatal protein malnutrition on signal detection did not result from a change in the rats’ side bias as there was no main effect of nutrition group nor did it interact with any other factor (Supplementary Table 1; p > 0.05).
Omissions
The total number of omissions was low in both the baseline condition (4.3 ± 1.5) and during the uSAT (5.3 ± 1.6). There was no difference in omissions between the 6/25 prenatally malnourished and 25/25 control rats (Supplementary Table 1), there were also no interactions of diet with block or day (all p > 0.05).
2DG uptake
2DG uptake during the uSAT task was significantly lower in all prefrontal cortical areas in the 6/25 prenatally malnourished animals relative to the controls (anterior cingulate, prelimbic, infralimbic and orbitofrontal cortices; Table 1), indicating lower neuronal activity levels. Levels of 2DG uptake in regions at similar coronal levels (e.g., piriform cortex) were not significantly different between the nutrition groups, nor were 2DG uptake measures significantly different in any of the other brain areas.
Table 1.
2DG uptake
| 2DG Uptake | |||
|---|---|---|---|
| 6/25 | 25/25 | ||
| Region | 2DGU ± SD | 2DGU ± SD | Adj p |
| ACC L | 3.3 ± 0.2 | 3.7 ± 0.3 | 0.019 |
| ACC R | 3.2 ± 0.2 | 3.7 ± 0.3 | 0.015 |
| PRL L | 3.0 ± 0.1 | 3.5 ± 0.3 | 0.009 |
| PRL R | 2.9 ± 0.2 | 3.4 ± 0.3 | 0.009 |
| IL L | 2.4 ± 0.1 | 2.9 ± 0.3 | 0.004 |
| IL R | 2.3 ± 0.2 | 2.8 ± 0.2 | 0.004 |
| OFC L | 3.9 ± 0.3 | 4.6 ± 0.4 | 0.015 |
| OFC R | 3.8 ± 0.3 | 4.6 ± 0.5 | 0.015 |
| CING L | 2.6 ± 0.2 | 2.7 ± 0.4 | 0.941 |
| CING R | 2.6 ± 0.2 | 2.7 ± 0.4 | 0.941 |
| STR L | 2.4 ± 0.2 | 2.6 ± 0.5 | 0.880 |
| STR R | 2.4 ± 0.2 | 2.5 ± 0.5 | 0.941 |
| RSP L | 3.5 ± 0.3 | 3.3 ± 0.4 | 0.941 |
| RSP R | 3.5 ± 0.5 | 3.4 ± 0.4 | 0.941 |
| HPC L | 2.1 ± 0.2 | 2.2 ± 0.2 | 0.941 |
| HPC R | 2.2 ± 0.2 | 2.2 ± 0.1 | 0.941 |
| MB L | 4.1 ± 0.4 | 4.1 ± 0.5 | 0.941 |
| MB R | 4.1 ± 0.3 | 4.1 ± 0.5 | 0.941 |
| ANTN L | 3.3 ± 0.3 | 3.3 ± 0.4 | 0.941 |
| ANTN R | 3.1 ± 0.4 | 3.2 ± 0.5 | 0.941 |
| REUN L | 2.3 ± 0.2 | 2.3 ± 0.3 | 0.941 |
| REUN R | 2.3 ± 0.2 | 2.3 ± 0.2 | 0.941 |
| MDN L | 2.8 ± 0.3 | 2.7 ± 0.4 | 0.941 |
| MDN R | 2.7 ± 0.2 | 2.7 ± 0.4 | 0.941 |
| HAB L | 3.6 ± 0.4 | 3.6 ± 0.3 | 0.941 |
| HAB R | 3.5 ± 0.4 | 3.6 ± 0.3 | 0.941 |
| SC L | 3.2 ± 0.2 | 3.3 ± 0.4 | 0.941 |
| SC R | 3.3 ± 0.2 | 3.3 ± 0.4 | 0.941 |
| BCTX L | 3.6 ± 0.2 | 3.5 ± 0.2 | 0.730 |
| BCTX R | 3.5 ± 0.2 | 3.5 ± 0.2 | 0.941 |
| PIR L | 3.7 ± 0.3 | 4.0 ± 0.4 | 0.531 |
| PIR R | 3.7 ± 0.4 | 3.8 ± 0.4 | 0.941 |
2DG uptake in brain regions in prenatally protein malnourished (6/25) and control (25/25) rats. Bolding represents a significant comparison after correction for multiple comparisons (adjusted (Adj) p). Values are presented as means ± standard deviation (SD). Abbreviations: Abbreviations: ACC—anterior cingulate cortex, ANTN—anterior nucleus of the thalamus, BCTX—barrel cortex; CING—cingulate cortex, HAB—habenula, HPC—hippocampus, IL—infralimbic cortex, MB—mammillary body, MDN—mediodorsal nucleus of the thalamus, OFC—orbitofrontal cortex, PIR—piriform cortex, PRL—prelimbic cortex, REUN—reuniens nucleus of the thalamus, RSP—retrosplenial cortex, SC—superior colliculus, STR—striatum.
Correlations between 2DG and performance on the behavioral task
Pearson’s correlations of hits for each of the three testing blocks during the uSAT with regional 2DG uptake levels were calculated to determine the relationship between target detection during the uSAT and brain activity during testing (Table 2). Because prenatal malnutrition influenced signal detection, these correlations were performed in separate analyses for 6/25 and 25/25 rats. The performance of the control rats in the first block of the uSAT was significantly and strongly correlated with activity in the anterior cingulate cortex (ACC) (r(8) = 0.85; p = 0.007), the prelimbic cortex (PRL) (r(8) = 0.72; p = 0.04) and the infralimbic cortex (IL) r(8) = 0.75; p = 0.03), reflecting the importance of these regions in the task. In contrast, in prenatally malnourished rats, the performance in the first block of the uSAT was correlated with activity in the habenula (HAB) (r(8) = 0.71; p = 0.05) and the barrel cortex (r(8) = 0.88; p = 0.004) but was not correlated with activity in any of the prefrontal cortical regions (e.g., ACC, PRL, ILL; all p > 0.05), suggesting the prefrontal cortices were not as critical to task performance in the prenatally malnourished animals.
Table 2.
Pearson’s correlations between performance on the USAT tasks and regional 2DG uptake
| 6/25 | USAT Hits Block 1 | USAT Hits Block 2 | USAT Hits Block 3 |
|---|---|---|---|
| ACC | 0.65 | −0.03 | −0.02 |
| OFC | 0.65 | 0.11 | −0.06 |
| PRL | 0.51 | −0.22 | 0.18 |
| IL | 0.28 | −0.58 | −0.10 |
| PIR | 0.18 | 0.59 | 0.32 |
| STR | −0.16 | 0.26 | −0.38 |
| CING | −0.35 | 0.38 | 0.45 |
| HAB | 0.72 * | 0.22 | −0.05 |
| HPC | 0.46 | 0.08 | −0.24 |
| ANTN | 0.29 | −0.14 | −0.23 |
| REUN | 0.59 | 0.21 | −0.41 |
| BCTX | 0.88 * * | −0.08 | −0.008 |
| MDN | 0.54 | 0.41 | −0.14 |
| MB | 0.09 | 0.42 | 0.48 |
| SC | 0.48 | 0.23 | −0.05 |
| RSP | 0.31 | 0.17 | −0.32 |
| 25/25 | USAT Hits Block 1 | USAT Hits Block 2 | USAT Hits Block 3 |
| ACC | 0.85 * * | 0.64 | −0.03 |
| OFC | −0.10 | −0.27 | 0.03 |
| PRL | 0.72 * | 0.46 | −0.28 |
| IL | 0.75 * | 0.33 | −0.38 |
| PIR | −0.06 | 0.06 | −0.08 |
| STR | −0.21 | −0.11 | 0.43 |
| CING | 0.21 | 0.01 | 0.017 |
| HAB | −0.56 | −0.26 | 0.58 |
| HPC | 0.13 | 0.14 | −0.63 |
| ANTN | 0.33 | 0.43 | 0.39 |
| REUN | 0.22 | 0.50 | 0.43 |
| BCTX | −0.02 | 0.52 | −0.12 |
| MDN | 0.37 | 0.44 | 0.33 |
| MB | 0.81 * | 0.14 | −0.17 |
| SC | −0.03 | −0.35 | 0.14 |
| RSP | −0.41 | −0.36 | 0.46 |
Correlations between performance on three blocks of the behavioral tasks for prenatally malnourished (6/25) and control (25/25) rats. Bolding indicates significant relationships, with a single asterisk representing a p value of < 0.05, and a double asterisk representing a p value of < 0.01. Abbreviations as in Table 1.
Network Measures
Global measures
Different aspects of global network structure were compared between the prenatally malnourished (6/25) and well-nourished control (25/25) groups as shown in Table 3. The characteristic path length (CPL), a measure of the compactness of the network, was not significantly different between the two groups (6/25 CPL Z score = 18.5 ± 0.92 (SD), 25/25 CPL Z-score = 14.8 ± 4.65, p = 0.017). Similarly, the global efficiency (GE) of the networks also was not significantly different between nutrition groups (6/25 GE Z score = −18 ± 0.97, 25/25 GE Z score = −14.7 ± 4.3, p = 0.02). In contrast, the mean clustering coefficient (CCmean), a measure of clustering and network cohesiveness, was significantly lower in the 6/25 prenatally malnourished brain networks than in the 25/25 control group (6/25 CCmean Z score = 8.8 ± 2.3, 25/25 CCmean Z score = 15.1 ± 1.6, p < 0.0001).
Table 3.
Global Network Measures
| 25/25 | 6/25 | p | |
|---|---|---|---|
| Characteristic Path Length (CPL) | 14.8 (4.65) | 18.5 (0.92) | 0.017 |
| Global Efficiency (GE) | −14.7 (4.3) | −18.0 (0.97) | 0.02 |
| Mean Clustering Coefficient (CCmean) | 15.1 (1.6) | 8.8 (2.3) | <0.0001 |
All values are in the form of Z statistics, calculated from the mean and standard deviation of accompanying random networks matched for degree. Values within the parentheses are standard deviations.
Local Measures
The networks of the 6/25 prenatally protein malnourished and 25/25 control groups were matched for the connection density to compare global and local network metrics. Even though the mean number of connections per graph were the same, the contribution from the component nodes to the mean value may differ between the groups. To investigate that issue, the number of connections for each brain region, known as nodal degree, was determined for each group. This comparison for each region showed substantial differences in their distribution according to group (Fig. 2, Fig. 3). For the control group, regions with the most connections included the cingulate cortex (CING; defined as the cingulate cortex between from the genu of the corpus callosum to (but not including) the retrosplenial cortex) and the prelimbic cortices, the anterior nucleus of the thalamus, the mediodorsal (MDN) nucleus of the thalamus, the striatum and the superior colliculus. The hippocampus and the ACC exhibited the fewest connections in 25/25 controls. For the 6/25 prenatally malnourished group, the pattern was quite different: the cingulate cortex was among the brain structures with the fewest connections.
Figure 2.
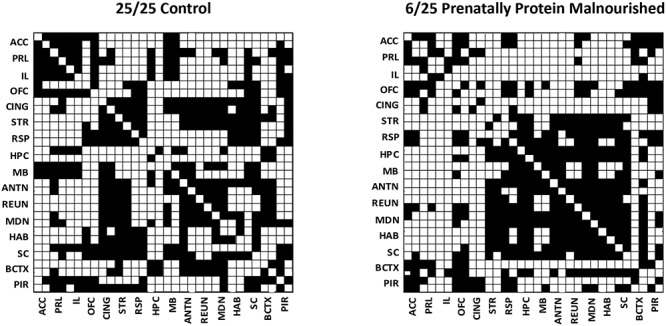
Binary undirected adjacency matrices derived from 2DG update from 25/25 control rats (left) and in 6/25 prenatally protein malnourished rats (right). Black boxes illustrate connection between regions and white boxes denote the lack of connections. Both graphs were obtained at a connection density of 40%. Regions are denoted as pairs of structures, and the upper or leftward component of the pair represents the structure in the left hemisphere. Abbreviations: ACC—anterior cingulate cortex, ANTN—anterior nucleus of the thalamus, BCTX—barrel cortex; CING—cingulate cortex, HAB- habenula, HPC –hippocampus, IL—infralimbic cortex, MB—mammillary body, MDN—mediodorsal nucleus of the thalamus, OFC—orbitofrontal cortex, PIR—piriform cortex, PRL—prelimbic cortex, REUN—reuniens nucleus of the thalamus, RSP—retrosplenial, SC-superior colliculus, STR—striatum.
Figure 3.
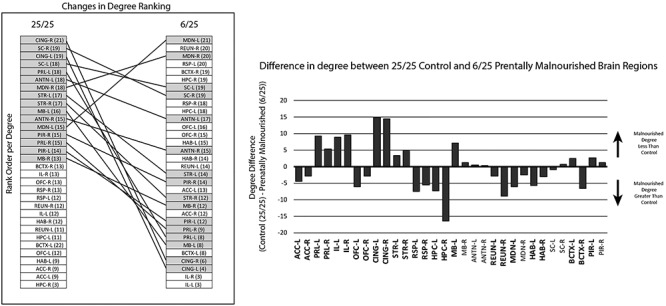
Mean differences in degree between 25/25 control and 6/25 prentally malnourished animals. Regional mean degree was calculated from 39–50% connection densities. The degrees were ranked from highest (top) to lowest (bottom) for each group (left) and nodes with degrees in the top half in the control group was shaded to illustrate the different organization in the malnourished group. The degree for each region from control animal degree were subtracted from the equivalent degree from the malnourished region to generate a difference score (right). Abbreviations as in Fig. 2. Statistical significance between the two groups is denoted by highlighting and an emboldening of the text.
When regions were ranked according to number of connections, most of the regions in the upper half of the rank-ordered list in the control group were found in the lower half in the rank-ordered list from the 6/25 prenatally malnourished group (Fig. 3, Left). Evaluation of the differences in the number of connections (degree) for each region for the 25/25 control and 6/25 prenatally malnourished groups showed that many brain regions in the 6/25 group exhibited fewer connections than the corresponding regions in the control group (Fig. 3, Right). The largest and most consistent decreases in nodal degree in 6/25 rats were in the CING, PRL and IL cortices. The largest increases in the degrees of 6/25 animals relative to control animals were observed in the retrosplenial cortex and the hippocampus.
Evaluation of the local clustering coefficients in the 25/25 controls showed high values in a number of regions, including the ACC, PRL, IL, CING and retrosplenial cortices (Fig. 4, upper, dark). High clustering coefficients were also present for thalamic nuclei (anterior nucleus (ANTN), reuniens nucleus (REUN) and mediodorsal (MDN)), the habenula, the striatum and the superior colliculus, while the hippocampus and sensory cortices (barrel cortex, piriform cortex) had low clustering coefficients in the control rats.
Figure 4.
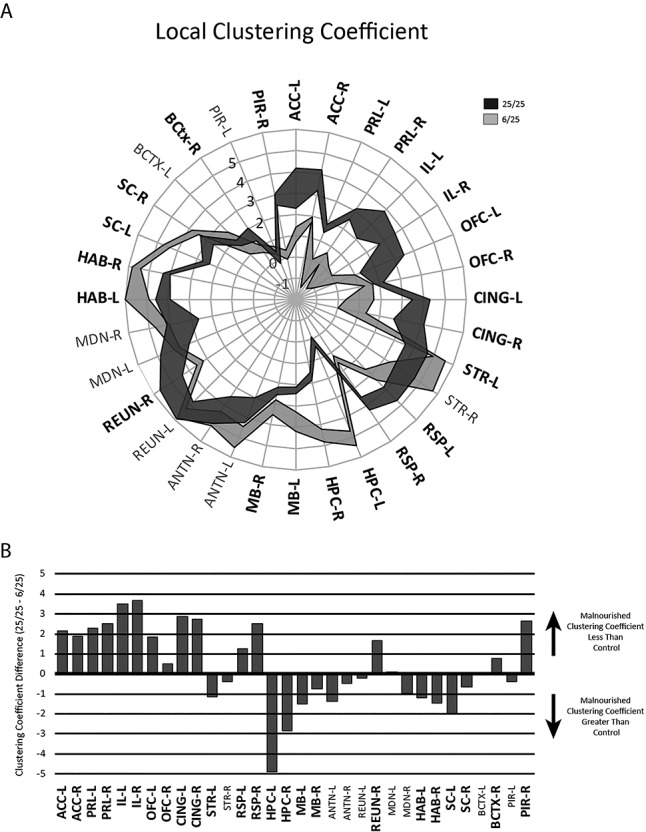
A. Comparison of normalized clustering coefficients for regions in 25/25 control (dark shading) and 6/25 prenatally malnourished (light shading) brain networks. Radial lines correspond to brain areas (abbreviations as in Fig. 1, with L and R indicating left or right side). The width of the ribbons at each brain area represents the variability of the metric, with the outer rim equal to the mean plus 1 standard deviation, and the inner ring representing the mean minus 1 standard deviation. The mean is the Z-score metric as described in the text. B: Comparison of differences in regional clustering coefficients (25/25–6/25) for the mean values. For both graphs, significant comparisons between groups are noted by a bolding of the region text abbreviations in the graph perimeter. Significance was set at p < 0.0003 and included adjustment of a nominal p value of 0.01 with Bonferroni correction for multiple comparisons. Note that this graph is designed to show differences in magnitude, and variability metrics are not included here, but can be observed in the upper graph, and in Supplementary Figures 2-4 for this and subsequent figures.
The clustering coefficients of brain regions in the 6/25 prenatally malnourished rats had an overall pattern quite unlike that of the well-nourished 25/25 control animals (Fig. 4, upper, light). In particular, clustering coefficients in the 6/25 animals were significantly lower in prefrontal cortices (i.e., ACC, PRL, IL, OFC). In addition, clustering coefficients were also lower in the cingulate (CING) and the retrosplenial (RSP) cortex (Fig. 4, lower). The prenatally protein malnourished animals exhibited higher clustering coefficients in several brain regions: the hippocampus (HPC), the mammillary bodies (MB) and the habenula (HAB).
Analysis of local efficiency, a related measure to the clustering coefficient revealed the same pattern of differences between groups; namely, the prenatally malnourished animals had substantially decreased efficiency in the anterior cingulate (ACC), prelimbic (PRL), infralimbic (IL), cingulate (CING), retrosplenial (RSP) cortices, and an increased efficiency in the hippocampus (HPC) (Fig. 5).
Figure 5.
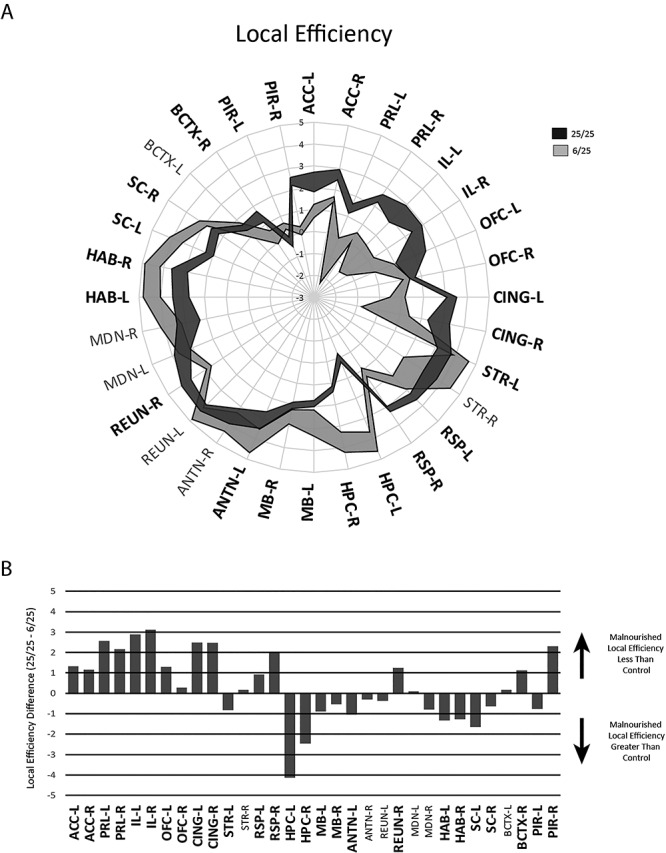
Local efficiency measures in regions from 25/25 control and 6/25 prenatally malnourished networks. Normalized local efficiency was compared for regions in both groups with conventions and abbreviations as in previous figures.
Betweenness centrality was used to evaluate the degree to which individual nodes participate in short network paths. A node with a high betweenness centrality is present in a high proportion of short paths between randomly selected node pairs and is therefore frequently involved in information flow in the network. A comparison of this measure between the two groups showed widespread and significant differences between the groups (Fig. 6). In the prenatally malnourished animals, the prelimbic and infralimbic cortices had very large betweenness centrality measures, indicating that they were connected to more shortest paths between other network nodes than any other regions, and by extension, that the prelimbic and infralimbic were heavily relied upon during the execution of this task.
Figure 6.
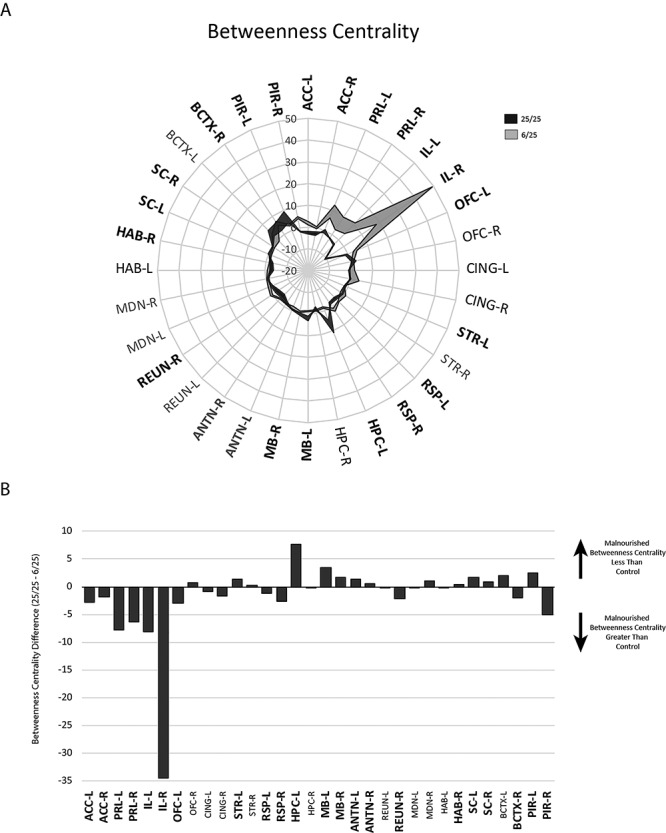
Betweenness centrality differences in regions from 25/25 control and 6/25 prenatally malnourished networks. Abbreviations and conventions as in previous figures.
Discussion
Summary of Results
In a task of sustained attention, animals that experienced prenatal protein malnutrition were significantly more susceptible to distraction as shown by lower target detection in these 6/25 rats than in 25/25 controls. At a neural level, prenatally malnourished animals showed a significantly lower uptake of 2DG than control animals in prefrontal cortical regions, including the anterior cingulate cortex (ACC), the prelimbic cortex (PRL), the infralimbic cortex (IL) and the orbitofrontal cortex (OFC), indicating these regions were less active during the task in the 6/25 animals than in 25/25 controls. This reduction in activity occurred in both hemispheres and ranged from a 13% to a 21% decrease relative to well-nourished control animals. Functional activity in these prefrontal regions was significantly and positively correlated with performance on the behavioral in 25/25 control animals, but not 6/25 prenatally malnourished animals. Regional network measurements showed that medial prefrontal and cingulate regions were important during task execution in controls, but not in prenatally malnourished animals. Instead, the prenatally malnourished brain networks appeared to be differently organized, where the hippocampus occupied a much more central role in the performance of the sustained attention task than in controls. These findings strongly suggest that prenatal protein malnutrition disrupts brain development to produce a brain with a fundamentally different organization.
Behavioral findings
Performance in the sustained attention task without distractors depends on the integrity of corticopetal cholinergic afferents (Newman and McGaughy, 2008; Hasselmo and Sarter, 2011). Acetylcholine originating from the basal forebrain (Hedreen et al., 1984) is necessary to facilitate detection of signal trials and to allow circuits to switch between signal and non-signal events (Himmelheber et al., 2000; Sarter et al., 2005). It has also been shown that selective cholinergic deafferentation of the prelimbic cortex (Newman and McGaughy, 2008) produces susceptibility to distraction. Additionally, performance in the SAT has been shown to rely upon rapid changes in cholinergic transients gated by glutamate and cholinergic nicotinic receptors to facilitate a readiness to respond in this task (Howe et al., 2013). Though our prior work found that prenatal protein malnutrition did not affect the overall cholinergic innervation of the PRL, IL or ACC (Newman et al., 2019), we cannot exclude the possibility that the temporal dynamics or other aspects of the signaling stream (e.g., nicotinic receptor function) were affected by a low protein diet prior to and during the prenatal period.
The increased vulnerability to distraction of prenatally protein malnourised animals as shown here is similar to findings reported earlier (Peter et al., 2016). However, these findings are in contrast to our prior work showing prenatal protein malnutrition may also result in cognitive rigidity (McGaughy et al., 2014) and resistance to distraction (Newman et al., 2019). One critical methodological difference in the current study and our earlier report (Newman et al., 2019), was the administration of 2DG by intraperitoneal injection immediately prior to the testing in the uSAT. This injection may constitute a mild acute stress that revealed performance impairments in the 6/25 relative to 25/25 animals. Injection alone can increase cortical norepinephrine and dopamine for a brief period of time (Berridge et al., 2006) as a response to stress (Radley et al., 2008). Therefore, behavioral and brain changes likely reflect an interaction of a very mild stressor with the cognitive demand of the behavioral task. Additional studies are required to compare directly the performance of stressed and unstressed rats in the USAT. This mild stress may have recruited the corticopetal noradrenergic systems to prime the control animals to respond more efficiently to the uSAT. In the prenatally malnourished rats, the additional stress challenges to an already compromised noradrenergic system in prenatally malnourished rats (Mokler et al., 2019, Newman et al., 2019) may have contributed to poorer uSAT performance relative to controls in the present study.
Deficits in the noradrenergic system have also been identified in animals subjected to prenatal protein malnutrition (Soto-Moyano et al., 1998 Soto-Moyano et al., 2005; Hernández et al., 2008; Barra et al., 2012; Sáez-Briones et al., 2015). This dysfunction in noradrenergic systems may also underlie the deficits produced in sustained attention performance. Though less commonly linked to deficits in sustained attention than acetylcholine, optimal levels of prefrontal norepinephrine have been linked to improved performance in similar attentional tasks (Berridge et al., 2012; Dalley et al., 2001). However, prior work has shown that restricted noradrenergic depletion of the PRL does not produce impairments in the uSAT (Newman et al. 2019) so the exact contribution of NE to performance of the uSAT remains unresolved and requires further investigation.
Network analysis
Graph theoretical methods were used to compare brain networks identified by 2DG activation patterns in prenatally protein malnourished and control animals. These methods are commonly used to evaluate between-group differences that are present at the network level for networks derived from structural data such as connectivity, or functional data such as those derived from functional magnetic resonance imaging (fMRI) (Bullmore and Sporns, 2009). This type of network-based analysis reveals changes that investigators are unable to discern based on collation of anatomical or physiological results at the cellular or circuit level. Dawson and colleagues were the first to employ graph theoretical networks to analyze the results of 2-DG experiments in a rodent model of schizophrenia and to evaluate the effect of pharmaceutics on brain network activity (Dawson et al., 2012; 2013; 2014; 2015). Conceptually, functional data derived from 2DG experiments are very similar to fMRI experiments, although unlike studies in humans, rodent fMRI experiments are typically not done during behavioral tasks to avoid movement artifact and differences in acclimation to the scanner environment (Upadhyay et al., 2011; but see King et al., 2005; Febo 2011). This difference prompted the use of the 2DG technique in the present experiment to examine task-dependent changes in neural activity.
Global metrics
Global network measures represent the structure and general organization of an entire network and can be applied to structural or functional brain networks (Bullmore and Sporns, 2009). There are two principal measures that characterized networks at a global scale. The characteristic path length of a graph is an average of the shortest path lengths required to connect any two nodes of the graph with shorter characteristic path lengths reflecting a more compact network. The characteristic path length is inversely related to the global efficiency of a network wherein a more compact characteristic path length translates to a higher global efficiency of the network. In the present study, we found no statistical difference in the characteristic path length or in the global efficiency between prenatally malnourished and control animals.
A second commonly used global network measure is the mean clustering coefficient. This value is generated by averaging the clustering coefficient for each node of the network (i.e., the local clustering coefficient). The local clustering coefficient determines how well each node’s neighbors are connected to each other by measuring the proportion of completed connected triangles centered on the node to the number of possible triangles (triplets). A high clustering coefficient indicates that the regions connected to the node are connected to each other, and therefore are organized into cliques (Watts and Strogatz, 1998). A higher clustering coefficient suggests a higher local density of connections in the network nodes and a greater ability to share information between members of a clique. Comparing the mean clustering coefficient between the prenatally malnourished and control networks showed a significantly lower mean clustering coefficient for the prenatally malnourished group. Reduction in the mean clustering coefficient in neurological disease has been interpreted to reflect less functional segregation in the network (e.g., Liu et al., 2008; Brier et al., 2014), which together with the current results suggest prenatally malnourished brain networks have a reduced functional segregation of component regions, however whether this finding reflects an adaptive or maladaptive effect is currently unclear.
Local Network Metrics
While global networks are informative in determining overall differences in network topology, valuable information can also be obtained by comparing the extent to which individual network nodes (i.e., brain areas) are connected to the network in each group. A common way to evaluate how individual nodes connect to the network is by measuring the local clustering coefficient for each node, a measure of whether the regions connected to a node are also connected to each other. A related measure is local efficiency, which is a measure of information transfer through the node. In the control animals, both clustering and local efficiency were high in most regions including prefrontal cortices (i.e., ACC, PRL, IL, OFC). The pattern of clustering and local efficiency was quite different in the prenatally malnourished network compared to controls, especially in the prefrontal cortices where clustering and local efficiency were substantially diminished task performance relative to controls. These findings suggest that prefrontal cortical areas in prenatally malnourished animals were participating in different ways in the execution of the uSAT task as compared with the controls.
Examination of other brain regions indicates that the functional differences in the prenatally malnourished networks were not limited to the prefrontal cortices. Several regions outside the prefrontal cortex exhibited lower clustering and lower efficiency in the prenatally malnourished group, in particular the cingulate and the retrosplenial cortices. These findings suggest that the limbic cortex along the length of the corpus callosum may be particularly affected by prenatally malnutrition and support previous hypotheses that the limbic system is selectively impacted by protein malnutrition in the prenatal period (Morgane et al., 2002).
While medial prefrontal and related cortical components of the limbic system in prenatally malnourished animals exhibited a reduction in functional network measures, several brain areas in these 6/25 animals showed increased clustering and local efficiency. Clustering coefficients and local efficiency in the hippocampus, the mammillary bodies, the habenula and the superior colliculus were consistently and significantly higher in the prenatally malnourished animals, with the increases in the hippocampus being particularly large. Together, these data point to alterations in the function of the limbic system, with some regions (e.g., cingulate, medial prefrontal, retrosplenial) showing less involvement, and other allocortical (e.g., hippocampus) and diencephalic components of the limbic system (e.g., habenulae, mammillary bodies) showing a greater involvement during the sustained attention task.
Importance of Individual Nodes
Widespread effects of prenatally protein malnutrition were also observed when each node was evaluated to determine its importance to the network. A simple measure of importance (or centrality) is the number of connections each node has to other regions within the network. The regions with the highest number of connections in the control animals included the cingulate, the superior colliculus and the prelimbic cortex, along with thalamic regions (anterior nucleus, mediodorsal nucleus), the striatum and the mammillary bodies. The nodes with the lowest number of connections, and therefore relatively less connected to the task-related network in the control brains were the hippocampus, and the anterior cingulate cortex.
Some of the most highly connected nodes in the control group were also highly connected in the prenatally malnourished animals, e.g., thalamic nuclei, striatum and the mammillary bodies. These nodes likely subserved task execution in both groups. However, there were regions in the prenatally malnourished network that had fewer connections (e.g., medial prefrontal, cingulate) and others that had more connections (e.g., retrosplenial cortex and the hippocampus). Overall, these results confirm the findings of the differences in local efficiency and clustering coefficients and support the idea that prefrontal regions and limbic cortical (i.e., cingulate, retrosplenial) and allocortical (hippocampus) regions are particularly impacted by prenatal protein malnutrition.
Betweenness centrality measures how often a node participates in short paths between randomly selected pairs of nodes (Bullmore and Sporns, 2009). This value is of importance in determining which regions in each group are important in this task. This analysis showed that betweenness centrality in the prelimbic and infralimbic cortices were substantially higher in the prenatally protein malnourished group compared to controls. Unlike the previous analysis, which indicated the prelimbic and infralimbic cortices in prenatally malnourished animals had lower efficiency, lower clustering and fewer connections, the results of the betweenness centrality analysis indicated that these regions were particularly important for information transfer in the network of the prenatally protein malnourished animals. Put together, these results indicate that the prenatally protein malnourished animals rely heavily on the prelimbic and infralimbic cortices during this task, but these regions are not as connected with other regions in the network as they are in the control animals. The control animals, in contrast have a network that appears to be more balanced across prefrontal and other areas, with many regions contributing equally to the information flow in the network.
The behavioral data, the 2DG data, and the network analysis all confirm that the prefrontal cortices and specifically the prelimbic and infralimbic cortices are specifically impacted by prenatal malnutrition. The network analysis further shows that the differences in the neural network extend well beyond the prefrontal cortices and seem to particularly impact structures of the limbic system. Thus, the impact of prenatal protein malnutrition on the functional brain organization, at least in the context of this task confirms that depriving the developing brain of protein during prenatal development fundamentally alters the trajectory of neuronal development and creates an adult brain that uses different neural substrates to perform a task that normally recruits prefrontal cortical regions.
The Hippocampus and the Medial Prefrontal Cortex
Prior work with this model has shown that prenatal protein malnutrition produces specific effects on the structure and function of the hippocampus and specifically affects inhibitory networks and neuroplastic mechanisms such as long-term potentiation (e.g., Diáz-Cintra et al., 1991, 1994; Bronzino et al., 1997; Rushmore et al., 1998; Luebke et al., 2000; Morgane et al., 2002; Chang et al., 2003; Lister et al., 2005). While some hippocampally-mediated behaviors show clear differences in 25/25 vs. 6/25 rats, other behaviors commonly associated with an intact hippocampal formation, such as spatial navigation and working memory, showed little difference in the prenatally malnourished animals (Morgane et al., 2002), suggesting prenatally malnourished animals may be able to compensate for changes in hippocampal structure and function. However, such a suggestion is based on the underlying assumption that the hippocampus in the prenatally malnourished animals is functionally equivalent to the control hippocampus. The results of the present study suggest that the hippocampus of prenatally malnourished rats is highly involved in a functional brain network during a task that in normal animals is largely mediated by the prefrontal cortex (Newman and McGaughy, 2008, 2011). This finding is evidence for the idea that prenatally malnourished animals are using the hippocampus during the uSAT task in ways that the control animals do not.
The relationship between the hippocampus and the prefrontal cortices is a topic of intense study (Aggleton 2012; Preston and Eichenbaum, 2013; Guise and Shapiro 2017). The hippocampus has strong projections to the prelimbic and infralimbic cortices (Jay et al., 1992; Ferino et al., 1987; Hoover and Vertes, 2007). These direct projections are not directly reciprocated; instead prelimbic and infralimbic cortices send a disynaptic return projection to the hippocampus by way of the thalamic reuniens nucleus (Hoover and Vertes, 2007). Some studies have found that the hippocampal input may serve to convey location information to cells in the prefrontal cortices responsible for encoding goals (Hok et al., 2005), and thus the hippocampus may be part of a network involved in certain prefrontally-mediated tasks. The inverse functional contribution of the two areas in the present study suggests that this interaction is disrupted in adults after prenatal protein malnutrition. However, it is unclear whether the hippocampus is compensating for deficiencies in prefrontal cortical function or whether deficits in function or structure are producing an inability of the prefrontal cortex to subserve normal function.
Limitations of the Study
There are several limitations of this study. The first is that it is likely stress was introduced during the 2DG injection period. While this stress was equally applied to each group, the prenatally protein malnourished group has been shown to be more sensitive to the effects of stress (e.g., Mokler et al., 2007). As a result, behavioral and functional results likely include the effect of stress. More systematic work is needed to reveal the precise impact of stress on behavior in prenatally malnourished animals.
A second limitation is that the precise nature of the brain networks derived in this study is not clear. Structural networks built from connectional data have a clear neurobiological analog, but features such as characteristic path length and clustering are difficult to interpret in 2DG derived networks. The presence of these between-group network differences serves as a prompt to uncover their biological basis using methods designed to directly evaluate structural and functional differences in how specific brain areas interact (e.g., hippocampus and medial prefrontal cortex) in prenatally malnourished and control animals.
Conclusions
The results of this study show that adult animals subjected to prenatal protein malnutrition are impaired in a test of attention and show a reduction of 2DG uptake in prefrontal cortices relative to controls. Network analyses based on 2DG uptake indicate that prenatally malnourished animals use a different brain network to carry out this task, a network reliant less on the medial prefrontal cortices and more on the hippocampus. Our findings confirm and extend results of previous studies on the far reaching implications of prenatal protein malnutrition and other early-life influences (e.g., Kim et al., 2019) on brain function, particularly in the domains of cognitive control and attention. Moreover, these findings may provide a better understanding of the basis for the elevated risk conferred by prenatal malnutrition for neuropsychiatric conditions, such as deficits in executive function and attention (Galler et al. 2012; Peter et al. 2016), mild cognitive impairment, dementia (Susser and Lin 1992; Susser et al., 1996) schizophrenia, and depression (Galler et al., 2010; He et al., 2018; Kang et al., 2017; Susser and St. Clair, 2013; St. Clair et al., 2005).
Supplementary Material
Notes
We wish to acknowledge the late Dr Peter Morgane, an author on this paper who participated in the conception and experimental design of this project but passed away prior to the completion of the manuscript. He is greatly missed. We thank Andy Bates, Donna Bass, and Wendy Weissner for excellent technical assistance. We thank Dr Claus Hilgetag for helpful conversations and suggestions.
Funding
This work was supported by grants to JRG from the National Institutes of Health (MH078411 and HD060896).
References
- Aggleton JP. 2012. Multiple anatomical systems embedded within the primate medial temporal lobe: implications for hippocampal function. Neurosci Biobehav Rev. 36(7):1579–1596. [DOI] [PubMed] [Google Scholar]
- Amaral AC, Jakovcevski M, McGaughy JA, Calderwood SK, Mokler DJ, Rushmore RJ, Galler JR, Akbarian SA, Rosene DL. 2015. Prenatal protein malnutrition decreases KCNJ3 and 2DG activity in rat prefrontal cortex. Neuroscience. 286:79–86. [DOI] [PMC free article] [PubMed] [Google Scholar]
- Barra R, Soto-Moyano R, Valladares L, Morgan C, Pérez H, Burgos H, Olivares R, Sáez-Briones P, Laurido C, Hernández A. 2012. Knockdown of α2C-adrenoceptors in the occipital cortex rescued long-term potentiation in hidden prenatally malnourished rats. Neurobiol Learn Mem. 98:228–234. [DOI] [PubMed] [Google Scholar]
- Bassett DS, Bullmore E, Verchinski BA, Mattay VS, Weinberger DR, Meyer-Lindenberg A. 2008. Hierarchical organization of human cortical networks in health and schizophrenia. J Neurosci. 28:9239–9248. [DOI] [PMC free article] [PubMed] [Google Scholar]
- Berridge CW, Devilbiss DM, Andrzejewski ME, Arnsten AFT, Kelley AE, Schmeichel B, Hamilton C, Spencer RC. 2006. Methylphenidate preferentially increases catecholamine neurotransmission within the prefrontal cortex at low doses that enhance cognitive function. Biol Psychiatry. 60:1111–1120. [DOI] [PubMed] [Google Scholar]
- Berridge CW, Shumsky JS, Andrzejewski ME, McGaughy JA, Spencer RC, Devilbiss DM, Waterhouse BD. 2012. Differential sensitivity to psychostimulants across prefrontal cognitive tasks: differential involvement of noradrenergic α1 - and α2-receptors. Biol Psychiatry. 71:467–473. [DOI] [PMC free article] [PubMed] [Google Scholar]
- Brier MR, Thomas JB, Faga AM, Hassenstab J, Holtzman DM, Benzinger TL, Morris JC, Ances BM. 2014. Functional connectivity and graph theory in preclinical Alzheimer’s disease. Neurobiol Aging. 35:757–768. [DOI] [PMC free article] [PubMed] [Google Scholar]
- Bronzino JD, Austin-LaFrance RJ, Mokler D, Morgane PJ. 1997. Effects of prenatal protein malnutrition on hippocampal long-term potentiation in freely moving rats. Exp Neurol. 148:317–323. [DOI] [PubMed] [Google Scholar]
- Bullmore E, Sporns O. 2009. Complex brain networks: graph theoretical analysis of structural and functional systems. Nat Rev Neurosci. 10:186–198. [DOI] [PubMed] [Google Scholar]
- Chang Y-M, Galler JR, Luebke JI. 2003. Prenatal protein malnutrition results in increased frequency of miniature inhibitory postsynaptic currents in rat CA3 interneurons. Nutr Neurosci. 6:263–267. [DOI] [PubMed] [Google Scholar]
- Cintra L, Granados L, Aguilar A, Kemper T, DeBassio W, Galler J, Morgane P, Durán P, Díaz-Cintra S. 1997. Effects of prenatal protein malnutrition on mossy fibers of the hippocampal formation in rats of four age groups. Hippocampus. 7:184–191. [DOI] [PubMed] [Google Scholar]
- Dalley JW, McGaughy J, O’Connell MT, Cardinal RN, Levita L, Robbins TW. 2001. Distinct changes in cortical acetylcholine and noradrenaline efflux during contingent and noncontingent performance of a visual attentional task. J Neurosci. 21:4908–4914. [DOI] [PMC free article] [PubMed] [Google Scholar]
- Dawson N, Kurihara M, Thomson DM, Winchester CL, McVie A, Hedde JR, Randall AD, Shen S, Seymour PA, Hughes ZA et al. 2015. Altered functional brain network connectivity and glutamate system function in transgenic mice expressing truncated disrupted-in-schizophrenia 1. Transl Psychiatry. 5:e569. [DOI] [PMC free article] [PubMed] [Google Scholar]
- Dawson N, Morris BJ, Pratt JA. 2013. Subanaesthetic ketamine treatment alters prefrontal cortex connectivity with thalamus and ascending subcortical systems. Schizophr Bull. 39:366–377. [DOI] [PMC free article] [PubMed] [Google Scholar]
- Dawson N, Thompson RJ, McVie A, Thomson DM, Morris BJ, Pratt JA. 2012. Modafinil reverses phencyclidine-induced deficits in cognitive flexibility, cerebral metabolism, and functional brain connectivity. Schizophr Bull. 38:457–474. [DOI] [PMC free article] [PubMed] [Google Scholar]
- Dawson N, Xiao X, McDonald M, Higham DJ, Morris BJ, Pratt JA. 2014. Sustained NMDA receptor hypofunction induces compromised neural systems integration and schizophrenia-like alterations in functional brain networks. Cereb Cortex. 24:452–464. [DOI] [PubMed] [Google Scholar]
- de Rooij SR, Wouters H, Yonker JE, Painter RC, Roseboom TJ. 2010. Prenatal undernutrition and cognitive function in late adulthood. Proc Natl Acad Sci U S A. 107:16881–16886. [DOI] [PMC free article] [PubMed] [Google Scholar]
- Diáz-Cintra S, Cintra L, Galván A, Aguilar A, Kemper T, Morgane PJ. 1991. Effects of prenatal protein deprivation on postnatal development of granule cells in the fascia dentata. J Comp Neurol. 310:356–364. [DOI] [PubMed] [Google Scholar]
- Díaz-Cintra S, García-Ruiz M, Corkidi G, Cintra L. 1994. Effects of prenatal malnutrition and postnatal nutritional rehabilitation on CA3 hippocampal pyramidal cells in rats of four ages. Brain Res. 662:117–126. [DOI] [PubMed] [Google Scholar]
- Febo M. 2011. Technical and conceptual considerations for performing and interpreting functional MRI studies in awake rats. Front Psych. 2:43. [DOI] [PMC free article] [PubMed] [Google Scholar]
- Ferino F, Thierry AM, Glowinski J. 1987. Anatomical and electrophysiological evidence for a direct projection from Ammon’s horn to the medial prefrontal cortex in the rat. Exp Brain Res. 65:421–426. [DOI] [PubMed] [Google Scholar]
- Galler JR, Ramsey F, Solimano G, Lowell WE, Mason E. 1983. The influence of early malnutrition on subsequent behavioral development. I. Degree of impairment in intellectual performance. J Am Acad Child Psychiatry. 22:8–15. [DOI] [PubMed] [Google Scholar]
- Galler JR, Ramsey F, Solimano G, Lowell WE. 1983. The influence of early malnutrition on subsequent behavioral development. II. Classroom behavior. J Amer Acad Child Psychiat. 22:16–22. [DOI] [PubMed] [Google Scholar]
- Galler JR, Ramsey FC, Morley DS, Archer E, Salt P. 1990. The long-term effects of early kwashiorkor compared with marasmus. IV. Performance on the national high school entrance examination. Pediatr Res. 28:235–239. [DOI] [PubMed] [Google Scholar]
- Galler JR, Tonkiss J. 1991. Prenatal protein malnutrition and maternal behavior in Sprague-Dawley rats. J Nutr. 121:762–769. [DOI] [PubMed] [Google Scholar]
- Galler JR, Bryce CP, Waber D, Hock RS, Exner N, Eaglesfield D, Fitzmaurice G, Harrison R. 2010. Early childhood malnutrition predicts depressive symptoms at ages 11-17. J Child Psychol Psychiatry. 51:789–798. [DOI] [PMC free article] [PubMed] [Google Scholar]
- Galler JR, Bryce CP, Zichlin ML, Fitzmaurice G, Eaglesfield GD, Waber DP. 2012. Infant malnutrition is associated with persisting attention deficits in middle adulthood. J Nutr. 142:788–794. [DOI] [PMC free article] [PubMed] [Google Scholar]
- Gritton HJ, Sutton BC, Martinez V, Sarter M, Lee TM. 2009. Interactions between cognition and circadian rhythms: attentional demands modify circadian entrainment. Behav Neurosci. 123:937–948. [DOI] [PMC free article] [PubMed] [Google Scholar]
- Guise KG, Shapiro ML. 2017. Medial prefrontal cortex reduces memory interference by modifying hippocampal encoding. Neuron. 94(1):183–192. [DOI] [PMC free article] [PubMed] [Google Scholar]
- Hasselmo ME, Sarter M. 2011. Modes and models of forebrain cholinergic neuromodulation of cognition. Neuropsychopharmacology. 36:52–73. [DOI] [PMC free article] [PubMed] [Google Scholar]
- Hedreen JC, Struble RG, Whitehouse PJ, Price DL. 1984. Topography of the magnocellular basal forebrain system in human brain. J Neuropathol Exp Neurol. 43:1–21. [DOI] [PubMed] [Google Scholar]
- Hernández A, Burgos H, Mondaca M, Barra R, Núñez H, Pérez H, Soto-Moyano R, Sierralta W, Fernández V, Olivares R et al. 2008. Effect of prenatal protein malnutrition on long-term potentiation and BDNF protein expression in the rat entorhinal cortex after neocortical and hippocampal tetanization. Neural Plast. 2008:646919. [DOI] [PMC free article] [PubMed] [Google Scholar]
- He P, Chen G, Guo C, Wen X, Song X, Zheng X. 2018. Long-term effect of prenatal exposure to malnutrition on risk of schizophrenia in adulthood. Eur Psychiatry. 51:42–47. [DOI] [PubMed] [Google Scholar]
- Himmelheber AM, Sarter M, Bruno JP. 2000. Increases in cortical acetylcholine release during sustained attention performance in rats. Brain Res Cogn Brain Res. 9:313–325. [DOI] [PubMed] [Google Scholar]
- Hok V, Save E, Lenck-Santini PP, Poucet B. 2005. Coding for spatial goals in the prelimbic/infralimbic area of the rat frontal cortex. Proc Natl Acad Sci U S A. 102:4602–4607. [DOI] [PMC free article] [PubMed] [Google Scholar]
- Hoover WB, Vertes RP. 2007. Anatomical analysis of afferent projections to the medial prefrontal cortex in the rat. Brain Struct Funct. 212:149–179. [DOI] [PubMed] [Google Scholar]
- Howe WM, Berry AS, Francois J, Gilmour G, Carp JM, Tricklebank M, Lustig C, Sarter M. 2013. Prefrontal cholinergic mechanisms instigating shifts from monitoring for cues to cue-guided performance: converging electrochemical and fMRI evidence from rats and humans. J Neurosci. 33(20):8742–8752. [DOI] [PMC free article] [PubMed] [Google Scholar]
- Jay TM, Thierry A-M, Wiklund L, Glowinski J. 1992. Excitatory amino acid pathway from the hippocampus to the prefrontal cortex. Contribution of AMPA receptors in Hippocampo-prefrontal cortex transmission. Eur J Neurosci. 4:1285–1295. [DOI] [PubMed] [Google Scholar]
- Kang Y, Zhang Y, Feng Z, Liu M, Li Y, Yang H, Wang D, Zheng L, Lou D, Cheng L et al. 2017. Nutritional deficiency in early life facilitates aging-associated cognitive decline. Curr Alzheimer Res. 14:841–849. [DOI] [PubMed] [Google Scholar]
- King JA, Garelick TS, Brevard ME, Chen W, Messenger TL, Duong TQ, Ferris CF. 2005. Procedure for minimizing stress for fMRI studies in conscious rats. J Neurosci Methods. 148:154–160. [DOI] [PMC free article] [PubMed] [Google Scholar]
- Kim DJ, Davis EP, Sandman CA, Glynn L, Sporns O, O’Donnell BF, Hetrick WP. 2019. Childhood poverty and the organization of structural brain networks. Neuroimage. 184:409–416. [DOI] [PubMed] [Google Scholar]
- Lister JP, Blatt GJ, DeBassio WA, Kemper TL, Tonkiss J, Galler JR, Rosene DL. 2005. Effect of prenatal protein malnutrition on numbers of neurons in the principal cell layers of the adult rat hippocampal formation. Hippocampus. 15:393–403. [DOI] [PubMed] [Google Scholar]
- Liu Y, Liang M, Zhou Y, He Y, Hao Y, Song M, Yu C, Liu H, Liu Z, Jiang T. 2008. Disrupted small-world networks in schizophrenia. Brain. 131:945–961. [DOI] [PubMed] [Google Scholar]
- Luebke J, St John J, Galler JR. 2000. Prenatal protein malnutrition results in increased frequency of miniature inhibitory synaptic currents in rat CA1 pyramidal cells. Synapse. 37:23–31. [DOI] [PubMed] [Google Scholar]
- McGaughy J, Sarter M. 1995. Behavioral vigilance in rats: task validation and effects of age, amphetamine, and benzodiazepine receptor ligands. Psychopharmacology (Berl). 117:340–357. [DOI] [PubMed] [Google Scholar]
- McGaughy J, Sarter M. 1999. Effect of ovariectomy, 192 IgG-saporin-induced cortical cholinergic deafferentation, and administration of estradiol on sustained attention performance in rats. Behav Neuroscie. 113(6):1216–32. [DOI] [PubMed] [Google Scholar]
- McGaughy JA, Amaral AC, Rushmore RJ, Mokler DJ, Morgane PJ, Rosene DL, Galler JR. 2014. Prenatal malnutrition leads to deficits in attentional set shifting and decreases metabolic activity in prefrontal subregions that control executive function. Dev Neurosci. 36:532–541. [DOI] [PubMed] [Google Scholar]
- Mokler DJ, Torres OI, Galler JR, Morgane PJ. 2007. Stress-induced changes in extracellular dopamine and serotonin in the medial prefrontal cortex and dorsal hippocampus of prenatally malnourished rats. Brain Res. 1148:226–233. [DOI] [PMC free article] [PubMed] [Google Scholar]
- Mokler DM, McGaughy JA, Bass D, Morgane PJ, Rosene DL, Amaral AC, Rushmore RJ, Galler JR. 2019. Prenatal protein malnutrition leads to hemispheric differences in the extracellular concentrations of norepinephrine, dopamine and serotonin in the m edial prefrontal cortex of adult rats. Front Neurosci. 13:136. [DOI] [PMC free article] [PubMed] [Google Scholar]
- Morgane PJ, Austin-LaFrance R, Bronzino J, Tonkiss J, Díaz-Cintra S, Cintra L, Kemper T, Galler JR. 1993. Prenatal malnutrition and development of the brain. Neurosci Biobehav Rev. 17:91–128. [DOI] [PubMed] [Google Scholar]
- Morgane PJ, Mokler DJ, Galler JR. 2002. Effects of prenatal protein malnutrition on the hippocampal formation. Neurosci Biobehav Rev. 26:471–483. [DOI] [PubMed] [Google Scholar]
- Newman LA, McGaughy J. 2008. Cholinergic deafferentation of prefrontal cortex increases sensitivity to cross-modal distractors during a sustained attention task. J Neurosci. 28:2642–2650. [DOI] [PMC free article] [PubMed] [Google Scholar]
- Newman LA, McGaughy J. 2011. Attentional effects of lesions to the anterior cingulate cortex: how prior reinforcement influences distractibility. Behav Neurosci. 125:360–371. [DOI] [PMC free article] [PubMed] [Google Scholar]
- Newman LA, Baraiolo J, Mokler DJ, Rabinowitz AG, Galler JR, McGaughy JA. 2019. Prenatal protein malnutrition produces resistance to distraction similar to noradrenergic deafferentation of the prelimbic cortex in a sustained attention task. Front Neurosci. 13:123. [DOI] [PMC free article] [PubMed] [Google Scholar]
- Peter CJ, Fischer LK, Kundakovic M, Garg P, Jakovcevski M, Dincer A, Amaral AC, Ginns E, Galdzicka M, Bryce CP et al. 2016. DNA methylation signatures of early childhood malnutrition associated with impairments in attention and cognition. Biol Psychiatry. 80:765–774. [DOI] [PMC free article] [PubMed] [Google Scholar]
- Preston AR, Eichenbaum H. 2013. Interplay of hippocampus and prefrontal cortex in memory. Curr Biol. 23(17):R764–R773. [DOI] [PMC free article] [PubMed] [Google Scholar]
- Radley JJ, Williams B, Sawchenko PE. 2008. Noradrenergic innervation of the dorsal medial prefrontal cortex modulates hypothalamo-pituitary-adrenal responses to acute emotional stress. J Neurosci. 28:5806–5816. [DOI] [PMC free article] [PubMed] [Google Scholar]
- Rubinov M, Sporns O. 2010. Complex network measures of brain connectivity: uses and interpretations. Neuroimage. 52:1059–1069. [DOI] [PubMed] [Google Scholar]
- Rushmore J, Luebke J, Galler JR. 1998. Electrophysiological properties of rat hippocampal principal cells are unaltered by prenatal protein malnutrition. Hippocampus. 8:380–389. [DOI] [PubMed] [Google Scholar]
- Rushmore RJ, Valero-Cabre A, Lomber SG, Hilgetag CC, Payne BR. 2006. Functional circuitry underlying visual neglect. Brain. 129:1803–1821. [DOI] [PubMed] [Google Scholar]
- Sáez-Briones P, Soto-Moyano R, Burgos H, Castillo A, Valladares L, Morgan C, Pérez H, Barra R, Constandil L, Laurido C et al. 2015. β2-adrenoceptor stimulation restores frontal cortex plasticity and improves visuospatial performance in hidden-prenatally-malnourished young-adult rats. Neurobiol Learn Mem. 119:1–9. [DOI] [PubMed] [Google Scholar]
- Sarter M, Hasselmo ME, Bruno JP, Givens B. 2005. Unraveling the attentional functions of cortical cholinergic inputs: interactions between signal-driven and cognitive modulation of signal detection. Brain Res Brain Res Rev. 48:98–111. [DOI] [PubMed] [Google Scholar]
- Sharp FR, Kilduff TS, Bzorgchami S, Heller HC, Ryan AF. 1983. The relationship of local cerebral glucose utilization to optical density ratios. Brain Res. 263:97–103. [DOI] [PubMed] [Google Scholar]
- Sokoloff L, Reivich M, Kennedy C, Des Rosiers MH, Patlak CS, Pettigrew KD, Sakurada O, Shinohara M. 1977. The [14C]deoxyglucose method for the measurement of local cerebral glucose utilization: theory, procedure, and normal values in the conscious and anesthetized albino rat. J Neurochem. 28(5):897–916. [DOI] [PubMed] [Google Scholar]
- Soto-Moyano R, Alarcón S, Belmar J, Kusch C, Pérez H, Ruiz S, Hernández A. 1998. Prenatal protein restriction alters synaptic mechanisms of callosal connections in the rat visual cortex. Int J Dev Neurosci. 16:75–84. [DOI] [PubMed] [Google Scholar]
- Soto-Moyano R, Valladares L, Sierralta W, Pérez H, Mondaca M, Fernández V, Burgos H, Hernández A. 2005. Mild prenatal protein malnutrition increases alpha2C-adrenoceptor density in the cerebral cortex during postnatal life and impairs neocortical long-term potentiation and visuo-spatial performance in rats. J Neurochem. 93:1099–1109. [DOI] [PubMed] [Google Scholar]
- St Clair D, Xu M, Wang P, et al. 2005. Rates of adult schizophrenia following prenatal exposure to the Chinese famine of 1959-1961. JAMA. 294(5):557–562. [DOI] [PubMed] [Google Scholar]
- Susser E, St Clair D. 2013. Prenatal famine and adult mental illness: interpreting concordant and discordant results from the Dutch and Chinese famines. Soc Sci Med. 97:325–330. [DOI] [PubMed] [Google Scholar]
- Susser E, Neugebauer R, Hoek HW, et al. 1996. Schizophrenia after prenatal famine. Further evidence. Arch Gen Psychiatry. 53(1):25–31. [DOI] [PubMed] [Google Scholar]
- Susser ES, Lin SP. 1992. Schizophrenia after prenatal exposure to the Dutch Hunger Winter of 1944-1945. Arch Gen Psychiatry. 49(12):983–988. [DOI] [PubMed] [Google Scholar]
- Upadhyay J, Baker SJ, Chandran P, Miller L, Lee Y, Marek GJ, Sakoglu U, Chin C-L, Luo F, Fox GB et al. 2011. Default-mode-like network activation in awake rodents. PLoS One. 6:e27839. [DOI] [PMC free article] [PubMed] [Google Scholar]
- Waber DP, Bryce CP, Fitzmaurice GM, Zichlin ML, McGaughy J, Girard JM, Galler JR. 2014. Neuropsychological outcomes at midlife following moderate to severe malnutrition in infancy. Neuropsychology. 28:530–540. [DOI] [PMC free article] [PubMed] [Google Scholar]
- Waber DP, Bryce CP, Girard JM, Zichlin M, Fitzmaurice GM, Galler JR. 2014. Impaired IQ and academic skills in adults who experienced moderate to severe infantile malnutrition: a 40-year study. Nutr Neurosci. 17:58–64. [DOI] [PMC free article] [PubMed] [Google Scholar]
- Watts DJ, Strogatz SH. 1998. Collective dynamics of “small-world” networks. Nature. 393:440–442. [DOI] [PubMed] [Google Scholar]
Associated Data
This section collects any data citations, data availability statements, or supplementary materials included in this article.