

Abstract
Interlaminar astrocytes (ILAs) are a subset of cortical astrocytes that reside in layer I, express GFAP, have a soma contacting the pia, and contain long interlaminar processes that extend through several cortical layers. We studied the prenatal and postnatal development of ILAs in three species of primates (rhesus macaque, chimpanzee, and human). We found that ILAs are generated prenatally likely from radial glial (RG) cells, that ILAs proliferate locally during gestation, and that ILAs extend interlaminar processes during postnatal stages of development. We showed that the density and morphological complexity of ILAs increase with age, and that ILAs express multiple markers that are expressed by RG cells (Pax6, Sox2, and Nestin), specific to inner and outer RG cells (Cryab and Hopx), and astrocyte markers (S100β, Aqp4, and GLAST) in prenatal stages and in adult. Finally, we demonstrated that rudimentary ILAs in mouse also express the RG markers Pax6, Sox2, and Nestin, but do not express S100β, Cryab, or Hopx, and that the density and morphological complexity of ILAs differ between primate species and mouse. Together these findings contribute new information on astrogenesis of this unique class of cells and suggest a lineal relationship between RG cells and ILAs.
Keywords: astrocytes, astrogenesis, cerebral cortex, development, primates
Introduction
The cerebral cortex has an exceptional cellular complexity. Thus, a coordinated, developmental plan is required for correct formation. Astrocytes have been recognized to play a crucial role in the formation and function of the cerebral cortex. For example, they are involved in blood-brain barrier maintenance (Herndon et al. 2017), synapse formation, elimination, and function (Pfrieger and Barres 1997; Ullian et al. 2001, 2004; Pfrieger 2010), calcium flux regulation (Agulhon et al. 2008; Zhang et al. 2017), and neuropeptide release and reuptake (Verkhratsky and Nedergaard 2018). Together with neurons, astrocytes are actively involved in information processing (Agulhon et al. 2010; Hamilton and Attwell 2010), through participation in synaptic plasticity (Araque and Navarrete 2010). In the developing central nervous system, astrocytes are involved in region-specific functions, such as serving as progenitor cells in the subventricular zone (SVZ) and in the dentate gyrus (Ihrie and Alvarez-Buylla 2008) or guiding cell migration in the cerebellum and in the retina (Reichenbach et al. 2010). Astrocytes present phylogenetic patterns and species-specific features, showing higher morphological complexity in primates than in other mammalian groups (Oberheim et al. 2006, 2009).
Interlaminar astrocytes (ILAs) are a subset of GFAP+ astrocytes in the cerebral cortex. ILAs can be identified based on a soma in layer I and long interlaminar processes that extend radially toward deep cortical layers (Fig. 1a–d). In contrast to other astrocytes which occupy a restricted intra-laminar domain, ILAs possess long processes spanning many cortical layers (Colombo et al. 2000; Falcone et al. 2019). Thus, the major identification difference between ILAs and other astrocytes is their morphology and the anatomical domain they occupy. The interlaminar processes of ILAs confer a potential role for modulation of cerebral cortex columnar functions (Colombo et al. 1997). The initial description of ILAs was performed in the lateral and ventral cortex of a number of mammals (e.g., species within the Scandentia and Chiroptera orders) (Colombo et al. 1998, 2000, 2004). Our work showed that ILAs are present in the cerebral cortex of all mammalian species (Falcone et al. 2019). We previously classified ILAs into pial and subpial ILA types, based on their soma morphology and position relative to the pia. Pial ILAs have an inverted pyramidal shaped soma in close contact with the pial surface (as shown by Andriezen 1893). Subpial ILAs have a soma in upper layer I that does not contact the pia, but include at least one short process that contacts the pia (as shown by Korzhevskii et al. 2005). We confirmed the astrocytic molecular properties of pial ILAs and found that, while the density of ILA soma within layer I was relatively constant across species, the morphological complexity of ILA processes varied greatly. In primates with larger brain sizes, specifically great apes and human, pial ILAs exhibited the highest complexity. We further demonstrated that pial interlaminar processes contact neurons, pia, and capillaries in adult rhesus macaques, suggesting a potential role for ILAs in maintenance of the blood-brain barrier, and facilitating the communication between neurons, astrocytes, capillaries, meninges, and cerebrospinal fluid (Falcone et al. 2019). We further described two types of ILAs: typical ILAs and rudimentary ILAs (Falcone et al. 2019). Typical ILAs are GFAP+, possess long interlaminar processes exiting layer I, and are only observed in species of the Orders Primates, Scandentia, Chiroptera, Carnivora, Artiodactyla, Hyracoidea, and Proboscidea. Rudimentary ILAs possess GFAP+ interlaminar-like processes that course radially toward deeper cortical layers but do not exit layer I and are found in rodents and many other mammalian orders. Rudimentary ILAs in mouse have been previously referred as “astrocytes of layer I” or “pial astrocytes” (García-Marqués and López-Mascaraque 2013; Figueres-Oñate et al. 2016; Lanjakornsiripan et al. 2018; Clavreul et al. 2019). While rudimentary ILAs are present in ventral and dorsal cortex in all species, typical ILAs are present dorsally only in some species (Falcone et al. 2019).
Figure 1 .
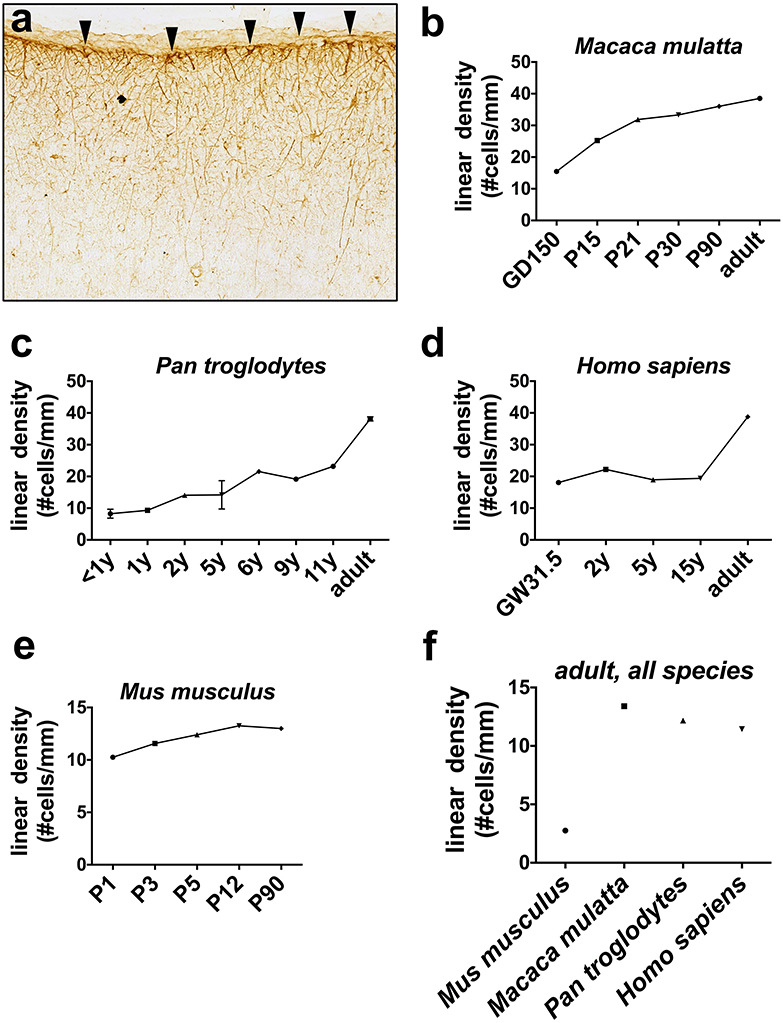
ILA linear density increases across development. ILA linear density (number of ILA cells per mm of pia mater in different developmental stages. (a) Representative image of GFAP+ IHC used to count ILAs. The arrowheads point at ILA somas along the pial surface. ILA linear density in developmental stages of (b) rhesus macaque (M. mulatta), (c) chimpanzee (P. troglodytes), (d) human (H. sapiens), and (e) mouse (Mus musculus). (f) ILA linear density in adult mouse, macaque, chimpanzee, and human. GD = gestation day; P = postnatal day; y = year(s); GW = gestation week.
ILA development has been documented postnatally, however very little is known about ILAs during prenatal development (Colombo et al. 1997). Here, we provide a thorough analysis of pial ILA features across development and consider potential sources for ILA developmental origin in three species of primates: rhesus macaque (Macaca mulatta), chimpanzee (Pan troglodytes), and human (Homo sapiens). We provide evidence that pial ILAs have a prenatal origin, and that their density and morphological complexity increase during postnatal development. We show that ILAs express markers common for both stem/progenitor cells and astrocytes during development and retain the expression of these markers in the adult. We demonstrate that pial ILAs proliferate in the prenatal cortex but no longer express the proliferation marker Ki67 at full term in the rhesus macaque. Finally, we examined the phylogenetic relationship between typical ILAs in primates and rudimentary ILAs in the mouse and found they share the expression of some key stem/progenitor cell and astrocyte markers but not others. Rudimentary ILAs exhibit a reduced density and morphological complexity across development in the murine brain compared to primates. These novel findings provide evidence that pial ILAs are generated prenatally in primates, possibly by RG cells, and that their morphology, developmental trajectory, and marker expression is only partially conserved between primates and rodents.
Methods
Specimens
Several developmental stages were included for each species: n = 7 (3 animals per stage) for mouse, n = 19 for rhesus macaque, n = 9 for chimpanzee, and n = 12 for human. Species and developmental stages included in this study are shown in Supplementary Table 1. Individuals of 9-10 year of age were considered adolescent and of 28-31 years adult for chimpanzee; 15 years of age were considered adolescent and 50-52 years adult for human. All procedures for collecting rhesus specimens (M. mulatta) were approved by the Institutional Animal Care and Use Committee at the University of California, Davis, and were consistent with the requirements of the Animal Welfare Act. Activities related to animal care including diet and housing were performed as per standard operating procedures at the California National Primate Research Center. Normally cycling, adult female rhesus monkeys (M. mulatta) with a history of prior pregnancy were bred and identified as pregnant according to established methods (Tarantal et al. 2005). Fetal tissues were collected by hysterotomy using established protocols those from postnatal animals were obtained at scheduled tissue harvests. Mouse brains were also collected at UC Davis under approval of the UC Davis Institutional Animal Care and Use Committee. Chimpanzee postmortem brain specimens were provided by the National Chimpanzee Brain Resource (www.chimpanzeebrain.org). American Psychological Association and National Institute of Health guidelines for the ethical use of chimpanzees were adhered during all aspects of this research. Human control samples were obtained from the Department of Pathology and Laboratory Medicine at the University of California, Davis. These were specimens from subjects that did not present any significant neurological history. All human tissue specimens were collected through consented autopsies with Institutional Review Board approval and in established biobanks.
Tissue processing
Mouse and macaque specimens used in the current study were euthanized and intracardially perfused with saline followed by 4% paraformaldehyde (PFA) in 0.1 M Phosphate-buffered saline (PBS). The brains were then removed and postfixed by immersion in 4% PFA for 2–4 days at 4 °C (depending on brain size), washed by 0.1 M PBS, and cryoprotected in 30% sucrose in 0.1 M PBS at 4 °C for at least 2 days. Specific anatomical regions were dissected: ventral frontal cortex rostral to the anterior commissure for mouse and dorsal frontal cortex. Tissue blocks were cryoprotected and embedded into Killik OCT (#4585, ThermoFisher, Waltham, MA), frozen with 2-methylbutane, serially sectioned on a Leica cryostat at 40 μm and mounted on coated glass slides (#12–550-15, ThermoFisher). Chimpanzee and human samples were collected postmortem (postmortem interval < 14 h for chimpanzee and < 24 h for human), and immersion fixed in 10% buffered formalin solution for at least 10 days. These specimens were transferred to a 0.1% sodium azide-0.1 M PBS at 4 °C for storage. Cortical area 10 in chimpazee and Broadmann area 9 in human were dissected. Before sectioning, samples were cryoprotected in a graded series of 10%, 20%, and 30% sucrose solutions and cut frozen. Tissue blocks were sectioned (40 μm or 16 μm-thick sections for chimpanzee and human, respectively), perpendicular to the main axis of the gyrus present in the block, using a Leica SM200R freezing sliding microtome (Buffalo Grove, IL) or a Leica cryostat. Chimpanzee brain sections were placed into individual centrifuge tubes containing cryoprotectant solution (30% dH2O, 30% ethylene glycol, 30% glycerol, 10% 0.244 M PBS), numbered sequentially, and stored at ≤−20 °C until histological or immunohistochemical processing. Postmortem examination showed no evidence of neuro-anatomical abnormalities. Human sections were mounted on coated glass slides.
Immunostaining
One section from each animal and age was stained with cresyl violet (Nissl staining) for histological reference. Sections adjacent to the Nissl-stained section were used for immunostaining. For enzymatic immunohistochemistry staining, we followed a previously established protocol, as described in Falcone et al. (2019). For human sections, heat-mediated antigen retrieval was performed (110 °C, 8 min). We used primary antibodies anti-GFAP (rabbit polyclonal 1:400, Z0334, former DAKO now Agilent, Santa Clara, CA, RRID:AB_10013382); anti-S100β (rabbit polyclonal 1:300, ab52642, Abcam, Cambridge, MA, RRID:AB_882426), and secondary antibody biotin-conjugated donkey anti-rabbit (1:150, Jackson ImmunoResearch #711–066-152; RRID_AB2340593). We amplified with avidin-biotin complex (ABC, #PK-61-00, Vector Laboratories), and developed with DAB substrate (#SK-4105, Vector Laboratories).
For immunofluorescence staining, we followed a previously established protocol (Falcone et al. 2019), with the following primary antibodies: anti-Aqp4 (rabbit polyclonal 1:400, #3594, Millipore-Sigma, RRID:AB_91530); anti-Cryab (mouse monoclonal 1:300, ab13496, Abcam, RRID:AB_300400); anti-GFAP (rabbit polyclonal 1:400, Z0334, Agilent, RRID:AB_10013382); anti-GFAP (mouse monoclonal 1:400, G3893, Millipore Sigma, RRID:AB_477010); anti-Glast (rabbit monoclonal, 1:200, #181036, Abcam); anti-Hopx (mouse monoclonal, SC398703, Santa Cruz, RRID:AB_2687966); anti-Ki67 (rabbit polyclonal 1:400, ab15580, Abcam, RRID:AB_443209); anti- Nestin (rabbit polyclonal 1:1000, ab92391, Abcam, RRID:AB_10561437); anti-Pax6 (rabbit polyclonal 1:300, PRB-278P, Covance, RRID:AB_291612); anti-S100β (rabbit polyclonal 1:300, ab52642, Abcam, RRID:AB_882426); anti-Sox2 (rabbit monoclonal 1:100, ab92494, Abcam, RRID:AB_10585428). Secondary antibodies used were: AlexaFluor#488 or AlexaFluor#594 conjugated polyclonal anti-rabbit/mouse antibodies (1:600, Jackson Immuno Research, RRID:AB_141708, RRID:AB_141633, RRID:AB_2340621, RRID:AB_2340850) and DAPI used (1:1000, #10236276001, Hoffmann-La Roche, Basel, Switzerland) to stain nuclei. The primary antibody was omitted as negative control for each immunostaining experiment.
DiI and DiO administration
DiI (#468495, Millipore-Sigma) and DiO (D4292, Millipore-Sigma) were injected in the VZ or pial surface of 100 μm-thick sections of macaque brains (GD50 and GD131). The DiI and DiO diffused into the sections over 24 h at 37 °C, and imaged immediately at the 24 h time point (as described below).
Microscopic imaging
In the case of immunoenzymatic staining, brightfield micrographs were acquired on an Olympus microscope (Olympus Corporation, Tokyo Japan), equipped with a high-resolution camera using a ×40 oil objective. Brightfield images were taken as Z-stacks of an average of 10 1.8 μm-spaced focal planes for nonhuman primates and mouse and an average of five 1.8 μm-spaced focal planes for human, and merged with the StackFocuser plugin on Fiji software. For immunofluorescence, images were taken with a Nikon C2 or a Nikon A1 confocal microscope (Nikon, Melville, NY), with ×60 oil and ×100 oil objectives, as Z-stacks of at least 10 1.8 mm-spaced focal planes and merged in MAX-modality on Fiji software. In Figure 1f, a single optical section was analyzed per species.
Quantification
For linear density analysis, both typical and rudimentary ILA in contact with the pia mater were counted at different developmental stages, for each species. We defined density as the number of ILA per pial length (mm). ILA density was measured in three randomly selected, 5 mm wide images per specimen.
Neurolucida analysis
At least 20 ILA cells were randomly selected from ventral (mouse) and dorsal (for all species) frontal cortex. ILAs were identified by the soma attached to the pial surface, and by processes extending towards deep cortical layers. Cells were chosen based on the presence of GFAP immunostaining and no staining artifacts. Each cell was scanned under a ×40 oil objective by moving across the depth of the Z plane with Neurolucida 8 software (MBF Bioscience, Willinston, VT) and an Olympus microscope equipped with a high-resolution digital camera, a mechanical stage, and an x-y-z axis encoder. The following parameters were analyzed on Neurolucida Explorer software: number of primary processes (# primary processes), number of branching nodes (# nodes), number of total process endings (# ends), total length covered by the processes (total process length), and a complexity index (complexity, calculated as Complexity = [Sum of the terminal orders + Number of terminals] * [Total process length/Number of primary processes]). 2D images of the 3D reconstructions were generated and are shown in Figure 2.
Figure 2 .
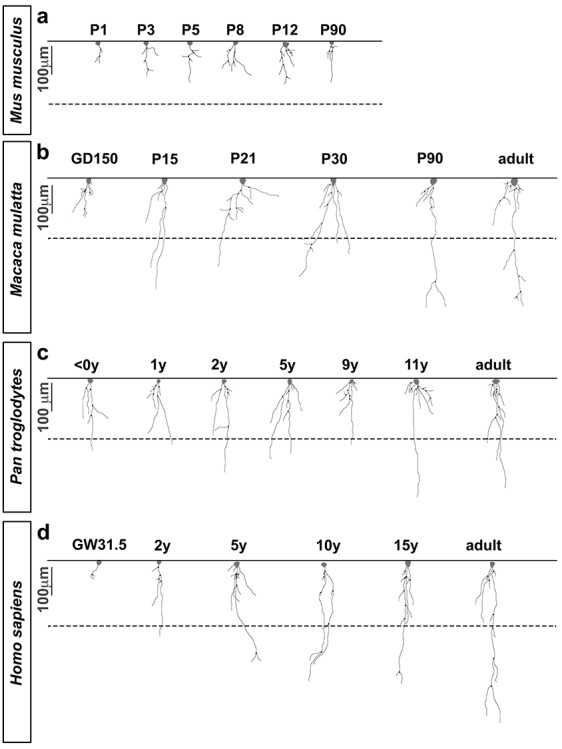
ILA morphological complexity increases across development. Representative Neurolucida ILA reconstructions depicting the developmental progression of ILA morphology in (a) mouse, (b) macaque, (c) chimpanzee, and (d) human. Full lines = pia surface. Dashed lines = Layers I and II boundary. Scale bar applies to all images = 100 μm.
Statistical analysis
In Figures 3–6 and 8, data from each developmental stage were averaged, and standard deviations and standard errors (s.e.m.) calculated in case of n ≥ 3. In Figures 3–5, data obtained from single cells at the same developmental stage/age and same species were averaged, and standard deviations and standard errors calculated. Section thickness differed among species but was similar within each species. Statistical analysis was always performed for sections within species.
Figure 3 .
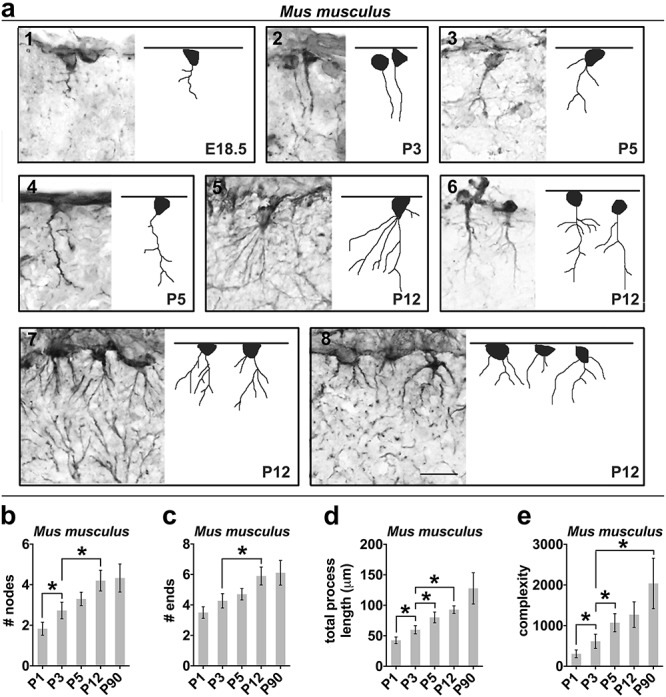
ILA morphology complexity increases across mouse development. (a1–a8) Representative images of GFAP+ rudimentary ILAs and reconstructions at different developmental stages of mouse. The pia mater is represented by a line on top of each image. (b–e) Numerical data calculated by Neurolucida analyzer per single cell in mouse; specifically: (b) average number of nodes (independent t-tests comparing P1 and P3: P < 0.02; P3 and P12: P < 0.03); (c) average number of ending points (independent t-tests comparing P3 and P12: P < 0.02); (d) average total process length (independent t-tests comparing P1 and P3: P < 0.02; P3 and P5: P < 0.04; P3 and P12: P < 0.002); (e) average complexity index (independent t-tests comparing P1 and P3: P < 0.03; P3 and P5: P < 0.03). Error bars = s.e.m. * = P value < 0.05. Scale bar applies to all images = 50 μm.
Figure 6 .
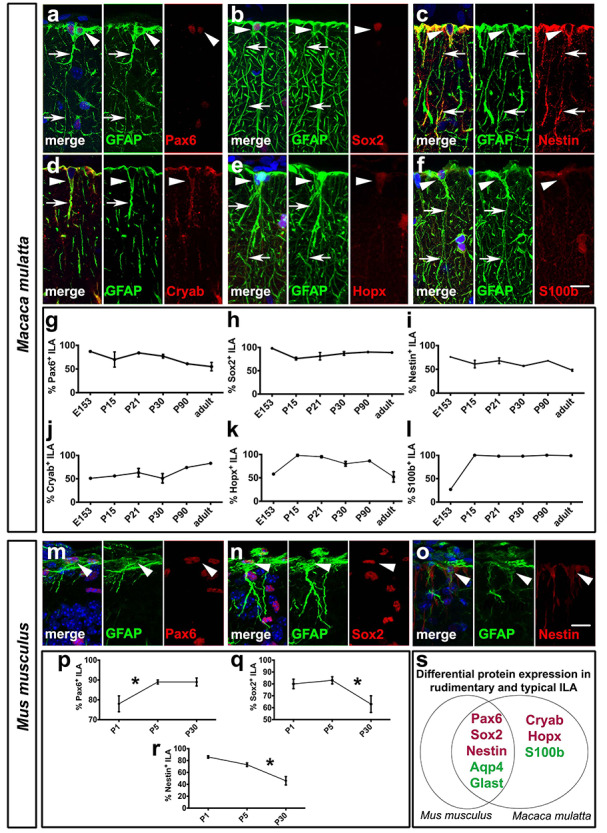
ILAs express stem/progenitor cell and astrocyte markers in developing and adult rhesus macaque and mouse. (a–f) Double immunofluorescence staining of GFAP, in green, and: (a) Pax6, (b) Sox2, (c) Nestin, (d) Cryab, (e) Hopx, (f) S100β, in red. (g–l) Percentage of GFAP+ ILAs positive for (g) Pax6, (h) Sox2, (i) Nestin, (j) Cryab, (k) Hopx, (l) S100β, respectively, across different developmental stages of macaque (a: P21, b: P90, c: GD150, d: GD150, e: P30, f: P15). (m–o) Double immunofluorescence staining of GFAP, and Pax6, Sox2, or Nestin, respectively, in mouse at P5. (p–r) Percentage of GFAP+ ILAs positive for (p) Pax6, (q) Sox2 (independent t-tests comparing P5 and P30: P < 0.02), (r) Nestin (independent t-tests comparing P5 and P30: P < 0.01), (s) Differential protein expression in rudimentary and typical ILAs in mouse and rhesus macaque, respectively. Pia surface is on top. White arrowheads point to ILA somas. * = P value < 0.05. Scale bar applies to all images = 50 μm.
Figure 8 .
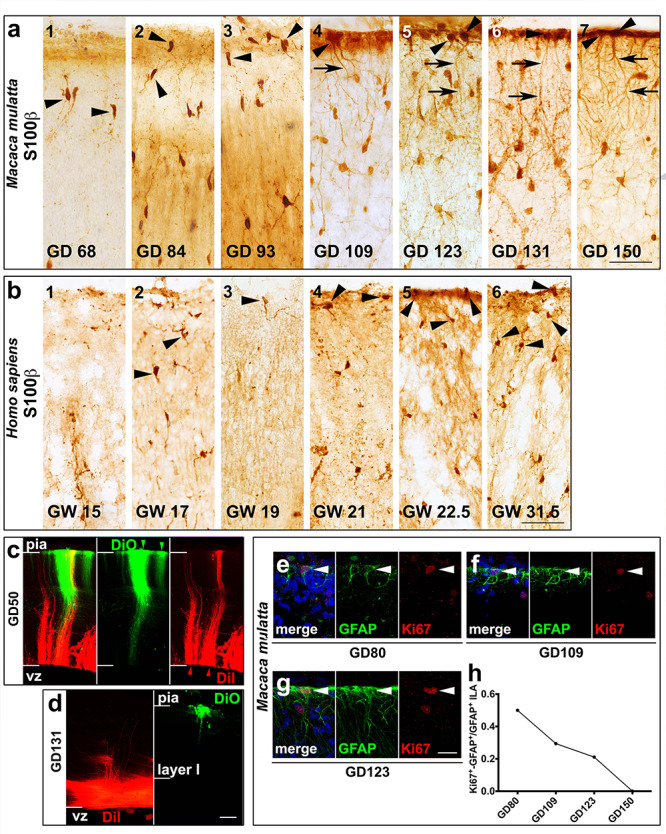
ILAs develop and proliferate prenatally. (a,b) S100β+ ILA somas in prenatal stages of (a) macaque and (b) human. The black arrowheads point to ILA somas. The black arrows point at ILA processes. (c–d) DiI (red) and DiO (green) injected in the VZ and the pia, respectively at GD50 (c) and GD131 (d). (e-g) Double immunofluorescence staining anti-GFAP and anti-Ki67 at GD80, GD109 and GD123, respectively, in macaque. White arrowheads point to ILA somas. (h) Ki67+-GFAP+ ILA frequency across development in macaque. Scale bars = 20 μm in a–f; 50 μm in m–o.
Figure 5 .
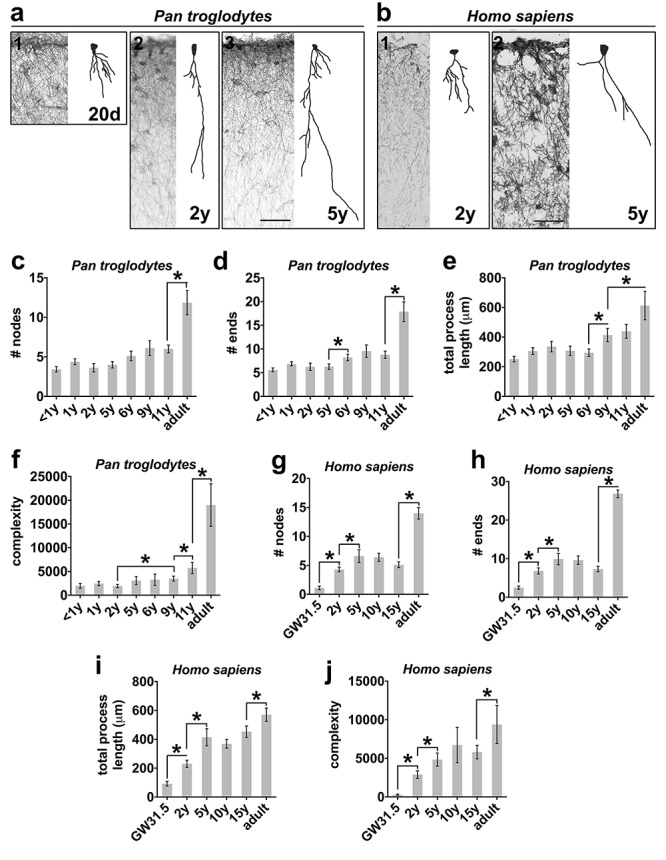
ILA morphology complexity increases across chimpanzee development. (a1–a3, b1 and b2) Representative images of GFAP+ ILA and cell reconstructions at different developmental stages of chimpanzee (a1–a3) and human (b1 and b2). The pia mater is represented by a line on the top of each image. (c–j) Numerical data calculated by Neurolucida analyzer per single cell in chimpanzee and human; specifically: (c,g) average number of nodes (independent t-tests comparing 11 yearsand adult: P < 0.006 in [c]; GW 31.5 and 2 years: P < 1.1 × 10⁻⁵, 2 and 5 years: P < 0.04, 15 years and adult: P < 6.6 × 10⁻⁶ in [g]); (d, h) average number of ending points (independent t-tests comparing 5 and 6 years: P < 0.02, 11 years and adult: P < 0.002 in [d]; GW31.5 and 2 years: P < 0.0003, 2 and 5 years: P < 0.05, 15 years and adult: P < 1.1 × 10⁻¹⁴ in [h]); (e, i) average total process length (independent t-tests comparing 6 and 9 years: P < 0.02, 9 years and adult: P < 0.05 in [e]; GW31.5 and 2 years: P < 0.0002, 2 and 5 years: P < 0.006, 15 years and adult: P < 0.001 in [i]); (f, j) average complexity index (independent t-tests comparing 2 and 9 years: P < 0.01, 9 and 11 years: P < 0.05, 11 years and adult: P < 0.02 in [f]; GW31.5 and 2 years: P < 0.0001, 2 and 5 years: P < 0.03, 15 years and adult: P < 0.04 in [j]). Error bars = s.e.m. * = P value < 0.05. Scale bar applies to all images = 50 μm.
Results were compared across different development stages/ages within the same species using independent (2-sample) t-tests. Statistical significance was set at an α level of 0.05. In the case of single developmental stages, standard values were not calculated. When significant, specific P value obtained for each t-test analysis was reported.
Results
ILA density and morphological complexity increase during development in primates
We quantified the density and morphological complexity of ILAs across development in frontal cortical tissue immunostained with an anti-GFAP antibody. We identified ILAs as GFAP+ astrocytes with the soma in layer I in strict contact with the pia, and with short and/or long processes traveling perpendicular to the pia toward deeper cortical layers (as shown in Fig. S1 and Fig. 1a). We quantified ILA linear density—the number of ILA somata per linear mm of pial meninges in coronal sections—across third trimester prenatal and early postnatal developmental stages of macaque (gestation day (GD)150, postnatal day (P) 15, 21, 30, 90, and 10 years of age), chimpanzee (0–1, 1, 2, 5, 6, 9, 11, 28, 30 years), and human (gestation week (GW) 31.5, 2, 5, 10, 15, 50 and 52 years), (see Supplementary Table 1). We found that ILA linear density gradually increased postnatally and during adulthood. From birth to adult, ILA density doubled in rhesus macaque and human, and quadrupled in chimpanzee (Fig. 1b–d). Using Neurolucida software, we reconstructed the morphology of at least 10 ILAs located in the prefrontal cortex from each developmental stage for each species. We quantified the number of primary processes, the number of nodes, the number of process ends, the sum of the length of all the major processes per ILA, and the complexity index for each cell. In all primate species, we found that while the number of primary processes did not significantly change during development and later (Fig. S2a-c), the number of nodes and ends and the total process lengths progressively increased across developmental stages reaching the highest level in adult (Fig. 2b–d, Fig. 4a–d, Fig. 5a–e, g–i). In line with these findings, the complexity index of ILA morphology was the highest in adult cortices (Fig. 2b–d, Fig. 4e, Fig. 5f,j). In both chimpanzee and human brain, the increased complexity of ILAs in adult versus adolescent individuals was significant (chimpanzee: +312.1%, P < 0.001; human: +113.3%, P < 0.04), (Fig. 5f, j).
Figure 4 .
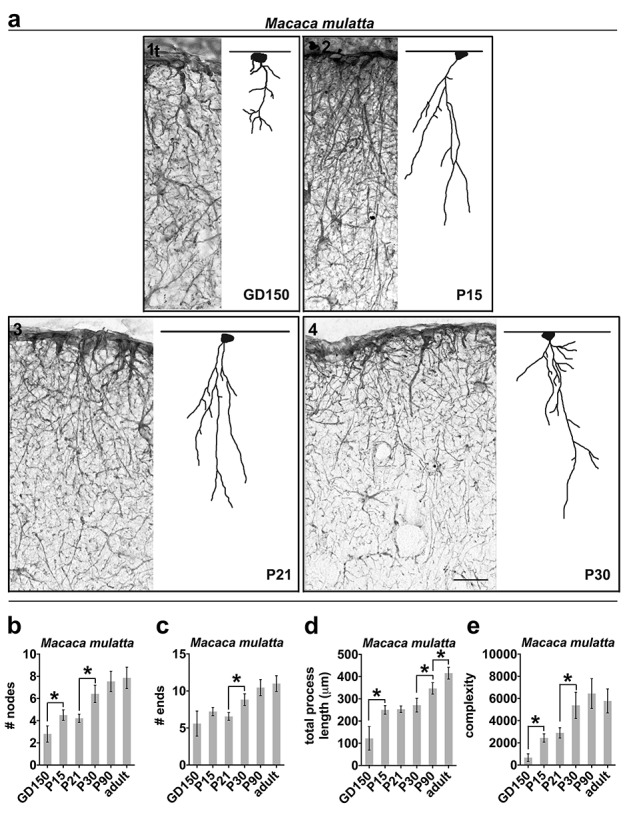
ILA morphology complexity increases across rhesus macaque development. (a1–a4) Representative images of GFAP+ ILAs and cell reconstructions at different developmental stages of macaque. (b–e) Numerical data calculated by Neurolucida analyzer per single cell in macaque monkey; specifically: (b) average number of nodes (independent t-tests comparing GD150 and P15: P < 0.04; P21 and P30: P < 0.003); (c) average number of ending points (independent t-tests comparing P21 and P30: P < 0.007); (d) average total process length (independent t-tests comparing GD150 and P15: P < 0.01; P30 and P90: P < 0.02, P90 and adult: P < 0.04); (e) average complexity index. Error bars = s.e.m. * = P value < 0.05. Scale bar applies to all images = 50 μm.
ILAs express both stem cell and astrocyte markers during development in macaque
We characterized the molecular expression patterns of GFAP+ ILAs in macaque by immunostaining the tissue with stem/progenitor cell markers (Pax6, Sox2, Nestin, Cryab, Hopx) and astrocyte markers (S100β, Aqp4, Glast1) across all ages. We found that most ILAs expressed the stem cell markers Pax6 and Sox2 during development and in adult. The percentage of Pax6+ and Sox2+ ILAs was slightly lower in adult than in prenatal stages (87.1% Pax6+ and 98.2% Sox2+ at late third trimester, (GD150); 54.6% Pax 6+ and 89.5% Sox2+ in adult, Fig. 6a,b,g,h). GFAP+ ILAs in rhesus macaque also expressed Nestin, with the proportion of ILAs expressing Nestin lower in adult (72.3% in the third trimester versus 47.7% in adult, Fig. 6c,i). We found that GFAP+ ILAs also expressed markers that are expressed by inner and outer RG cells in the developing cortex (Cryab and Hopx (Pollen et al. 2015; Thomsen et al. 2016)). These markers were widely expressed by ILAs during early stages of development with expression maintained in adult (Cryab, 82.6%; Hopx, 52.2% in adult, Fig. 6d,e,j,k). These data suggest the possibility that ILAs arise from a late RG cell subpopulation, but other sources, such as cortical astrocytes, cannot be excluded. We also analyzed the expression of well-known astrocyte markers (Aqp4, Glast1, S100β) across development in the rhesus macaque cortex. Near term, at GD150, 100% of ILAs expressed Aqp4 and Glast (data not shown), while less than one-third of GFAP+ ILAs expressed S100β (26.7%). In postnatal rhesus macaques 100% of GFAP+ ILAs expressed the Aqp4 and Glast markers, and 100% expressed S100β at 2 and 3 weeks postnatal age, and in adult (Fig. 6f,l and Fig. S6a-f).
ILAs have a prenatal origin in primates
To elucidate when ILAs are born we collected cortical tissue at specific prenatal stages of both rhesus macaques (GD50 [late first trimester], GD68, GD73, GD80, GD92, GD93, GD97, GD105 [second trimester], GD109, GD121, GD123, GD131 and GD150 [third trimester], total n = 12), and human (GW15, GW17, GW19, GW21, GW22.5 and GW31.5) frontal cortex, and stained sections with GFAP and S100β markers (see Supplementary Table 1).
GFAP+ interlaminar processes were observed in early prenatal stages. However, GFAP labeled both ILAs and RG fibers (Cunningham et al. 2013; Falcone et al. 2019) (Fig. 7). At GD50 (late first trimester) and GD68 (mid-second trimester) in the rhesus macaque, almost all of GFAP+ RG fibers contacted the pial surface, while at GD109 (beginning of the third trimester) and beyond we observed fewer GFAP+ RG fibers in the cortical plate (Fig. 7a,c,e). To determine whether GFAP+ interlaminar processes observed in early prenatal stages belonged to GFAP+ ILAs and were not fibers of GFAP+ RG cells, we deposited the lipophilic tracers DiI in the ventricle and DiO in the pia, in 4% PFA-fixed tissue obtained from late first trimester (GD50) and mid-third trimester (GD131) rhesus macaque brain. We found that RG fibers contacting the pial surface were both green and red in the late first trimester (Fig. 8c). However, in the third trimester, DiI signal was confined in close proximity to the ventricle and DiO signal was located in the meninges and cortical plate, suggesting that few RG fibers were in contact with the pia (Fig. 8d). These data demonstrate that GFAP+ fibers emanating from the pia in the third trimester belong to ILA cell bodies in layer I.
Figure 7 .
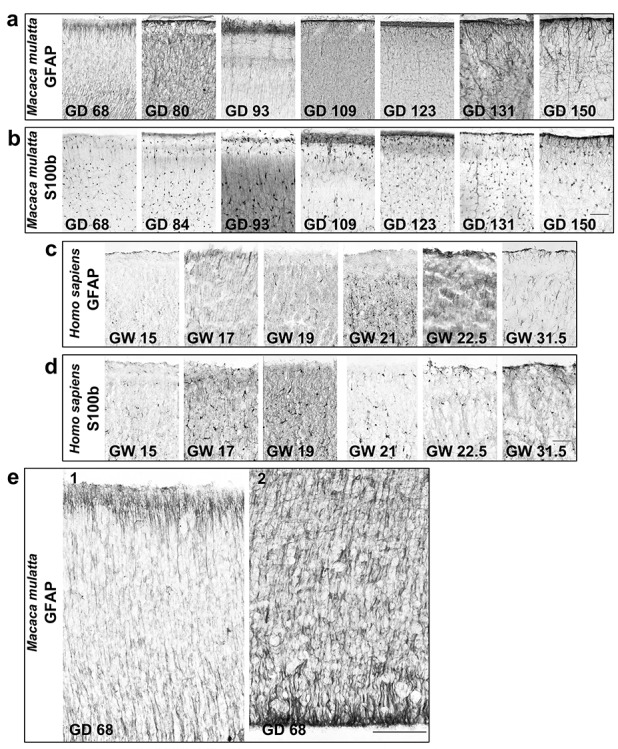
ILAs develop prenatally in macaques and human. (a,b) ×40 magnification pictures of immunoenzymatic staining anti-GFAP and anti-S100β, DAB amplified, showing ILA somas in prenatal stages of (a,b) M. mulatta and (c,d) H. sapiens. Scale bars = 50 μm. (e) ×100 magnification pictures of immunoenzymatic staining anti-GFAP at GD68 of M. mulatta, showing RG fibers attached to the pia (e1) and emanating from the ventricular zone (e2). Scale bar applies to both images = 100 μm.
To further distinguish between GFAP+ ILA processes and GFAP+ RG fibers we stained tissue with an antibody against S100β, which labels astrocytes but not RG cell fibers. At (GD93 late second trimester) and thereafter, S100β+ astrocytes were distributed throughout the cortical plate. S100β+ cells similar in morphology to ILAs were located at the pial surface in tissue obtained from GD109 macaque and GW21 human, (Fig. 8a,b). S100β+ cells at the pia had an inverted pyramidal cell morphology with the base of the pyramid contacting the pial surface and extended short and branched processes but these did not exit layer I.
Overall, these experiments are consistent with the concept that ILAs are present prenatally in rhesus macaque.
ILAs proliferate locally at the final destination
To determine if ILAs proliferate during development, we double-stained coronal slices obtained from across rhesus macaque prenatal and postnatal ages (GD80, GD109, GD123, GD150, P15, P21, P30, P90, adult, total n = 13, see Supplementary Table 1) with antibodies for GFAP and the mitotic marker Ki67, and quantified the proportion of GFAP+/Ki67+ double positive ILAs. As described above, ILAs were defined by GFAP expression and clear morphological parameters including a soma contacting the pia and an interlaminar process. We found that 50%, 30%, and 21% of ILAs expressed Ki67 at GD80 (second trimester), GD109, and GD123 (third trimester), respectively (Fig. 8e–h). We did not observe GFAP+/Ki67+ double positive ILAs after 120 gestation days. ILA proliferation was not detected in any postnatal or adult rhesus macaque specimens. These data suggest that ILAs undergo a phase of active proliferation that overlaps with the cortical neurogenic period (~GD50–GD100, or late first through late second trimesters (Rakic 1988; Kornack and Rakic 1998)) and ceases by the end of gestation.
We measured the total density of Ki67+ cells in layer I and we found that, although it decreases over time, Ki67+ cells are still present after birth (from a maximum of 150 cells/mm2 at GD80 to a minimum of 11 cells/mm2 in the adult, Fig. S3c). We immunostained the same macaque brain slices for both S100β and Ki67 to look for non-ILA proliferating astrocytes across cortical layers I to VI after birth. We detected a few S100β+/Ki67+ astrocytes in all layers until P30 (Fig. S4a–f). We also observed few GFAP+/Ki67+ astrocytes in layer VI until P30. Taken together these data indicate that no-ILA cortical astrocytes could be one of the postnatal sources of ILAs (Fig. 9, Hypothesis 3).
Figure 9 .
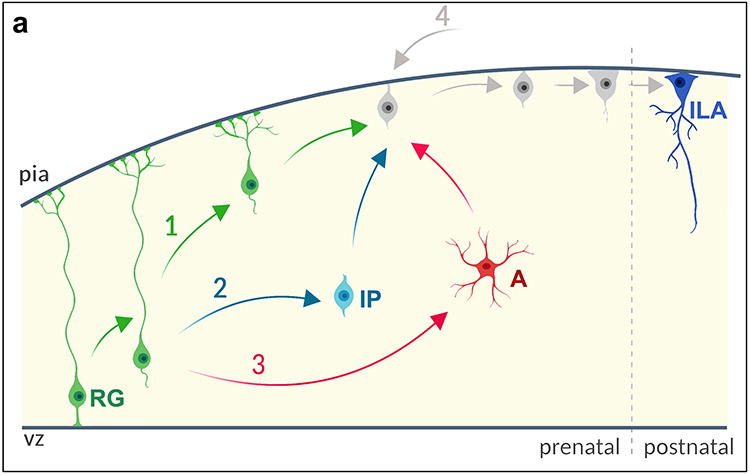
ILA are generated by RG cells: model and hypothesis. (a) ILA prenatal generation. RG = radial glia cell; IP = intermediate progenitor cell; A = astrocyte. ILAs can be locally generated in the cortex by directly transforming RG (Hypothesis 1, green), by an IP step (Hypothesis 2, light blue), by astrocytic IP step (Hypothesis 3, pink), or from other sources external to the cortex (Hypothesis 4, gray). Hypothesis are not mutually exclusive.
Primate ILAs share some features with mouse rudimentary ILAs
To investigate potential phylogenetic relationships among typical ILAs in primate and rudimentary ILAs in mouse, we performed a series of quantitative analyses of ILAs in mouse similar to the studies performed in primate tissues. We compared the linear density of ILAs in primates to that of rudimentary ILAs in the ventral cortex of the mouse (see ages below). While a progressive increase of linear density was observed across development in all primate species, we did not detect a significant change in the linear density of rudimentary ILAs in the postnatal mouse (P1, P3, P5, P8, P12, P90 Fig. 1e). In addition, the data indicate that the density of rudimentary ILAs in the adult mouse was significantly lower than that of typical ILAs in primates (−78.4 ± 3.8%, P < 4.9*10−4, Fig. 1f).
We next compared the morphological development of typical and rudimentary ILAs using Neurolucida to reconstruct developing ILA morphology. We found that, in contrast to typical ILAs, branching (number of nodes and number of ends) and total length of the interlaminar processes of murine rudimentary ILAs only slightly increased between P1 and P12 in mice, and then remained stable to adulthood (P90, Fig. 2a, Fig. 3a–d). This resulted in significantly increased morphological complexity from P1 to P3 (+160.44 ± 74.26%, P < 0.03), and from P3 to P5 (+88.70 ± 35.27%, P < 0.03). However, morphological complexity of murine rudimentary ILAs remained stable after P5 (Fig. 3e). Interestingly, we found that the morphology of ILAs in mature mouse cortex (both ventral and dorsal) was similar to the morphology and cell soma position of immature typical ILAs in the prenatal primate cortex, suggesting a possible evolutionary relationship between these two cell types.
To investigate shared features among typical and rudimentary ILAs, we stained mouse cortex (P1, P5, P30, n = 3 per age) with the same molecular markers we used in rhesus macaque. We found that rudimentary ILAs shared similar patterns of Pax6, Sox2, Nestin, Aqp4, and Glast1 expression that we observed among primate ILAs (Fig. 6m–s). Pax6+ ILA cell density did not significantly change over development, although there was a slight increase with age (from 78.3 ± 4.1 at P1 to 88.8 ± 1.6 in adults, not significant, Fig. 6p). The density of Sox2+ ILAs decreased from 80.2 ± 3.8 at P1 to 61.7 ± 7.3 in the adult (P < 0.02, Fig. 6q), and the density of Nestin+ ILAs also significantly decreased in adult mice compared to P1 (−40.6 ± 9.7%, P < 0.01). Rudimentary ILAs in the mouse always expressed Aqp4 and Glast1 from P1 through adulthood. However, Cryab, Hopx2, or S100β, which are expressed by typical ILAs in the rhesus macaque, were not expressed by mouse rudimentary ILAs at any of the developmental stages included in our study (Fig. 6s).
We investigated the timing of generation of rudimentary ILAs immunostaining prenatal stages E16.5, E17.5, and E18.5, and observed the appearance of the first rudimentary ILAs at E18.5 (Fig. 3a1), although in very limited numbers. We next assessed the proliferative status of rudimentary ILAs using Ki67 immunostaining in mouse from E18 through adult. We observed the totality of rudimentary ILAs positive for Ki67 at E18.5, high rates of proliferation at P1, a significant decrease of proliferation at P5, and did not observe any Ki67+-GFAP+ rudimentary ILAs after P5 (from 50.7 ± 4.6 to 8.1 ± 1.6% in P1 and P5, respectively, P < 0.01, Fig. S5), indicating the absence of adult ILA proliferation in the mouse.
We concluded that some but not all features present in typical primate ILAs are shared by mouse rudimentary ILAs.
Discussion
In this study, we described the development of the morphological maturation of ILAs in mouse, rhesus macaque, chimpanzee, and human. We also determined the stem/progenitor cell and astrocyte markers that are expressed by ILAs in mouse, rhesus macaque, and human. These data allowed us to investigate similarities and differences between primate typical ILAs and mouse rudimentary ILAs, and provided evidence for a prenatal origin of ILAs in primates.
ILA density and morphological complexity increase across postnatal development in primates
We found an increase in the density and complexity of ILAs across development and in adult in rhesus macaque, chimpanzee, and human. Colombo and colleagues previously showed an increase in the length of interlaminar processes across life in ceboid monkeys (Saimiri boliviensis and Cebus apella) and in humans (Colombo et al. 1997). Our data on the morphological characteristics of ILAs across development are consistent with these findings. Based on cell reconstructions, we contribute novel detail and quantitative data on ILA morphology. The gradual increase in the morphological complexity of interlaminar processes suggests that ILA processes are changing during a time when experience can impact growth. Our data are consistent with the concept that plasticity in growth of the ILA process may occur at specific developmental time points (i.e., adolescence in macaques) or may proceed gradually across the whole lifespan (i.e., in humans).
ILAs are generated prenatally in macaque and human cerebral cortex
Studies on ILAs are relatively scarce, specifically regarding the prenatal development of these cells. Studies of ILAs in postnatal primate brains have been conducted (Colombo et al. 1997, 2005), and prenatal development of layer I astrocytes as a whole have been characterized with Golgi staining of the human cerebral cortex (Marín-Padilla 1995). ILA development has not been investigated in rhesus macaque. Here, we provide novel data on the presence, morphology, and molecular expression of ILAs in prenatal macaque and human cerebral cortex. Through S100β and GFAP immunostaining, we identified newborn ILA somata attached to the pial surface in prenatal macaque and human dorsal cortex. Our data add novel details and developmental time points to previous studies, such as Marin-Padilla’s Golgi study that described early and late waves of glial cell generation in layer I of prenatal human cortices (Marín-Padilla 1995). Our data indicate that ILAs are generated before birth, extend processes that exit layer I during postnatal stages of development in both macaque and human, and that the growth and increased morphological complexity of these processes continues for several years after birth.
ILAs proliferate prenatally
We quantified the number of Ki67+/GFAP+ double-positive ILAs in the prenatal rhesus monkey cortex and found that approximately 50% of ILAs were proliferative at GD80 (second trimester), ~ 30% at GD109 (third trimester), and there were no further mitotic ILAs after GD123. These data indicate that ILAs proliferate locally at their final destination, similar to other cortical astrocytes (Ge et al. 2012; Ge and Jia 2016). Furthermore, our data indicate that after the cessation of proliferation, ILAs elaborate processes that become increasingly complex over time. The absence of proliferation in the postnatal stage was not expected since we have observed that ILAs express markers associated with stem/progenitor cells during both postnatal development and in adult (see Results, Fig. S3). It remains possible that ILAs retain the capacity to proliferate under specific conditions, such as in response to injury, similar to other cortical astrocytes (Sofroniew and Vinters 2010; Sofroniew 2015; Burda et al. 2016).
ILAs may be generated by RG cells
We hypothesize that primate ILAs are generated by RG cells. This hypothesis is supported by ILA expression of markers for inner RG cells (Cryab) and outer RG cells (Hopx) at all stages of development. The generation of ILAs from RG cells may occur through a variety of pathways including direct cellular transformation, or indirect lineal descent. Direct transformation of RG cells into ILAs is supported by a combination of ILA expression of various RG cell markers early in development (Pax6, Sox2, Nestin, Cryab, Hopx, Fig. 9a, Hypothesis 1), and by previous data going back many decades showing progressive translocation and transformation of RG cells (Schmechel and Rakic 1979; Voigt 1989; Noctor et al. 2004). On the other hand, ILAs could be generated indirectly from RG cells through intermediate progenitor cells (Fig. 9a, Hypothesis 2). The expression of Pax6 and Sox2 in no-ILA cell populations (e.g., intermediate neural progenitor cells and astrocytes, respectively (Georgala et al. 2011; Manuel et al. 2015; Chen et al. 2019)) is also in agreement with the presence of an intermediate progenitor cell.
Postnatal intermediate progenitor cells may include cortical astrocyte subtypes (Fig. 9a, Hypothesis 3). The existence of an astrocytic intermediate progenitor cell is supported by a number of factors including: the increased number of ILAs during postnatal stages in the absence of ILA proliferation; increased ILA numbers after the RG cell population is thought to have been exhausted in the macaque brain; by the presence of protoplasmic and fibrous astrocytes in the cortex earlier than the first ILAs appear in layer I; by the presence in the cortex of GFAP+ astrocytes with migrating morphology (Fig. S4g,h), and by the presence of GFAP+/Ki67+ and S100β+/Ki67+ astrocytes after birth (Fig. 9a, Hypothesis 3). These hypotheses are not mutually exclusive. Indeed, Marin-Padilla recognized two distinct types of layer I astrocytes in the developing cortex: an early type, which he proposed arises in situ from transformation of pre-existing RG cells that lose contact with the ventricular surface (consistent with our Hypothesis 1, Fig. 9); and a later type, which arise from a later migration of VZ/SVZ glia-restricted precursor cells destined for layer I (consistent with our Hypothesis 2, Fig. 9) (Marín-Padilla 1995). We cannot rule out the possibility that ILAs originate from other subcortical regions and migrate tangentially into the cerebral cortex (Fig. 9a, Hypothesis 4).
Mouse and primate ILAs share the expression of only a subset of the molecular markers
In our previous study focused on ILA evolution (Falcone et al. 2019), we provided detailed morphological reconstructions of ILAs across 46 mammalian species, defining the morphological and anatomical similarities between typical ILAs and rudimentary ILAs. Understanding the phylogenetic relationship between these two ILA types is important for reconstructing their evolutionary emergence, and also raises the opportunity to use rodent models to study typical ILA function. Previous studies have suggested that layer I astrocytes in the mouse (including rudimentary ILAs) transformed into primate ILAs across evolution (Marín-Padilla 1995; Colombo et al. 1997; Falcone et al. 2019). Our data provide additional details on the similarities and differences between these two types of ILA. We found that mouse rudimentary ILA share the expression of only a subset of the molecular markers that are expressed by typical ILAs. Rudimentary ILAs in mouse express Pax6, Sox2, Nestin, Aqp4, and Glast1, but do not express Cryab, Hopx, and S100β markers as primate typical ILAs. We showed that the developmental trajectory of rudimentary and typical ILAs differs. For example, while morphological complexity of typical ILAs increases throughout life, does not for mouse rudimentary ILAs. In addition, we showed that the morphological features of rudimentary ILAs in the mature mouse brain are similar to typical ILAs in the immature macaque brain, suggesting the existence of an ancestral population for both rudimentary and typical ILA. These findings are also consistent with the concept that during evolution typical ILAs acquired new features that are shared by different groups of primates. Further developmental studies from more primate species are needed to clarify if these features can be generalized across the entire primate Order. The difference in morphology, developmental trajectory, and marker expression between rudimentary ILAs in mouse and typical ILAs in primates indicate that these key differences should be taken into account when considering cross species research on the functional properties of typical ILAs.
Technical considerations
Some technical issues should be considered to gain a broad interpretation of the data presented in this study. GFAP marker labels the main astrocytic processes without delineating the finest processes, thus excluded in our analysis. We tested Aqp4, GLAST, and CD44 markers to the purpose of expanding our morphological analysis to fine processes, but these markers provided a punctate expression (Fig. S6) that did not allow analysis. Only a fraction of macaque ILAs are labeled by S100β prenatally, although all of them express this marker postnatally. Therefore, we may not detect the totality of prenatal ILAs approaching the pia (see Fig. 8). However, S100β marker was used to better identify the presence of ILAs (i.e., time of appearance).
Future perspectives for ILA functions
ILA-specific functions are currently unknown. We previously discussed potential ILA functions being common to other astrocytes, e.g., neurotransmitter reuptake and release, water distribution, reactive oxygen species removal, blood-brain barrier regulation, extracellular ion buffering, and others, or specific functions such as development and maintenance of cortex columnar organization, inter-layer long-range communications, or a role in the glymphatic system function (Falcone et al. 2019). ILAs have long processes that run perpendicularly to the pia and transvers upper cortical layers what may confer ILAs with a role in minicolumn development and maintenance. Moreover, ILA strict contact with the pia mater and their long processes, and their Aqp4 expression, suggest a potential involvement for ILAs in glymphatic system function. In addition, the maintenance of stem-cell marker expression in adult ILAs, suggest a potential role on regeneration properties after injury. Future studies will be crucial to elucidate the functions of ILAs in health and disease.
Conclusion
In this study, we provided comprehensive data on the development of ILAs in three primate species (macaque, chimpanzee, and human) and how these cells compare with rudimentary ILAs in mouse. We showed that ILAs have a prenatal origin from radial glial cells, they proliferate only prenatally, and that their density and morphological complexity increase during postnatal development. We demonstrated that ILAs express both stem cell (Pax6, Sox2, Nestin, Cryab, and Hopx) and astrocyte (S100β, Glast, and Aqp4) markers since early development through adult. We also show that the morphology, developmental trajectory, and marker expression is only partially conserved between primate ILAs and mouse rudimentary ILAs.
Supplementary data
Supplementary data mentioned in the text are available to subscribers in CERCOR online.
Notes
This project was funded by the Shriners Hospitals and National Science Foundation CAMPOS. The authors also acknowledge the assistance of Dr Jeffrey Bennet and Dr David Amaral for some of the postnatal macaque tissue included in this study. We thank MacBrainResource (http://medicine.yale.edu/neuroscience/macbrain/) for access to archived macaque tissue specimens. MacBrainResource is funded by a NIMH grant #R01-MH113257 to Drs. Alvaro Duque and Lynn Selemon. The authors also thank Cheryl Stimpson for technical assistance with chimpanzee tissue and acknowledge support from the National Chimpanzee Brain Resource (funded by NIH grant NS092988). Support was also provided by the NHLBI Center for Fetal Monkey Gene Transfer for Heart, Lung, and Blood Diseases (R24-HL085794, A.T.) and the California National Primate Research Center base operating grant (P51-OD011107). Conflict of Interest: None declared.
Author Contributions
C.F. designed and performed the experiments and wrote the manuscript. E.P. provided support with macaque tissue cutting and staining. T.H. provided support with human tissue cutting. A.T. provided macaque tissue and assisted with the drafting of the manuscript. P.R.H. and W.D.H. provided some of the chimpanzee tissue sections. C.C.S. provided chimpanzee tissue sections and assisted in the writing of the manuscript. S.C.N. provided macaque tissue and assisted in writing the manuscript. V.F. designed the experiments and wrote the manuscript. All authors contributed intellectual contents and critical review of the paper.
Supplementary Material
Contributor Information
Carmen Falcone, Department of Pathology and Laboratory Medicine, UC Davis School of Medicine, Sacramento, CA 95817, USA; Institute for Pediatric Regenerative Medicine, and Shriners Hospitals, Sacramento, CA 95817, USA.
Elisa Penna, MIND Institute, UC Davis School of Medicine, Sacramento, CA 95817, USA; Department of Psychiatry and Behavioral Sciences, UC Davis School of Medicine, Sacramento, CA 95817, USA.
Tiffany Hong, Department of Pathology and Laboratory Medicine, UC Davis School of Medicine, Sacramento, CA 95817, USA; Institute for Pediatric Regenerative Medicine, and Shriners Hospitals, Sacramento, CA 95817, USA.
Alice F Tarantal, Departments of Pediatrics and Cell Biology and Human Anatomy, and California National Primate Research Center, University of California, Davis, CA 95616, USA.
Patrick R Hof, Nash Family Department of Neuroscience and Friedman Brain Institute, Icahn School of Medicine at Mount Sinai, New York, NY 10029, USA.
William D Hopkins, Department of Comparative Medicine, Keeling Center for Comparative Medicine and Research, The University of Texas MD Anderson Cancer Center, Bastrop, TX 78602, USA.
Chet C Sherwood, Department of Anthropology and Center for the Advanced Study of Human Paleobiology, The George Washington University, Washington, DC 20052, USA.
Stephen C Noctor, MIND Institute, UC Davis School of Medicine, Sacramento, CA 95817, USA; Department of Psychiatry and Behavioral Sciences, UC Davis School of Medicine, Sacramento, CA 95817, USA.
Verónica Martínez-Cerdeño, Department of Pathology and Laboratory Medicine, UC Davis School of Medicine, Sacramento, CA 95817, USA; Institute for Pediatric Regenerative Medicine, and Shriners Hospitals, Sacramento, CA 95817, USA; MIND Institute, UC Davis School of Medicine, Sacramento, CA 95817, USA.
REFERENCES
- Agulhon C, Fiacco TA, McCarthy KD. 2010. Hippocampal short- and long-term plasticity are not modulated by astrocyte Ca2+ signaling. Science. 327:1250–1254. [DOI] [PubMed] [Google Scholar]
- Agulhon C, Petravicz J, McMullen AB, Sweger EJ, Minton SK, Taves SR, Casper KB, Fiacco TA, McCarthy KD. 2008. What is the role of astrocyte calcium in neurophysiology? Neuron. 59:932–946. [DOI] [PMC free article] [PubMed] [Google Scholar]
- Andriezen WL. 1893. The neuroglia elements in the human brain. Br Med J. 2:227–230. [DOI] [PMC free article] [PubMed] [Google Scholar]
- Araque A, Navarrete M. 2010. Glial cells in neuronal network function. Philos Trans R Soc B Biol Sci. 365:2375–2381. [DOI] [PMC free article] [PubMed] [Google Scholar]
- Burda JE, Bernstein AM, Sofroniew MV. 2016. Astrocyte roles in traumatic brain injury. Exp Neurol. 275:305–315. [DOI] [PMC free article] [PubMed] [Google Scholar]
- Chen C, Zhong X, Smith DK, Tai W, Yang J, Zou Y, Wang L-L, Sun J, Qin S, Zhang C-L. 2019. Astrocyte-specific deletion of Sox2 promotes functional recovery after traumatic brain injury. Cereb Cortex N Y NY. 29:54–69. [DOI] [PMC free article] [PubMed] [Google Scholar]
- Clavreul S, Abdeladim L, Hernández-Garzón E, Niculescu D, Durand J, Ieng S-H, Barry R, Bonvento G, Beaurepaire E, Livet J et al. 2019. Cortical astrocytes develop in a plastic manner at both clonal and cellular levels. Nat Commun. 10:4884. [DOI] [PMC free article] [PubMed] [Google Scholar]
- Colombo JA, Fuchs E, Härtig W, Marotte LR, Puissant V. 2000. “Rodent-like” and “primate-like” types of astroglial architecture in the adult cerebral cortex of mammals: a comparative study. Anat Embryol (Berl). 201:111–120. [DOI] [PubMed] [Google Scholar]
- Colombo JA, Härtig W, Lipina S, Bons N. 1998. Astroglial interlaminar processes in the cerebral cortex of prosimians and old world monkeys. Anat Embryol (Berl). 197:369–376. [DOI] [PubMed] [Google Scholar]
- Colombo JA, Lipina S, Yáñez A, Puissant V. 1997. Postnatal development of interlaminar astroglial processes in the cerebral cortex of primates. Int J Dev Neurosci Off J Int Soc Dev Neurosci. 15:823–833. [DOI] [PubMed] [Google Scholar]
- Colombo JA, Reisin HD, Jones M, Bentham C. 2005. Development of interlaminar astroglial processes in the cerebral cortex of control and Down’s syndrome human cases. Exp Neurol. 193:207–217. [DOI] [PubMed] [Google Scholar]
- Colombo JA, Sherwood CC, Hof PR. 2004. Interlaminar astroglial processes in the cerebral cortex of great apes. Anat Embryol (Berl). 208:215–218. [DOI] [PubMed] [Google Scholar]
- Cunningham CL, Martínez-Cerdeño V, Noctor SC. 2013. Diversity of neural precursor cell types in the prenatal macaque cerebral cortex exists largely within the astroglial cell lineage. PLoS ONE. 8:e63848. [DOI] [PMC free article] [PubMed] [Google Scholar]
- Falcone C, Wolf-Ochoa M, Amina S, Hong T, Vakilzadeh G, Hopkins WD, Hof PR, Sherwood CC, Manger PR, Noctor SC et al. 2019. Cortical interlaminar astrocytes across the therian mammal radiation. J Comp Neurol. 527:1654–1674. [DOI] [PMC free article] [PubMed] [Google Scholar]
- Figueres-Oñate M, García-Marqués J, López-Mascaraque L. 2016. UbC-StarTrack, a clonal method to target the entire progeny of individual progenitors. Sci Rep. 6:33896. [DOI] [PMC free article] [PubMed] [Google Scholar]
- García-Marqués J, López-Mascaraque L. 2013. Clonal identity determines astrocyte cortical heterogeneity. Cereb Cortex N Y N. 1991, 23:1463–1472. [DOI] [PubMed] [Google Scholar]
- Ge W-P, Jia J-M. 2016. Local production of astrocytes in the cerebral cortex. Neuroscience. 323:3–9. [DOI] [PMC free article] [PubMed] [Google Scholar]
- Ge W-P, Miyawaki A, Gage FH, Jan YN, Jan LY. 2012. Local generation of glia is a major astrocyte source in postnatal cortex. Nature. 484:376–380. [DOI] [PMC free article] [PubMed] [Google Scholar]
- Georgala PA, Carr CB, Price DJ. 2011. The role of Pax6 in forebrain development. Dev Neurobiol. 71:690–709. [DOI] [PubMed] [Google Scholar]
- Hamilton NB, Attwell D. 2010. Do astrocytes really exocytose neurotransmitters? Nat Rev Neurosci. 11:227–238. [DOI] [PubMed] [Google Scholar]
- Herndon JM, Tome ME, Davis TP. 2017. Development and maintenance of the blood–brain barrier. In: Caplan LR, Biller J, Leary MC, Lo EH, Thomas AJ, Yenari M, Zhang JH, editors. Primer on Cerebrovascular Diseases. 2nd ed. San Diego: Academic Press, pp. 51–56. [Google Scholar]
- Ihrie RA, Alvarez-Buylla A. 2008. Cells in the astroglial lineage are neural stem cells. Cell Tissue Res. 331:179–191. [DOI] [PubMed] [Google Scholar]
- Kornack DR, Rakic P. 1998. Changes in cell-cycle kinetics during the development and evolution of primate neocortex. Proc Natl Acad Sci U S A. 95:1242–1246. [DOI] [PMC free article] [PubMed] [Google Scholar]
- Korzhevskii DE, Otellin VA, Grigor’ev IP. 2005. Glial fibrillary acidic protein in astrocytes in the human neocortex. Neurosci Behav Physiol. 35:789–792. [DOI] [PubMed] [Google Scholar]
- Lanjakornsiripan D, Pior B-J, Kawaguchi D, Furutachi S, Tahara T, Katsuyama Y, Suzuki Y, Fukazawa Y, Gotoh Y. 2018. Layer-specific morphological and molecular differences in neocortical astrocytes and their dependence on neuronal layers. Nat Commun. 9:1623. [DOI] [PMC free article] [PubMed] [Google Scholar]
- Manuel MN, Mi D, Mason JO, Price DJ. 2015. Regulation of cerebral cortical neurogenesis by the Pax6 transcription factor. Front Cell Neurosci. 9:70. [DOI] [PMC free article] [PubMed] [Google Scholar]
- Marín-Padilla M. 1995. Prenatal development of fibrous (white matter), protoplasmic (gray matter), and layer I astrocytes in the human cerebral cortex: a Golgi study. J Comp Neurol. 357:554–572. [DOI] [PubMed] [Google Scholar]
- Noctor SC, Martínez-Cerdeño V, Ivic L, Kriegstein AR. 2004. Cortical neurons arise in symmetric and asymmetric division zones and migrate through specific phases. Nat Neurosci. 7:136–144. [DOI] [PubMed] [Google Scholar]
- Oberheim NA, Takano T, Han X, He W, Lin JHC, Wang F, Xu Q, Wyatt JD, Pilcher W, Ojemann JG et al. 2009. Uniquely hominid features of adult human astrocytes. J Neurosci Off J Soc Neurosci. 29:3276–3287. [DOI] [PMC free article] [PubMed] [Google Scholar]
- Oberheim NA, Wang X, Goldman S, Nedergaard M. 2006. Astrocytic complexity distinguishes the human brain. Trends Neurosci. 29:547–553. [DOI] [PubMed] [Google Scholar]
- Pfrieger FW. 2010. Role of glial cells in the formation and maintenance of synapses. Brain Res Rev. 63:39–46. [DOI] [PubMed] [Google Scholar]
- Pfrieger FW, Barres BA. 1997. Synaptic efficacy enhanced by glial cells in vitro. Science. 277:1684–1687. [DOI] [PubMed] [Google Scholar]
- Pollen AA, Nowakowski TJ, Chen J, Retallack H, Sandoval-Espinosa C, Nicholas CR, Shuga J, Liu SJ, Oldham MC, Diaz A et al. 2015. Molecular identity of human outer radial glia during cortical development. Cell. 163:55–67. [DOI] [PMC free article] [PubMed] [Google Scholar]
- Rakic P. 1988. Specification of cerebral cortical areas. Science. 241:170–176. [DOI] [PubMed] [Google Scholar]
- Reichenbach A, Derouiche A, Kirchhoff F. 2010. Morphology and dynamics of perisynaptic glia. Brain Res Rev. 63:11–25. [DOI] [PubMed] [Google Scholar]
- Schmechel DE, Rakic P. 1979. A golgi study of radial glial cells in developing monkey telencephalon: morphogenesis and transformation into astrocytes. Anat Embryol (Berl). 156:115–152. [DOI] [PubMed] [Google Scholar]
- Sofroniew MV. 2015. Astrogliosis. Cold Spring Harb Perspect Biol. 7:a020420. [DOI] [PMC free article] [PubMed] [Google Scholar]
- Sofroniew MV, Vinters HV. 2010. Astrocytes: biology and pathology. Acta Neuropathol (Berl). 119:7–35. [DOI] [PMC free article] [PubMed] [Google Scholar]
- Tarantal AF, McDonald RJ, Jimenez DF, Lee CCI, O’Shea CE, Leapley AC, Won RH, Plopper CG, Lutzko C, Kohn DB. 2005. Intrapulmonary and intramyocardial gene transfer in rhesus monkeys (Macaca mulatta): safety and efficiency of HIV-1-derived lentiviral vectors for fetal gene delivery. Mol Ther J Am Soc Gene Ther. 12:87–98. [DOI] [PubMed] [Google Scholar]
- Thomsen ER, Mich JK, Yao Z, Hodge RD, Doyle AM, Jang S, Shehata SI, Nelson AM, Shapovalova NV, Levi BP et al. 2016. Fixed single-cell transcriptomic characterization of human radial glial diversity. Nat Methods. 13:87–93. [DOI] [PMC free article] [PubMed] [Google Scholar]
- Ullian EM, Harris BT, Wu A, Chan JR, Barres BA. 2004. Schwann cells and astrocytes induce synapse formation by spinal motor neurons in culture. Mol Cell Neurosci. 25:241–251. [DOI] [PubMed] [Google Scholar]
- Ullian EM, Sapperstein SK, Christopherson KS, Barres BA. 2001. Control of synapse number by glia. Science. 291:657–661. [DOI] [PubMed] [Google Scholar]
- Verkhratsky A, Nedergaard M. 2018. Physiology of Astroglia. Physiol Rev. 98:239–389. [DOI] [PMC free article] [PubMed] [Google Scholar]
- Voigt T. 1989. Development of glial cells in the cerebral wall of ferrets: direct tracing of their transformation from radial glia into astrocytes. J Comp Neurol. 289:74–88. [DOI] [PubMed] [Google Scholar]
- Zhang YV, Ormerod KG, Littleton JT. 2017. Astrocyte Ca2+ influx negatively regulates neuronal activity. eNeuro. 4:ENEURO.0340-16.2017. [DOI] [PMC free article] [PubMed] [Google Scholar]
Associated Data
This section collects any data citations, data availability statements, or supplementary materials included in this article.