

Abstract
Chronic elevations in fatty acid metabolites termed prostaglandins can be found in circulation and in pancreatic islets from mice or humans with diabetes and have been suggested as contributing to the β‐cell dysfunction of the disease. Two‐series prostaglandins bind to a family of G‐protein‐coupled receptors, each with different biochemical and pharmacological properties. Prostaglandin E receptor (EP) subfamily agonists and antagonists have been shown to influence β‐cell insulin secretion, replication, and/or survival. Here, we define EP3 as the sole prostanoid receptor family member expressed in a rat β‐cell‐derived line that regulates glucose‐stimulated insulin secretion. Several other agonists classically understood as selective for other prostanoid receptor family members also reduce glucose‐stimulated insulin secretion, but these effects are only observed at relatively high concentrations, and, using a well‐characterized EP3‐specific antagonist, are mediated solely by cross‐reactivity with rat EP3. Our findings confirm the critical role of EP3 in regulating β‐cell function, but are also of general interest, as many agonists supposedly selective for other prostanoid receptor family members are also full and efficacious agonists of EP3. Therefore, care must be taken when interpreting experimental results from cells or cell lines that also express EP3.
Keywords: animal model, beta cell (β‐cell), diabetes, G‐protein‐coupled receptor, heterotrimeric G protein, insulin resistance, insulin secretion, pancreatic islet, prostaglandin, signaling
Rat Prostaglandin EP3 Receptor is highly promiscuous and is the sole prostanoid receptor family member that regulates INS‐1 (832/3) cell glucose‐stimulated insulin secretion. Messenger RNAs for prostanoid receptors EP1, EP2, EP4, DP2, and TP are expressed in INS‐1 (832/3) cells. PGE2 reduces INS‐1 (832/3) glucose‐stimulated insulin secretion (GSIS) specifically through EP3. DP, FP, IP, and TP receptor agonists also reduce GSIS, but not through their targets, only through cross‐reactivity with EP3. Culture conditions mimicking type 2 diabetes induce INS‐1 (832/3) cell PGE2 production and defective GSIS that can be partially restored with an EP3 antagonist. EP3 splice variants with constitutive activity may reduce INS‐1 (832/3) cell viability. EP3 is a critical regulator of INS‐1 (832/3) function, and EP3 signalling promotes β‐cell dysfunction in diabetic conditions. Many supposedly selective prostanoid receptor agonists also activate EP3.
Abbrivations
- AA
arachidonic acid
- T2D
type 2 diabetic
1. INTRODUCTION
Prostaglandins are fatty acid metabolites long understood as regulating β‐cell function, particularly in the type 2 diabetic (T2D) state. 1 , 2 , 3 , 4 , 5 PGD 2, PGE 2, PGF 2α, PGI 2, and thromboxane A2 (TXA 2) are the five major prostanoids derived from the essential omega‐6 polyunsaturated fatty acid (PUFA) arachidonic acid (AA). Evidence from a number of models suggests these 2‐series prostanoids are produced by and modulate β‐cell function, but some of these findings are still controversial. 2 , 6 , 7 , 8 , 9 , 10 , 11 , 12 PGD2, PGE2, PGF2α, PGI2, and TXA2 agonize DP, EP, FP, IP, and TP receptors, respectively. 7 Confounding the study of prostanoid signaling is the fact there are two DP receptor subfamily members, DP1 and DP2 (a.k.a. CRTH2), and four EP receptor family members, EP1, EP2, EP3, and EP4, that widely vary in their G protein coupling and downstream signaling pathways, and other pharmacological parameters, ultimately eliciting diverse biological changes. 7 , 13
We and others have previously described increased PGE2 production and/or EP3 expression as negatively regulating glucose‐stimulated insulin secretion (GSIS) and contributing to the β‐cell dysfunction of diabetes. 2 , 27 Yet, other work has suggested EP3’s role may be in regulating β‐cell proliferation and not function. 14 , 15 Furthermore, other prostanoid receptors besides EP3—including other EP subfamily members—have been identified as playing roles in regulating insulin secretion. 6 , 8 , 9 , 10 , 11 , 12 , 25 Lastly, isolating the effects of GPCRs on β‐cell biology is challenging in primary pancreatic islets due to the complex interplay between the multitude of endocrine cell types.
Clonal INS‐1 rat insulinoma‐derived cell lines display physiologic glucose responsiveness 28 and respond strongly to EP3 antagonists to reduce GSIS. 2 , 29 , 30 In this study, we employed the INS‐1 (832/3) line and prostanoid receptor agonists and antagonists to definitively address these disparities in the literature. Our findings confirm the importance of EP3 in regulating β‐cell function and also serve as a cautionary note when interpreting data using prostanoid receptor agonists, even those commonly understood to be selective.
2. RESEARCH DESIGN AND METHODS
2.1. Antibodies, chemicals, and reagents
PGE2 (cat. no. P5640), L798,106 (cat. no. L4545), AH23848 (cat. no. A8227), and SC19220 (cat. no. S3065) were purchased from Sigma‐Aldrich. SC51089 (cat. no. 3758) was purchased from Tocris. PF‐04418948 (cat. no. 15016), L‐161,982 (a.k.a. EP 4 A) (cat. no. 10011565), cicaprost (cat. no. 16831), U‐46619 (cat. no. 16450), PGF2α (cat. no. 16010), iloprost (cat. no. 18215), sulprostone (cat. no. 14765), PGD2 (cat. no. 12010), indomethacin (cat. no. 70270), and the prostaglandin E2 monoclonal ELISA kit (cat. no. 514010) were purchased from Cayman Chemical. Interleukin‐1β (IL‐1β) (cat. no. 130‐094‐053) was purchased from Miltenyi Biotech. Monoclonal insulin/proinsulin (cat. no. 10R‐I136a) and the biotin conjugated anti‐insulin antibody (cat. no. 61R‐I136bBT) were purchased from Fitzgerald. The RNeasy Mini Kit (cat. no. 74106) and RNase‐free DNase set (cat. no. 79254) were purchased from Qiagen. The High‐Capacity cDNA Reverse Transcription Kit (cat. no. 4368813) was purchased from Applied Biosystems, and FastStart Universal SYBR Green Master mix (cat. no. 04913914001) purchased from Roche. The cell culture medium was RPMI 1640 medium (cat. no. 22400‐105) from Gibco. Arachidonic Acid (AA) (cat. no. 10931) was purchased from Sigma. Low‐passage INS‐1 (832/3) cells were a generous gift of Dr. Christopher Newgard (Duke University, Durham, NC).
2.2. INS‐1 cell culture and GSIS assays
INS‐1 (832/3) cells (passage 35 or below) were cultured as previously described. 29 , 31 Prior to GSIS assays with the indicated compounds, cells were plated in 96‐well tissue culture‐treated plates and cultured for 72 h. 31 Intracellular and secreted insulin concentrations were determined by an in‐house insulin ELISA. 2 , 17
2.3. Gene expression analysis
Cultured cells were lysed in Buffer RLT and RNA purified using the RNeasy kit according to the manufacturer's instructions. Copy DNA was synthesized from purified RNA using the High‐Capacity cDNA Reverse Transcription Kit according to the manufacturer's protocols. Relative gene expression was quantified by PCR with the primers indicated in Table 1 using SYBR green, as previously described. 2
TABLE 1.
List of primers used in quantitative real time PCR.
| Protein | Gene symbol | Primer sequences | Species selectivity |
|---|---|---|---|
| β‐actin | Actb | F: TCAAGATCATTGCTCCTCCTGAGC | Mouse/rat/ |
| R: TTGCTGATCCACATCTGCTGGAAG | Human | ||
| Prostaglandin EP3 receptor | Ptger3 | F: AATTCCTTCCTAATCGCCGTTC | Rat |
| (EP3) | R: TTCAGGTTGTTCATCATCTGGC | ||
| Cyclooxygenase 1 | Ptgs1 | F: TTAGGCCATGGGGTAGACCTT | Rat |
| (COX−1) (Ptgs1) | R: CTGTTCTACGGAAGGTGGGTA | ||
| Cyclooxygenase 2 | Ptgs2 | F: ACGGTGAAACTCTAGACAGACA | Rat |
| (COX−2) (Ptgs2) | R: TCTCCACCGATGACCTGATATT | ||
| Prostaglandin E synthase | Ptges | F: GGTTTGGTGATGGAGAACAGCCA | Rat |
| Ptges (mPtges) | R: AGTACTGGAGACCTCCACGTTTCA | ||
| Prostaglandin E synthase 2 | Ptges2 | F: CCTATCAGGTGGTAGAGGTGAA | Rat |
| Ptges2 (mPtges2) | R: ATTGAGCTGTTGCAAGCTGT | ||
| Prostaglandin E synthase 3 | Ptges3 | F: GGAAAGGGCAAAGCTTAATTGG | Rat |
| Ptges3 (cPtges) | R: CCCATGTGATCCATCATCTCAG | ||
| Prostaglandin EP1 receptor | Ptger1 | F: CACAATGCTGCAACCTTAGTTC | Rat |
| (EP1) | R: CAAGGTGTTGAGATTCTTGGGA | ||
| Prostaglandin EP2 receptor | Ptger2 | F: TCCCTGCCTTTCACAATCTTTG | Rat |
| (EP2) | R: ACTGGTGGTCTAAGGATGACAA | ||
| Prostaglandin EP4 receptor | Ptger4 | F: GATGGTCATCTTACTCATCGCC | Rat |
| (EP4) | R: TTGATGAACACTCGCACCACG | ||
| Prostaglandin DP1 receptor | Ptgdr1 | F: CCCTGCCTTTAATTTATCGTGC | Rat |
| (DP1) | R: GGAAATCACAGACAGAAAACGC | ||
| Prostaglandin DP2 receptor | Ptgdr2 | F: ACGGACTCATCCTGTTTGTG | Rat |
| (DP2) (CRTH2) | R: GTAGGTGAAGAAAGGCAGAGAG | ||
| Prostaglandin FP receptor | Ptgfr | F: TGGCAAAGTCAACTATGTCTGC | Rat |
| (FP) | R: ACATCGTTGTGGAGATAAACGC | ||
| Prostaglandin IP receptor | Ptgir | F: CGAGAGGATGAAGTTTACCACC | Rat |
| (IP) | R: GCGTGAATCCTCTGATCGTG | ||
| Thromboxane receptor | Tbxa2r | F: TTCCTGAGCCTTGACATTCC | Rat |
| (TP) | R: CGTGATAAGGGGGTCAACAC | ||
| EP3α | Ptger3 | F: CAACTTGAAGCGGAGTTTCATTGC | Rat |
| (C‐terminus: DQLER) | (CRA_b) | R: GCTTGTCTCGGTGTGTTTAATGGC | |
| EP3β | Ptger3 | F: CAACCTGAAGCGGAGTTTCATTGC | Rat |
| (C‐terminus: SPREG) | (CRA_c) | R: GCTTGTCTCGGTGTGTTTAATGGC | |
| EP3γ | Ptger3 | F: CCTTCTTCGAAAGTTCTGCCAGGT | Rat |
| (C‐terminus: VHPGP) | (CRA_a) | R: TCATTAGACAAGGAGATGGCCTGC | |
| EP3δ | Ptger3 | F: CATTGCAATACCTGCTTCCCTGAG | Rat |
| (C‐terminus: LCFNR) | (CRA_d) | R: GTCTCGGTGTGTTTAATGGCAAGG |
Targets are listed by their protein name and gene symbol. Besides Ptger3 encode a single splice variant. The nomenclature for rat EP3 splice variants is as described in the IUPHAR/BPS Guide to Pharmacology v. 2020.5, 37 with the nomenclature for transcript variants indicated under the gene symbol.
2.4. INS‐1 (832/3) cell fatty incorporation and analysis of PGE2 production
70% confluent INS‐1 (832/3) cells were cultured in a medium containing 1% fatty acid‐free BSA with or without the addition of 100 μM AA for an additional 48 h according to a protocol previously described for isolated mouse islets. 2 , 17 AA and EPA phospholipid composition was determined by gas chromatography following a Folch lipid extraction and lipid class separation by thin‐layer chromatography as described previously. 17 , 32 , 33 To induce PGE2 production, cells were cultured an additional 24 h in vehicle or 10 ng/ml IL‐1β. A PGE2 ELISA was performed according to manufacturer's protocol, as previously described. 17
2.5. Statistical analysis
Statistical significance was determined using GraphPad Prism v. 9 (GraphPad Software Inc., San Diego, CA). Data are displayed as means ±SEM. A t test or one‐ or two‐way ANOVA was used to identify the p value as specified in each figure legend. Statistical significance was determined as p < 0.05.
2.6. Data availability
All data contained within this manuscript are available upon reasonable request of the corresponding author.
2.7. Ethics statement
Ethical approval is not applicable to the manuscript.
3. RESULTS
3.1. Characterization of prostanoid receptor mRNA expression in INS‐1 (832/3) cells
Quantification of the abundance of EP receptors at the protein level suffers from a lack of specific, reliable antibodies, and the abundance of INS‐1 (832/3) EP receptors as quantified by PGE1 radioligand binding was below the detection limit of the assay (S. D. and R. M. B.: data not shown). Therefore, in this and previous works, 2 , 17 , 30 , 34 mRNA expression is used as a surrogate for protein expression. Quantitative PCR (qPCR) primers spanning exon‐exon junctions were optimized using a rat kidney cDNA library and used to perform a comprehensive analysis of INS‐1 (832/3) prostanoid family receptor expression (See Table 1 for targets and primer sequences). Ptger1 (EP1), Ptger3 (EP3), Ptger4 (EP4), and Tbxa2r (TP) display linear cDNA dose‐dependent amplification of PCR product, with an amplification factor near the ideal of 2.0 (100% efficiency) (Table 2). Ptger2 (EP2), Ptgdr1 (DP1), Ptgfr (FP), and Ptgir (IP) do not appear expressed at any significant level. Two sets of exon‐spanning Ptgdr2 (DP2) primers amplified PCR product from rat kidney and INS‐1 (832/3) cells, but agarose gel electrophoresis of terminal PCR products showed this amplification was primarily nonspecific (data not shown). Using primers selecting a 119 bp region of Exon 1, Ptgdr2 product is amplified only in INS1 (832/3) cDNA samples but not “no reverse transcription” controls (Figure S1). By qPCR, Ptgdr2 mRNA is also amplified in a linear fashion, with cycle times similar to Ptger3 at similar cDNA template concentrations (Table 2, right).
TABLE 2.
Profile of 2‐series prostanoid receptor mRNA expression in INS‐1 832/3 cells.
| cDNA (DF) | Gene | cDNA (DF) | Gene | |||||||
|---|---|---|---|---|---|---|---|---|---|---|
| Ptger1 | Ptger2 | Ptger3 | Ptger4 | Ptgdr1 | Ptgfr | Ptgir | Tbxa2r | Ptgdr2 | ||
| 1 (100 ng) | 18.24 | – | 26.50 | 30.19 | – | – | – | 31.01 | ||
| 10 | 22.46 | – | 29.58 | 34.22 | – | – | 34.84 | 1 (11.3 ng) | 28.55 | |
| 100 | 26.02 | – | 33.03 | 37.57 | – | ‐ | 36.55 | 2 | 29.35 | |
| 1000 | 28.94 | – | 36.51 | ‐ | – | – | ‐ | 4 | 30.27 | |
| 10000 | 31.74 | – | ‐ | ‐ | – | – | – | ‐ | 8 | 31.46 |
| Amp. Fact. | 1.99 | – | 1.94 | 1.87 | – | – | – | 2.29 | 2.12 | |
Data shown are cycle time (CT) for primers specific for the indicated genes, using 10‐fold (left) or 2‐fold (right) serial cDNA template dilutions. An amplification factor of 2.0 correlates with 100% efficiency, with amplification factors above 2.0 indicating some degree of nonspecificity. DF, dilution factor.
3.2. PGE2 may signal exclusively through EP3 to reduce INS‐1 (832/3) GSIS.
PGE2 reduces INS‐1 (832/3) GSIS in a dose‐dependent manner, and the EP3‐specific antagonist, L798,106, shifts the PGE2 dose–response curve to the right, increasing the IC50 for PGE2 over 100‐fold (Figure 1A and B). The EP2‐specific antagonist, PF‐04418948, has no effect on the PGE2 dose–response, consistent with a lack of receptor expression (Figure 1C). EP1 mRNA is abundant in INS‐1 (832/3) cells (Table 1), yet neither of two EP1 antagonists, SC19220 or SC51089, affect the PGE2 dose–response (Figure 1D and E). To further exclude EP1 signaling, we employed iloprost, which is traditionally known as an EP1 (and IP) receptor agonist, but is only a partial agonist of the rat EP1 receptor and a full agonist of the rat EP3 receptor. 35 Like PGE2, iloprost dose‐dependently reduces GSIS, and the EP1‐specific antagonist, SC50189, has no effect on its dose–response curve (Figure 1F). EP4 is also expressed in INS‐1 (832/3) cells (Table 1), but was similarly excluded from mediating the effect of PGE2 on GSIS via the EP4‐specific antagonists AH2384B and L161,982 (Figure 1G and H). Finally, repeating these experiments with the EP3‐selective agonist, sulprostone, yielded nearly identical results as with PGE2, with neither SC51089, AH2384B, SC19220, nor L161,982 affecting the sulprostone dose–response (Figure 1I).
FIGURE 1.
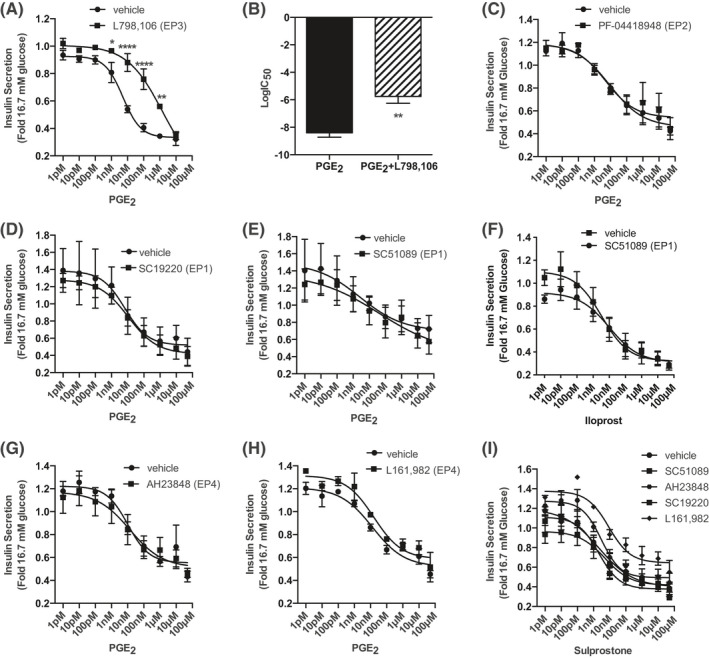
PGE2 reduces GSIS of INS‐1 832/3 cells specifically through EP3. (A) PGE2 dose–response curves from 1 pM to 10 μM with and without 20 μM L798,106. (B) LogIC50 for PGE2 with and without L798,106 for the curves depicted in (A). (C–E) PGE2 dose–response curves from 1 pM to 50 μM with or without 10 µM of the following EP receptor antagonists: (C) PF‐04418948 (EP2), (D) SC19220 (EP1), and (E) SC51089 (EP1). (F) Iloprost dose–response curve from 1 pM to 100 μM in the presence or absence of 10 μM SC51089. (G–H) PGE2 dose–response curves from 1 pM to 50 μM with or without 10 µM of the following EP4 receptor antagonists: (G) AH23848 and (H) L161,982. (I) Sulprostone dose–response curves from 1 pM to 50 μM in the absence or presence of 10 μM SC51089, AH23848, SC19220, or L161,982. In all panels, data are from N = 3–5 independent experiments and represent mean ± SEM. The data in (A) and (C–I) were analyzed by two‐way paired ANOVA followed by Holm–Sidak test post hoc to correct for multiple comparisons. The data in (B) were analyzed by unpaired t‐test. *p < 0.01; **, p < 0.01, and ****p < 0.0001.
3.3. Supraphysiological concentrations of agonists for the other 2‐series prostaglandin receptors reduce INS‐1 (832/3) GSIS through EP3
There exists significant cross‐reactivity among agonists for the prostanoid receptors (see Table 3, which was created using the IUPHAR/BPS Guide to Pharmacology 36 , 37 and its associated primary literature 35 , 38 , 39 , 40 , 41 , 42 , 43 , 44 ). DP1, FP, and IP mRNA were not detected in INS‐1 (832/3) cells at all, but DP (PGD2), FP (PGF2α), and IP (cicaprost) agonists all reduce INS‐1 (832/3) GSIS starting at a concentration of 1 µM: nearly reaching the maximal potency of PGE2 (~60% reduction in GSIS) at 50–100 µM (Figure 2A–C, filled squares). TP is weakly expressed in INS‐1 (832/3) cells, and 100 µM of the TP agonist, U‐46619, inhibits GSIS (Figure 2D, filled squares). In all four of these cases, though, L798,106 fully restores INS‐1 (832/3) GSIS (Figure 2A–D, filled circles). Although the addition of L798,106 to increasing concentrations of PGF2α sometimes yields an unusual bell‐shaped dose–response curve (see Figure 2B), this effect is not reproducible or statistically significant.
TABLE 3.
Published pKi of selective agonists of the prostanoid receptor family members reveals EP3 as the most promiscuous.
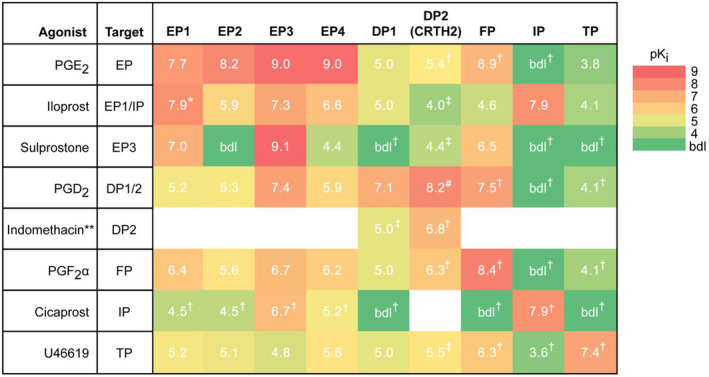
Traditionally understood targets for the agonists used in this paper are shown on the left, and pKi values (white) for prostanoid receptor family members were obtained from the IUPHAR/BPS Guide to Pharmacology v. 2020.5 and its associated primary literature. 35 , 36 , 37 , 38 , 39 , 40 , 41 , 42 , 43 , 44 Subnanomolar efficacy is shown in red, with a gradient to green indicating efficacy below the detection limit (bdl). All agonists beside iloprost at the rat EP1 receptor are full agonists, and all values shown are for the rat receptor variant, if available. White boxes indicate no data on the interaction could be found. *, partial agonist for rat EP1 and full agonist for mouse and human EP1. **, primarily characterized as a nonselective COX inhibitor. #, pIC50 and not pKi. †, pKi is average of those of the mouse and human receptor variants. ‡, pKi is for the human receptor variant.
FIGURE 2.
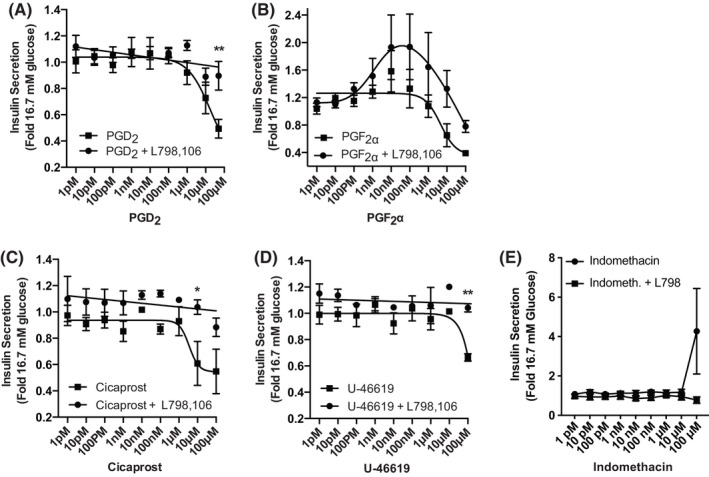
Any effects of DP, FP, IP, and TP receptor agonists on INS‐1 (832/3) GSIS are mediated by EP3. (A–E): (A) PGD2, (B) PGF2α, (C) Cicaprost, (D) U‐46619, or (E) indomethacin were added in increasing concentrations to INS‐1 (832/3) cells (from 1 pM to 50 or 100 μM) in the presence or absence of 20 μM L798,106. Insulin secretion data are expressed relative to that in 16.7 mM glucose. In all panels, data are from N = 3–5 independent experiments and represent mean ± SEM. Data were analyzed by two‐way ANOVA followed by Holm–Sidak test post hoc to correct for multiple comparisons. *p < 0.05; **p < 0.01.
PGE2 is a full agonist of the mouse DP2 receptor, albeit with ~3000‐fold reduced potency as compared to EP3 (Table 3). Therefore, to further exclude DP2 negatively regulating INS‐1 (832/3) GSIS, we used indomethacin, a nonselective COX inhibitor that also has a high affinity for DP2 (Table 3 and 43 , 45 , 46 , 47 ). Indomethacin has no significant effect on INS‐1 (832/3) GSIS at any concentration, and, although it is not statistically significant, the increased mean GSIS with 100 μM indomethacin is absent in L798,106‐treated cells (Figure 2E).
3.4. Testing the role of endogenous EP3 signaling in a model of diabetic β‐cell dysfunction
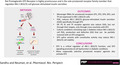
In this and previous works, L798,106 alone has no potentiating effect on INS‐1 (832/3) GSIS, similar to findings from primary mouse and human islets from nondiabetic donors. 2 , 17 Figure 3A shows a diagram of the enzymes involved in the conversion of AA to PGE2, with the reactions catalyzed by COX enzymes rate‐limiting. Based on previous work by our laboratory and others, 11 , 17 , 48 we hypothesized INS‐1 (832/3) PGE2 production could be induced by culturing cells AA‐enriched medium, followed by treatment with 10 ng/ml IL‐1β to mimic the diabetic state, allowing us to quantify the impact of endogenous EP3 signaling to β‐cell dysfunction.
FIGURE 3.
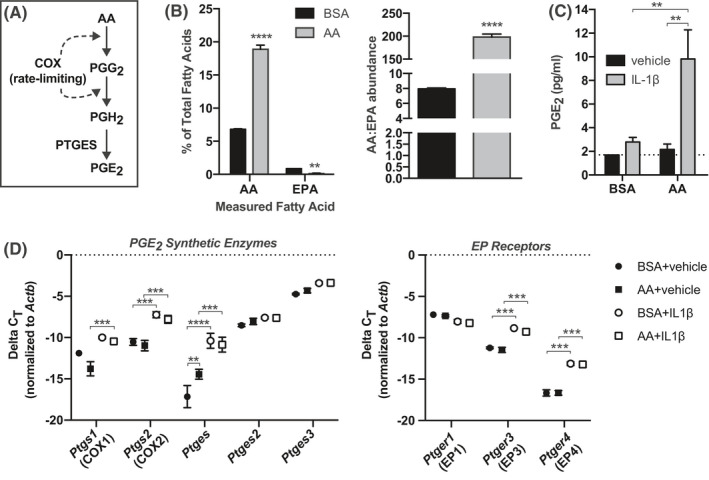
Fatty acid incubation and IL‐1β treatment to modulate PGE2 substrate availability and synthetic enzyme expression. (A) Diagram of the steps in the AA‐to‐PGE2 synthetic pathway and the enzymes that catalyze them. (B) AA and EPA content of INS‐1 (832/3) membrane phospholipid fractions of cells cultured in AA‐enriched medium or BSA control. Data are displayed as a percentage of total fatty acids measured (left) or by the ratio of AA to EPA (right). (C) Prostaglandin E2 (PGE2) concentrations in medium from BSA or AA cultured cells treated with 10 ng/mL IL‐1β or vehicle control. (D) ΔCt for genes encoding PGE2 synthetic enzymes (left) or EP receptors (right) versus β‐actin (Actb) as determined by qPCR. In all panels, data are from N = 3–4 independent experiments and represent mean ± SEM. In (B) (right), data were compared by unpaired t‐test. In (B) (left), (C), and (D), data were compared by two‐way ANOVA with Holm–Sidak test post hoc to correct for multiple comparisons. **p < 0.01, ***p < 0.001, and ****p < 0.0001.
Eicosapentaneoic acid (EPA) is the omega‐3 PUFA of corresponding chain‐length to AA and competes with AA for the same site in plasma membrane phospholipids and downstream synthetic enzymes. INS‐1 (832/3) cells cultured in AA‐enriched medium have 4‐fold higher AA abundance and a 25‐fold higher AA:EPA ratio as compared to controls (Figure 3B). Yet, substrate‐dependent PGE2 production is only induced with IL‐1β treatment (Figure 3C). This is consistent with the effect of IL‐1β on upregulating nearly all of the PGE2 synthetic pathway genes (Figure 3D). AA enrichment alone moderately upregulates Ptges expression (~3.5‐fold vs. control, as calculated via the 2ΔΔCt method), but IL‐1β induces its expression by ~100‐fold (Figure 3D, left). IL‐1β also induces the expression of Ptgs1 (~2–4‐fold), Ptgs2 (~10‐fold), Ptges2 (~2‐fold), and Ptges3 (~2.5‐fold). Of the EP receptor isoforms expressed in INS‐1 (832/3) cells, Ptger3 expression is significantly upregulated by IL‐1β treatment (~6‐fold) (Figure 3D, right). This finding is consistent with previous findings using islets from T2D mouse models. 2 , 17 Ptger4 expression is also strongly upregulated by IL‐1β treatment (~10‐fold), whereas Ptger1 is unaffected.
In the absence of IL‐1β treatment, both control and AA‐enriched cells have a strong GSIS response that is unaffected by 20 µM L798,106 (Figure 4A, left). IL‐1β treatment alone essentially ablates INS‐1 (832/3) responsiveness to stimulatory glucose, with little‐to‐no additional effect of 16.7 mM glucose versus 1.7 mM glucose (Figure 4A, right). IL‐1β also reduces INS‐1 (832/3) insulin content by almost 50%, regardless of fatty acid treatment (Figure 4B). Combined with a visual observation of reduced confluence on the day of assay (H. K. S., personal observations), these results suggest IL‐1β treatment negatively influences INS‐1 (832/3) cell viability.
FIGURE 4.
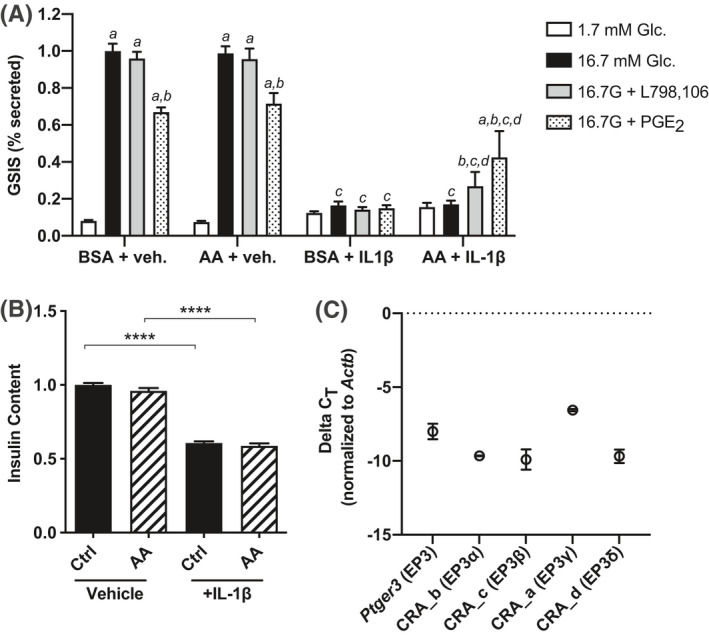
Interleukin‐1β (IL‐1β) induces Ptger3 expression and an EP3 antagonist partially ameliorates β‐cell dysfunction after induction of PGE2 production. (A) Glucose‐stimulated insulin secretion (GSIS) as a percent content of INS‐1 (832/3) cells cultured in AA‐enriched medium or BSA control, with or without 10 ng/mL IL‐1β. Assay treatment groups were 1.7 mM glucose, 16.7 mM glucose, 16.7 mM glucose +10 nM PGE2, and 16.7 mM glucose +20 µM L798,106. (B) Total insulin content from the data shown in (A). (C) ΔCt of primers amplifying all EP3 splice variants (EP3 common) or those specific for EP3α, EP3β, EP3γ, or EP3δ versus β‐actin (Actb) as determined by relative qPCR. In all panels, data are from N = 3–4 independent experiments and represent mean ±SEM. In (A) and (B), data were compared by two‐way ANOVA with Holm–Sidak test post hoc to correct for multiple comparisons. In (A), data were compared within and across culture conditions and assay treatment groups. For simplicity, only p < 0.05 is differentiated. a, p < 0.05 for the indicated treatment versus 1.7 mM glucose within a culture condition; b, p < 0.05 for the indicated treatment versus 16.7 mM glucose within a culture condition; c, p < 0.05 for the indicated treatment with and without IL‐1β; and d, p < 0.05 for the effect of AA enrichment on the indicated treatment (within IL‐1β culture condition). **p < 0.01, ***p < 0.001, and ****p < 0.0001. No statistical analysis was performed in (C).
The only condition in which L798,106 enhances INS‐1 (832/3) GSIS is with AA enrichment and IL‐1β pretreatment (~30% increase vs. 16.7 mM glucose alone) (Figure 4A, grey bars), consistent with enhanced PGE2 production. 10 nM PGE2 blunts INS‐1 (832/3) GSIS regardless of AA enrichment, and PGE2 has no further inhibitory effect on GSIS from IL‐1β‐treated control cells (Figure 4A, stippled bars). Unexpectedly, though, PGE2 potentiates INS‐1 (832/3) GSIS approximately twofold when AA‐enriched cells have been pretreated with IL‐1β (Figure 4A, right).
The Ptger3 gene encodes for multiple splice variants differing only in the sequence of their C‐terminal tail. 2 Quantitative PCR with splice‐variant specific primers confirms EP3α, EP3β, EP3γ, and EP3δ are all expressed in INS‐1 (832/3) cells, with EP3γ seemingly predominant (Figure 4C). With the relative qPCR assay used in this work, the statistical significance of this difference cannot be quantified. Yet, with nearly identical amplification efficiencies (~1.78), a ΔΔCT of >3 suggests EP3γ could be 10‐fold enriched versus the other splice variants. Notably, EP3γ has nearly full constitutive activity. 17 , 49 , 50 Combined with gene expression analyses, a stimulatory effect of PGE2 on INS‐1 (832/3) GSIS, potentially mediated by Gs‐coupled EP4, may be unmasked in conditions where EP4 expression is upregulated and EP3 signal transduction mechanisms are fully saturated.
4. DISCUSSION
Prostanoid production, particularly that of PGE2, is perturbed in the diabetic state and has long been suggested to actively contribute to β‐cell dysfunction. 2 , 51 , 52 , 53 , 54 Our own work has shown PGE2 production is enhanced 4–5‐fold in islets isolated from T2D mice and confirmed T2D human organ donors as compared to islets from lean and/or nondiabetic controls. 2 , 17 PGE2 is the most abundant natural ligand for the EP receptor subfamily, with Ki values ranging from subnanomolar to 20 nM for the rat receptor variants (EP3 = EP4 > EP1 = EP2) (Table 3). As INS‐1 (832/3) cells have no response to the competitive EP3 antagonist, L798,106, to potentiate GSIS, their endogenous production of PGE2 must be inconsequential, as PGE 1, PGE2, PGE3, sulprostone, and iloprost all significantly reduce INS‐1 cell GSIS, confirming functional EP3 expression ( 2 , 29 and Figures 1 and 3).
IL‐1β induces EP3 expression and PGE2 production from HIT‐T15 hamster insulinoma cells, βHC‐13 mouse insulinoma cells, and isolated rat and mouse islets, 11 , 17 , 48 correlating with decreased GSIS ameliorated by COX‐2 inhibitors. 11 , 48 In this work, we chose IL‐1β treatment of AA‐enriched cells as a test of our hypothesis that elevated PGE2/EP3 signaling is necessary and sufficient to elicit the β‐cell dysfunction of T2D, and, as such, can be reversed by an EP3 antagonist. Our findings of enhanced COX‐2 expression (as well as other enzymes in the PGE2 production pathway) are confirmatory of those of earlier works ( 11 , 17 , 48 and Figure 3). Yet, the GSIS response of IL‐1β‐treated INS‐1 (832/3) cells is completely ablated: an effect L798,106 only weakly ameliorates (Figure 4). Previous work in rat islets showed the GSIS defect after IL‐1β treatment is independent of prostaglandins. 55 Based on INS‐1 (832/3) EP3 splice variant gene expression, though, an alternative explanation is selective upregulation of a constitutively active EP3 splice variant limits the ability of EP3 agonists or COX inhibitors to restore GSIS.
This profound loss of insulin content of IL‐1β‐treated INS‐1 (832/3) cells associated with a visually apparent reduction in monolayer confluency on the day of assay suggests IL‐1β as a potent negative regulator of INS‐1 (832/3) cell replication and/or survival. EP3 deletion or an EP3 antagonist both promote mouse islet beta‐cell proliferation, 14 , 15 and, in mouse islets, EP3γ is specifically coupled to the pertussis toxin‐insensitive Gi/o subfamily member, Gz. 50 The impact of IL‐1β on rat islet thymidine incorporation is also pertussis toxin‐insensitive. 55 Considering the nearly full constitutive activity of EP3γ 17 , 49 , 50 and its likely enrichment compared to other splice variants, it is possible the IL‐1β‐mediated effect on INS‐1 (832/3) cell viability is not due to a general toxicity, but is specifically mediated by Gz‐coupled EP3γ. As EP4 agonists promote β‐cell survival, 14 it is also possible EP4 expression is upregulated as a compensatory mechanism that ultimately fails. As yet, all these models remain speculative but provide a strong premise for further exploration.
Although PGE2 is the predominant and most bioactive 2‐series prostanoid formed in pancreatic islets, the remaining 2‐series prostanoids, PGD2, PGF2α, PGI2, and TXA2, are also synthesized in the pancreas and may influence β‐cell function. 6 , 8 , 9 , 10 , 11 , 12 , 25 Yet, while DP, FP, IP, and TP receptors are expressed in human islets, they have weak‐to‐no expression in mouse islet or pancreas tissue. 56 , 57 , 58 This expression pattern holds true in rat INS‐1 (832/3) cells, where DP1, FP, and IP mRNA are not detected at all, and TP receptor mRNA is only detected in more concentrated cDNA samples (Table 2). More importantly, lack of receptor mRNA expression correlates with lack of function, as only supraphysiological concentrations of DP, FP, IP, and TP agonists affect GSIS: effects experimentally confirmed as mediated solely by cross‐reactivity with EP3 (Figure 2). Notably, the PGD2/DP axis has recently re‐emerged as a key regulator of islet cell function. 9 , 59 , 60 In fact, human pancreatic DP2 is so highly enriched in the β‐cell, DP2 agonists have been proposed as novel PET tracers for determining β‐cell mass in vivo. 61 , 62 , 63 Interestingly, we do find DP2 mRNA is expressed in INS‐1 (832/3) cells, but this expression does not correlate with function, as indomethacin has no effect on GSIS. As DP2 mRNA expression was only detected with primers not spanning an exon–exon junction, DP2 mRNA expression may not correlate with protein expression. Using mass spectrometry to detect full‐length DP2 protein in INS‐1 (832/3) plasma membrane preparations would confirm proper protein folding and membrane integration. If DP2 is indeed expressed and functional in INS‐1 (832/3) cells, its signaling may regulate other aspects of β‐cell biology besides insulin secretion (e.g., proliferation or survival).
In sum, we characterized the impact of signaling through the entire prostanoid receptor family, whose native agonists are metabolites of AA, in the functional response of the glucose‐responsive INS‐1 (832/3) cell line. With the dramatic effect of IL‐1β on INS‐1 (832/3) insulin content and secretion, we were unable to use this model to confirm EP3 as the sole mediator of PGE2‐mediated β‐cell dysfunction in the T2D state, although it is certainly a contributor. These same conditions may have uncovered a stimulatory effect of PGE2 on GSIS mediated by EP4, although this hypothesis remains unconfirmed. Fortuitously, the predominance of EP3 in mediating the inhibitory effect of PGE2 on INS‐1 (832/3) GSIS allowed us to use this cell line as a model to test the cross‐reactivity of prostanoid receptor agonists for EP3, determining many of these agonists nonspecifically activate EP3 with functional consequence. In fact, EP3 is the most promiscuous out of the entire prostanoid receptor family, with Ki values no weaker than 200 nM for 6 of the 7 prostanoid receptor agonists used in this work, even those thought to be relatively specific (e.g., cicaprost and PGF2α) (Table 3). Even more worrisome, EP3 protein is notoriously difficult to detect, with no available binding assay or antibody that detects endogenous protein. These findings have significant implications for the study of prostanoid receptor family members in any cell line or tissue, particularly those in which EP3 expression is known or suspected.
DISCLOSURES
H. K. S., M. D. S., S. E. D., K. M. C., R. C., E. G., R. J. F., C. P., R. M. B., and M. E. K. declare that they have no conflicts of interest with the contents of this article. J. C. N is currently a Novo Nordisk Inc. employee (800 Scudders Mill Road, Plainsboro, NJ 08536). This work was completed in full during his predoctoral training with Dr. Kimple and is not related to his current position. The content is solely the responsibility of the authors and does not necessarily represent the official views of the National Institutes of Health, the U. S. Department of Veterans Affairs, or the United States Government.
Supporting information
Fig S1
ACKNOWLEDGMENTS
We thank the many present and former members of the Kimple Laboratory who contributed technical assistance or scientific discussion during the course of these experiments. H. K. S., J. C. N, M. D. S., S. E. D., K. M. C., R. C., E. G., R. J. F., C. P., and M. E. K. generated and analyzed the raw data. M. E. K. completed the final data analysis. R. M. B. and M. E. K. supervised the project. H. K. S. and J. C. N. drafted the manuscript. M. E. K. and R. M. B. edited the manuscript and M. E. K. wrote the final version. All authors reviewed and approved the final version of the manuscript. This work was supported in part by Merit Review Award I01 BX003700 from the United States (U. S.) Department of Veterans Affairs Biomedical Laboratory Research and Development Service (BLR&D) (to M. E. K) and I01 BX000616 (to R. J. B). Further support was provided by ADA Grant 1‐16‐IBS‐212 (to M. E. K.), JDRF Grant 17‐2011‐608 (to M. E. K.), and NIH Grants K01 DK080845 (to M. E. K.), R01 DK102598 (to M. E. K), F31 DK109698 (to R. J. F.), R56 HL127218 (to R. M. B.), and R01 HL134895 (to R. M. B). Joshua Neuman was supported in part by a T32 fellowship from the UW Biology of Aging and Age‐related Diseases Training Grant (T32 AG000213). The funding bodies had no role in any aspect of the work described in this manuscript. M. E. K. is the guarantor of this work and, as such, had full access to all the data in the study and takes responsibility for the integrity of the data and the accuracy of the data analysis.
Harpreet K. Sandhu and Joshua C. Neuman, these authors contributed equally to this work.
REFERENCES
- 1. Johnson DG, Fujimoto WY, Williams RH. Enhanced release of insulin by prostaglandins in isolated pancreatic islets. Diabetes. 1973;22(9):658‐663. [DOI] [PubMed] [Google Scholar]
- 2. Kimple ME, Keller MP, Rabaglia MR, et al. Prostaglandin E2 receptor, EP3, is induced in diabetic islets and negatively regulates glucose‐ and hormone‐stimulated insulin secretion. Diabetes. 2013;62(6):1904‐1912. [DOI] [PMC free article] [PubMed] [Google Scholar]
- 3. Metz S, VanRollins M, Strife R, Fujimoto W, Robertson RP. Lipoxygenase pathway in islet endocrine cells. Oxidative metabolism of arachidonic acid promotes insulin release. J Clin Invest. 1983;71(5):1191‐1205. [DOI] [PMC free article] [PubMed] [Google Scholar]
- 4. Oshima H, Taketo MM, Oshima M. Destruction of pancreatic β‐cells by transgenic induction of prostaglandin E2 in the islets. J Biol Chem. 2006;281(39):29330‐29336. [DOI] [PubMed] [Google Scholar]
- 5. Robertson RP. Arachidonic acid metabolite regulation of insulin secretion. Diabetes Metab Rev. 1986;2(3–4):261‐296. [DOI] [PubMed] [Google Scholar]
- 6. Akpan JO, Hurley MC, Pek S, Lands WE. The effects of prostaglandins on secretion of glucagon and insulin by the perfused rat pancreas. Can J Biochem. 1979;57(6):540‐547. [DOI] [PubMed] [Google Scholar]
- 7. Breyer RM, Bagdassarian CK, Myers SA, Breyer MD. Prostanoid receptors: subtypes and signaling. Annu Rev Pharmacol Toxicol. 2001;41:661‐690. [DOI] [PubMed] [Google Scholar]
- 8. Heaney TP, Larkins RG. The effect of prostacyclin and 6‐keto‐prostaglandin F1 alpha on insulin secretion and cyclic adenosine 3’, 5'‐monophosphate content in isolated rat islets. Diabetes. 1981;30(10):824‐828. [DOI] [PubMed] [Google Scholar]
- 9. Horie H, Narumiya S, Matsuyama T, Nonaka K, Tarui S. Presence of prostaglandin D2, E2 and F2 alpha in rat pancreatic islets. Prostaglandins Leukot Med. 1984;16(1):39‐44. [DOI] [PubMed] [Google Scholar]
- 10. Sieradzki J, Wolan H, Szczeklik A. Effects of prostacyclin and its stable analog, iloprost, upon insulin secretion in isolated pancreatic islets. Prostaglandins. 1984;28(3):289‐296. [DOI] [PubMed] [Google Scholar]
- 11. Tran PO, Gleason CE, Robertson RP. Inhibition of interleukin‐1beta‐induced COX‐2 and EP3 gene expression by sodium salicylate enhances pancreatic islet β‐cell function. Diabetes. 2002;51(6):1772‐1778. [DOI] [PubMed] [Google Scholar]
- 12. Turk J, Hughes JH, Easom RA, et al. Arachidonic acid metabolism and insulin secretion by isolated human pancreatic islets. Diabetes. 1988;37(7):992‐996. [DOI] [PubMed] [Google Scholar]
- 13. Wettschureck N, Offermanns S. Mammalian G proteins and their cell type specific functions. Physiol Rev. 2005;85(4):1159‐1204. [DOI] [PubMed] [Google Scholar]
- 14. Carboneau BA, Allan JA, Townsend SE, Kimple ME, Breyer RM, Gannon M. Opposing effects of prostaglandin E2 receptors EP3 and EP4 on mouse and human β‐cell survival and proliferation. Molecular metabolism. 2017;6(6):548‐559. [DOI] [PMC free article] [PubMed] [Google Scholar]
- 15. Ceddia RP, Lee DaeKee, Maulis MF, et al. The PGE2 EP3 receptor regulates diet‐induced adiposity in male mice. Endocrinology. 2016;157(1):220‐232. [DOI] [PMC free article] [PubMed] [Google Scholar]
- 16. Kimple ME, Moss JB, Brar HK, et al. Deletion of GalphaZ protein protects against diet‐induced glucose intolerance via expansion of β‐cell mass. J Biol Chem. 2012;287(24):20344‐20355. [DOI] [PMC free article] [PubMed] [Google Scholar]
- 17. Neuman JC, Schaid MD, Brill AL, et al. Enriching islet phospholipids with eicosapentaenoic acid reduces prostaglandin E2 signaling and enhances diabetic β‐cell function. Diabetes. 2017;66(6):1572‐1585. [DOI] [PMC free article] [PubMed] [Google Scholar]
- 18. McRae JR, Day RP, Metz SA, Halter JB, Ensinck JW, Robertson RP. Prostaglandin E2 metabolite levels during diabetic ketoacidosis. Diabetes. 1985;34(8):761‐766. [DOI] [PubMed] [Google Scholar]
- 19. McRae JR, Metz SA, Robertson RP. A role for endogenous prostaglandins in defective glucose potentiation of nonglucose insulin secretagogues in diabetics. Metabolism. 1981;30(11):1065‐1075. [DOI] [PubMed] [Google Scholar]
- 20. Metz SA, McRae JR, Robertson RP. Hypothesis: prostaglandins mediate defective glucose recognition in diabetes mellitus. Prostaglandins Med. 1980;4(4):247‐254. [DOI] [PubMed] [Google Scholar]
- 21. Metz SA, Meredith M, Vadakekalam J, Rabaglia ME, Kowluru A. A defect late in stimulus‐secretion coupling impairs insulin secretion in Goto‐Kakizaki diabetic rats. Diabetes. 1999;48(9):1754‐1762. [DOI] [PubMed] [Google Scholar]
- 22. Robertson RP. Prostaglandins, glucose homeostasis, and diabetes mellitus. Annu Rev Med. 1983;34:1‐12. [DOI] [PubMed] [Google Scholar]
- 23. Robertson RP. Eicosanoids as pluripotential modulators of pancreatic islet function. Diabetes. 1988;37(4):367‐370. [DOI] [PubMed] [Google Scholar]
- 24. Robertson RP. Molecular regulation of prostaglandin synthesis Implications for endocrine systems. Trends Endocrinol Metab. 1995;6(9–10):293‐297. [DOI] [PubMed] [Google Scholar]
- 25. Robertson RP. Dominance of cyclooxygenase‐2 in the regulation of pancreatic islet prostaglandin synthesis. Diabetes. 1998;47(9):1379‐1383. [DOI] [PubMed] [Google Scholar]
- 26. Robertson RP. The COX‐2/PGE2/EP3/Gi/o/cAMP/GSIS pathway in the islet: The beat goes on. Diabetes. 2017;66(6):1464‐1466. [DOI] [PMC free article] [PubMed] [Google Scholar]
- 27. Robertson RP, Chen M, McRae JR, Metz SA. Improvement of insulin secretion in diabetics by a prostaglandin synthesis inhibitor. Adv Exp Med Biol. 1979;119:227‐231. [DOI] [PubMed] [Google Scholar]
- 28. Hohmeier HE, Mulder H, Chen G, Henkel‐Rieger R, Prentki M, Newgard CB. Isolation of INS‐1‐derived cell lines with robust ATP‐sensitive K+ channel‐dependent and ‐independent glucose‐stimulated insulin secretion. Diabetes. 2000;49(3):424‐430. [DOI] [PubMed] [Google Scholar]
- 29. Kimple ME, Nixon AB, Kelly P, et al. A role for G(z) in pancreatic islet β‐cell biology. J Biol Chem. 2005;280(36):31708‐31713. [DOI] [PubMed] [Google Scholar]
- 30. Brill AL, Wisinski JA, Cadena MT, et al. Synergy between galphaz deficiency and GLP‐1 analog treatment in preserving functional β‐cell mass in experimental diabetes. Mol Endocrinol. 2016;30(5):543‐556. [DOI] [PMC free article] [PubMed] [Google Scholar]
- 31. Bhatnagar S, Oler AT, Rabaglia ME, et al. Positional cloning of a type 2 diabetes quantitative trait locus; tomosyn‐2, a negative regulator of insulin secretion. PLoS Genet. 2011;7(10):e1002323. [DOI] [PMC free article] [PubMed] [Google Scholar]
- 32. Flowers MT, Ade L, Strable MS, Ntambi JM. Combined deletion of SCD1 from adipose tissue and liver does not protect mice from obesity. J Lipid Res. 2012;53(8):1646‐1653. [DOI] [PMC free article] [PubMed] [Google Scholar]
- 33. Miyazaki M, Kim HJ, Man WC, Ntambi JM. Oleoyl‐CoA is the major de novo product of stearoyl‐CoA desaturase 1 gene isoform and substrate for the biosynthesis of the Harderian gland 1‐alkyl‐2,3‐diacylglycerol. J Biol Chem. 2001;276(42):39455‐39461. [DOI] [PubMed] [Google Scholar]
- 34. Fenske RJ, Cadena MT, Harenda QE, et al. The inhibitory G protein alpha‐subunit, galphaz, promotes type 1 diabetes‐like pathophysiology in NOD mice. Endocrinology. 2017;158(6):1645‐1658. [DOI] [PMC free article] [PubMed] [Google Scholar]
- 35. Boie Y, Stocco R, Sawyer N, et al. Molecular cloning and characterization of the four rat prostaglandin E2 prostanoid receptor subtypes. Eur J Pharmacol. 1997;340(2–3):227‐241. [DOI] [PubMed] [Google Scholar]
- 36. Alexander SPH, Christopoulos A, Davenport AP, et al. The concise guide to pharmacology 2019/20: G protein‐coupled receptors. Br J Pharmacol. 2019;176(Suppl 1):S21‐S141. [DOI] [PMC free article] [PubMed] [Google Scholar]
- 37. Breyer RM, Clapp L, Coleman RA, et al. Prostanoid receptors (version 2020.4) in the IUPHAR/BPS guide to pharmacology database. IUPHAR/BPS Guide to Pharmacology CITE. 2020;2020(4): 10.2218/gtopdb/F58/2020.4. [DOI] [Google Scholar]
- 38. Abramovitz M, Adam M, Boie Y, et al. The utilization of recombinant prostanoid receptors to determine the affinities and selectivities of prostaglandins and related analogs. Biochim Biophys Acta. 2000;1483(2):285‐293. [DOI] [PubMed] [Google Scholar]
- 39. af Forselles KJ, Root J, Clarke T, et al. In vitro and in vivo characterization of PF‐04418948, a novel, potent and selective prostaglandin EP(2) receptor antagonist. Br J Pharmacol. 2011;164(7):1847‐1856. [DOI] [PMC free article] [PubMed] [Google Scholar]
- 40. Birrell MA, Maher SA, Buckley J, et al. Selectivity profiling of the novel EP2 receptor antagonist, PF‐04418948, in functional bioassay systems: atypical affinity at the guinea pig EP2 receptor. Br J Pharmacol. 2013;168(1):129‐138. [DOI] [PMC free article] [PubMed] [Google Scholar]
- 41. Kiriyama M, Ushikubi F, Kobayashi T, Hirata M, Sugimoto Y, Narumiya S. Ligand binding specificities of the eight types and subtypes of the mouse prostanoid receptors expressed in Chinese hamster ovary cells. Br J Pharmacol. 1997;122(2):217‐224. [DOI] [PMC free article] [PubMed] [Google Scholar]
- 42. Machwate M, Harada S, Leu CT, et al. Prostaglandin receptor EP(4) mediates the bone anabolic effects of PGE(2). Mol Pharmacol. 2001;60(1):36‐41. [DOI] [PubMed] [Google Scholar]
- 43. Sawyer N, Cauchon E, Chateauneuf A, et al. Molecular pharmacology of the human prostaglandin D2 receptor, CRTH2. Br J Pharmacol. 2002;137(8):1163‐1172. [DOI] [PMC free article] [PubMed] [Google Scholar]
- 44. Sharif NA, Davis TL. Cloned human EP1 prostanoid receptor pharmacology characterized using radioligand binding techniques. J Pharm Pharmacol. 2002;54(4):539‐547. [DOI] [PubMed] [Google Scholar]
- 45. Hata AN, Lybrand TP, Breyer RM. Identification of determinants of ligand binding affinity and selectivity in the prostaglandin D2 receptor CRTH2. J Biol Chem. 2005;280(37):32442‐32451. [DOI] [PubMed] [Google Scholar]
- 46. Hata AN, Zent R, Breyer MD, Breyer RM. Expression and molecular pharmacology of the mouse CRTH2 receptor. J Pharmacol Exp Ther. 2003;306(2):463‐470. [DOI] [PubMed] [Google Scholar]
- 47. Sugimoto H, Shichijo M, Okano M, Bacon KB. CRTH2‐specific binding characteristics of [3H]ramatroban and its effects on PGD2‐, 15‐deoxy‐Delta 12, 14‐PGJ2‐ and indomethacin‐induced agonist responses. Eur J Pharmacol. 2005;524(1–3):30‐37. [DOI] [PubMed] [Google Scholar]
- 48. Tran PO, Gleason CE, Poitout V, Robertson RP. Prostaglandin E(2) mediates inhibition of insulin secretion by interleukin‐1beta. J Biol Chem. 1999;274(44):31245‐31248. [DOI] [PubMed] [Google Scholar]
- 49. Irie A, Segi E, Sugimoto Y, Ichikawa A, Negishi M. Mouse prostaglandin E receptor EP3 subtype mediates calcium signals via Gi in cDNA‐transfected Chinese hamster ovary cells. Biochem Biophys Res Commun. 1994;204(1):303‐309. [DOI] [PubMed] [Google Scholar]
- 50. Schaid MD, Green CL, Peter DC, et al. Agonist‐independent Galphaz activity negatively regulates β‐cell compensation in a diet‐induced obesity model of type 2 diabetes. J Biol Chem. 2020;jbc.RA120.015585. 10.1074/jbc.RA120.015585 [DOI] [PMC free article] [PubMed] [Google Scholar]
- 51. Kimple ME, Neuman JC, Linnemann AK, Casey PJ. Inhibitory G proteins and their receptors: Emerging therapeutic targets for obesity and diabetes. Exp Mol Med. 2014;46:e102. [DOI] [PMC free article] [PubMed] [Google Scholar]
- 52. Robertson RP, Seaquist ER, Walseth TF. G proteins and modulation of insulin secretion. Diabetes. 1991;40(1):1‐6. [DOI] [PubMed] [Google Scholar]
- 53. Robertson RP. Β‐cell deterioration during diabetes: what's in the gun? Trends Endocrinol Metab. 2009;20(8):388‐393. [DOI] [PMC free article] [PubMed] [Google Scholar]
- 54. Robertson RP, Tsai P, Little SA, Zhang HJ, Walseth TF. Receptor‐mediated adenylate cyclase‐coupled mechanism for PGE2 inhibition of insulin secretion in HIT cells. Diabetes. 1987;36(9):1047‐1053. [DOI] [PubMed] [Google Scholar]
- 55. Sjoholm A. Prostaglandins inhibit pancreatic β‐cell replication and long‐term insulin secretion by pertussis toxin‐insensitive mechanisms but do not mediate the actions of interleukin‐1 beta. Biochim Biophys Acta. 1996;1313(2):106‐110. [DOI] [PubMed] [Google Scholar]
- 56. Amisten S, Salehi A, Rorsman P, Jones PM, Persaud SJ. An atlas and functional analysis of G‐protein coupled receptors in human islets of Langerhans. Pharmacol Ther. 2013;139(3):359‐391. [DOI] [PubMed] [Google Scholar]
- 57. Keller MP, Choi Y, Wang P, et al. A gene expression network model of type 2 diabetes links cell cycle regulation in islets with diabetes susceptibility. Genome Res. 2008;18(5):706‐716. [DOI] [PMC free article] [PubMed] [Google Scholar]
- 58. Regard JB, Sato IT, Coughlin SR. Anatomical profiling of G protein‐coupled receptor expression. Cell. 2008;135(3):561‐571. [DOI] [PMC free article] [PubMed] [Google Scholar]
- 59. Davani D, Kumar S, Palaia T, Hall C, Ragolia L. Lipocalin‐type prostaglandin D2 synthase reduces glucagon secretion in alpha TC‐1 clone 6 cells via the DP1 receptor. Biochem Biophys Rep. 2015;4:224‐227. [DOI] [PMC free article] [PubMed] [Google Scholar]
- 60. Skrtic S, Tyrberg B, Broberg M, et al. Exploring the insulin secretory properties of the PGD2‐GPR44/DP2 axis in vitro and in a randomized phase‐1 trial of type 2 diabetes patients. PLoS One. 2018;13(12):e0208998. [DOI] [PMC free article] [PubMed] [Google Scholar]
- 61. Jahan M, Johnström P, Selvaraju RK, et al. The development of a GPR44 targeting radioligand [(11)C]AZ12204657 for in vivo assessment of beta cell mass. EJNMMI Res. 2018;8(1):113. [DOI] [PMC free article] [PubMed] [Google Scholar]
- 62. Eriksson O, Johnström P, Cselenyi Z, et al. In vivo visualization of β‐cells by targeting of GPR44. Diabetes. 2018;67(2):182‐192. [DOI] [PubMed] [Google Scholar]
- 63. Hellström‐Lindahl E, Danielsson A, Ponten F, et al. GPR44 is a pancreatic protein restricted to the human beta cell. Acta Diabetol. 2016;53(3):413‐421. [DOI] [PubMed] [Google Scholar]
Associated Data
This section collects any data citations, data availability statements, or supplementary materials included in this article.
Supplementary Materials
Fig S1
Data Availability Statement
All data contained within this manuscript are available upon reasonable request of the corresponding author.