

Abstract
Background
Reducing surgical supply costs can help to lower hospital expenditures. We aimed to evaluate whether variation in supply costs between urologic surgeons performing both robotic or open partial nephrectomies is associated with differential patient outcomes.
Methods
In this retrospective cohort study, we reviewed 399 consecutive robotic (n=220) and open (n=179) partial nephrectomies performed at an academic center. Surgical supply costs were determined at the institution-negotiated rate. Through retrospective review, we identified factors related to case complexity, patient comorbidity, and perioperative outcomes. Two radiologists assigned nephrometry scores to grade tumor complexity. We created univariate and multivariable models for predictors of supply costs, length of stay, and change in serum creatinine.
Results
Median supply cost was $3,201 [interquartile range (IQR): $2,201–3,808] for robotic partial nephrectomy and $968 (IQR: $819–1,772) for open partial nephrectomy. Mean nephrometry score was 7.0 (SD =1.7) for robotic procedures and 8.2 (SD =1.6) for open procedures. In multivariable models, the surgeon was the primary significant predictor of variation in surgical supply costs for both procedure types. In multivariable mixed-effects analysis with surgeon as a random effect, supply cost was not a significant predictor of change in serum creatinine for robotic or open procedures. Supply cost was not a statistically significant predictor of length of stay for the open procedure. Supply cost was a significant predictor of longer length of stay for the robotic procedure, however it was not a clinically meaningful change in length of stay (0.02 days per $100 in supply costs).
Conclusions
Higher supply spending did not predict significantly improved patient outcomes. Variability in surgeon supply preference is the likely source of variability in supply cost. These data suggest that efforts to promote cost-effective utilization and standardization of supplies in partial nephrectomy could help reduce costs without harming patients.
Keywords: Cost analysis, partial nephrectomy, surgical supplies, quality improvement, urologic oncology
Introduction
In 2017, health care spending in the United States totaled $3.5 trillion, or 17.9% of the gross domestic product (1). As health care spending continues to rise, emphasis has been placed on the delivery of high-value care, which aims to minimize costs for patients, physicians, and hospitals while maintaining high quality (2,3). Many institutions have adopted initiatives aimed at reducing the use of unnecessary tests and treatments, while others have focused on reducing practice variation that is not warranted by patient preference or treatment guidelines (4,5).
Because the operating room is one of the main cost drivers in a hospital, reducing supply costs while delivering high quality outcomes can help move the healthcare system towards higher value care. Studies across surgical procedures, including those evaluating appendectomy, colectomy, cholecystectomy, and laparoscopic nephrectomy, have shown that surgical supply costs differ widely among surgeons (6-10). Efforts to standardize surgeon preference cards have resulted in cost reduction without affecting quality across surgical specialties (11). However, these efforts are often met with resistance because surgeons may prefer different supplies based on their training or experience and may also believe that certain more expensive supplies in the operating room translate into better patient outcomes. A better understanding of the impact of surgical supply cost variation on patient outcomes can inform efforts to contain surgical supply costs without negatively impacting patient outcomes.
In recent years, the diagnosis and treatment of small renal masses has continued to rise (12,13). With this growth in surgical management for small renal masses, there has also been an increase in the variation of surgical approaches (14,15). In this study we aimed to evaluate whether variation in surgical supply costs between urologic surgeons performing robotic or open partial nephrectomies is associated with differential patient outcomes within each procedure. We present the following article in accordance with the STROBE reporting checklist (available at http://dx.doi.org/10.21037/tau-20-1050).
Methods
Data
We identified 470 robotic-assisted and open partial nephrectomies performed at the University of California San Francisco between 9/2012 and 12/2017. We retrospectively collected patient demographics, comorbidity [body mass index (BMI), American Society of Anesthesiologists physical status classification (ASA), pre- and post-operative creatinine], and tumor characteristics (RENAL nephrometry score, pathologic T stage, histology, and surgical margin status). All images were re-reviewed by two radiologists (AHB, AAB) to assign RENAL nephrometry scores to each tumor (16). We excluded cases lacking available pre-operative imaging, those that were converted from robotic-assisted to open operations or from partial to radical nephrectomy, cases with more than one tumor, and those performed by surgeons who performed five or fewer cases during that time period. All procedures performed in this study were in accordance with the Declaration of Helsinki (as revised in 2013) and approved by the institutional review board at the University of California San Francisco (1517091). Because of the retrospective nature of the research, the requirement for informed consent was waived.
Outcomes
We assessed surgical supply utilization from operating room billing records and surgical supply costs at the institution-negotiated rate for each item used. We assessed surgical supply cost as an outcome measure, using predictors such as surgeon and patient clinical characteristics. We then used surgical supply cost as a predictor variable along with other factors to assess clinical outcomes, which included length of stay and perioperative change in serum creatinine. Length of stay (in days) was used as an assessment of short-term perioperative outcomes. As a longer-term and patient-centric metric, we evaluated perioperative changes in serum creatinine. Pre-operative creatinine values within 1 month prior to surgery and the first post-operative creatinine values at least 30 post-operatively were considered.
Statistical analysis
Differences in patient cohorts between surgeons were compared using the Chi-squared test for categorical variables and analysis of variance (ANOVA) for continuous factors. Bivariate associations between patient characteristics and outcomes (supply cost, length of stay, and perioperative change in serum creatinine) were evaluated using ANOVA. We then created multivariable linear regression models to determine predictors of supply costs, length of stay, and perioperative change in serum creatinine, controlling for patient characteristics. We used mixed-effects multivariable linear regression models to identify predictors of length of stay and perioperative change in serum creatinine, with surgeon as the random effect variable. By setting surgeon as a random effect in this modeling we can better account for non-independence and clustering in the data that arises from multiple patients being treated by the same surgeon. All analyses were performed using R 3.5. A P value of <0.05 was considered significant.
Results
Of 470 total partial nephrectomies performed at our institution between 9/05/12–12/22/17, 399 met criteria for this study. A total of 220 robotic partial nephrectomies were performed by four surgeons and 179 open partial nephrectomies performed by five surgeons. The mean nephrometry score was higher for open compared to robotic procedures (8.2, SD =1.6 vs. 7.0, SD =1.7). Within each procedure type, there were no significant differences in patient sex, BMI, ASA status, pre-operative creatinine, pathologic T stage, tumor histology, or RENAL nephrometry score between surgeons (Tables 1,2).
Table 1. Characteristics of patients undergoing robotic-assisted partial nephrectomy.
| Variables | Surgeon A | Surgeon C | Surgeon D | Surgeon E | P value |
|---|---|---|---|---|---|
| Surgeon and case characteristics | |||||
| Cases, n | 75 | 14 | 122 | 9 | |
| Supply cost ($), median (IQR) | 1,833 (1,665–2,132) | 2,479 (2,124–2,555) | 3,746 (3,478–4,287) | 2,350 (1,826–2,454) | <0.01 |
| Case duration (minutes), median (IQR) | 178 (169–198) | 271 (242–308) | 222 (196–254) | 260 (249–309) | <0.01 |
| Patient characteristics | |||||
| Age (years), median (IQR) | 57.8 (47.6–67.2) | 60 (51.8–62) | 61.1 (52.5–67.9) | 49.8 (42.3–59.5) | 0.11 |
| Sex (male), % | 62.7 | 71.4 | 60.7 | 55.6 | 0.88 |
| BMI, median (IQR) | 29.0 (25.9–33.9) | 30.3 (27.6–32.7) | 30.5 (26.2–35.3) | 25.2 (21.4–29.3) | 0.10 |
| ASA 1, n (%) | 7 (9.3) | 0 (0.0) | 5 (4.1) | 0 (0.0) | 0.38 |
| ASA 2, n (%) | 50 (66.7) | 11 (78.6) | 76 (62.8) | 8 (88.9) | |
| ASA 3, n (%) | 18 (24.0) | 3 (21.4) | 40 (33.1) | 1 (11.1) | |
| ASA 4, n (%) | 0 (0.0) | 0 (0.0) | 0 (0.0) | 0 (0.0) | |
| Pre-op creatinine, median (IQR) | 0.9 (0.73–1.02) | 0.87 (0.78–1.03) | 0.88 (0.75–1.09) | 0.81 (0.74–0.95) | 0.36 |
| Tumor characteristics | |||||
| Pathologic T stage, % | 84.6 | 81.8 | 65.7 | 85.7 | 0.31 |
| pT1a, n (%) | 55 (84.6) | 9 (81.8) | 69 (65.7) | 6 (85.7) | |
| pT1b, n (%) | 6 (9.2) | 1 (9.1) | 19 (18.1) | 0 (0.0) | |
| pT2a, n (%) | 1 (1.5) | 1 (9.1) | 2 (1.9) | 0 (0.0) | |
| pT2b, n (%) | 0 (0.0) | 0 (0.0) | 2 (1.9) | 0 (0.0) | |
| pT3a, n (%) | 3 (4.6) | 0 (0.0) | 13 (12.4) | 0 (0.0) | |
| Histology (clear cell), % | 65.3 | 64.3 | 59.5 | 44.4 | 0.74 |
| Surgical margins (positive), % | 1.4 | 15.4 | 10.5 | 0.0 | 0.04 |
| RENAL nephrometry score, median (IQR) | 7.0 (5.0–8.0) | 6.0 (5.0–7.8) | 7.0 (6.0–8.0) | 7.0 (5.0–8.0) | 0.64 |
IQR, interquartile range; BMI, body mass index; ASA, American Society of Anesthesiologists physical status classification.
Table 2. Characteristics of patients undergoing open partial nephrectomy.
| Variables | Surgeon A | Surgeon B | Surgeon D | Surgeon E | Surgeon F | P value |
|---|---|---|---|---|---|---|
| Surgeon and case characteristics | ||||||
| Cases, n | 94 | 6 | 36 | 30 | 13 | |
| Mean supply cost in $, median (IQR) | 920 (690–979) | 1,755 (1,622–1,896) | 2,229 (2,062–2,345) | 935 (830–1,003) | 1,692 (1,277–1,942) | <0.01 |
| Case duration (minutes), median (IQR) | 248 (220–275) | 346 (318–405) | 283 (256–298) | 308 (267–332) | 357 (327–376) | <0.01 |
| Patient characteristics | ||||||
| Age, median (IQR) | 59.2 (45.8–65.7) | 63.7 (57–71.2) | 63.4 (56.3–71.3) | 50.4 (38.5–65.8) | 60.5 (52.7–64.3) | 0.02 |
| Sex (male), % | 69.1 | 83.3 | 63.9 | 53.3 | 53.8 | 0.41 |
| BMI, median (IQR) | 29.3 (25.5–34.2) | 26.9 (26–28.2) | 30.2 (26.6–34.9) | 28.3 (24.4–32.5) | 31.5 (23.4–37.9) | 0.41 |
| ASA 1, n (%) | 3 (3.2) | 0 (0.0) | 0 (0.0) | 4 (13.3) | 0 (0.0) | 0.10 |
| ASA 2, n (%) | 51 (54.8) | 5 (83.3) | 15 (41.7) | 18 (60.0) | 9 (69.2) | |
| ASA 3, n (%) | 38 (40.9) | 1 (16.7) | 21 (58.3) | 8 (26.7) | 4 (30.8) | |
| ASA 4, n (%) | 1 (1.1) | 0 (0.0) | 0 (0.0) | 0 (0.0) | 0 (0.0) | |
| Pre-op creatinine, median (IQR) | 0.95 (0.78–1.27) | 0.94 (0.92–1.01) | 1.02 (0.8–1.3) | 0.85 (0.66–0.98) | 0.94 (0.87–1.02) | 0.15 |
| Tumor characteristics | ||||||
| Pathologic T stage, % | 41.7 | 50.0 | 34.5 | 34.6 | 69.2 | 0.49 |
| pT1a, n (%) | 35 (41.7) | 2 (50.0) | 10 (34.5) | 9 (34.6) | 9 (69.2) | |
| pT1b, n (%) | 34 (40.5) | 0 (0.0) | 13 (44.8) | 11 (42.3) | 2 (15.4) | |
| pT2a, n (%) | 5 (6.0) | 1 (25.0) | 2 (6.9) | 3 (11.5) | 1 (7.7) | |
| pT2b, n (%) | 1 (1.2) | 0 (0.0) | 1 (3.4) | 1 (3.8) | 0 (0.0) | |
| pT3a, n (%) | 9 (10.7) | 1 (25.0) | 3 (10.3) | 2 (7.7) | 1 (7.7) | |
| Histology (clear cell), % | 66.0 | 16.7 | 69.4 | 70.0 | 76.9 | 0.08 |
| Surgical margins (positive), % | 13.2 | 16.7 | 11.4 | 3.4 | 0.0 | 0.37 |
| RENAL nephrometry score, median (IQR) | 9.0 (7.0–10.0) | 9.0 (7.5–9.8) | 8.0 (7.0–9.0) | 8.5 (7.2–10.0) | 8.0 (7.0–8.0) | 0.10 |
IQR, interquartile range; BMI, body mass index; ASA, American Society of Anesthesiologists physical status classification.
The total cost of surgical supplies used in these cases during this period was $7,607,291, or $1,429,722 per year. Median supply cost was $3,201 [interquartile range (IQR): $2,021–3,808] for robotic partial nephrectomy and $968 (IQR: $819–1,772) for open partial nephrectomy. Hemostatic agents (e.g., FLOSEAL hemostatic matrix) and energy devices (e.g., Ligasure bipolar electrosurgical device) were the costliest surgical supply categories on average for both procedure types (Table 3). Surgical supply cost significantly differed by surgeon for both robotic and open procedures (P<0.01, Table 4). Among the four surgeons performing robotic partial nephrectomy, the median supply cost ranged from $1,833 (IQR: $1,665–2,132) to $3,746 (IQR: $3,478–4,287) (Figure 1). For open partial nephrectomy, the lowest cost surgeon had a median supply cost of $920 (IQR: $690–979) while the highest cost surgeon had a median supply cost of $2,229 (IQR: $1,622–1,896) (Figure 2). Of note, the same surgeons were identified as being lowest and highest cost for both open and robotic surgery.
Table 3. Highest mean item supply cost categories by procedure type.
| Item category | Total cases item used in | Aggregate item cost ($) | Total quantity used | Mean item cost per case ($)* |
|---|---|---|---|---|
| Open partial nephrectomy | ||||
| Hemostatic agents | 256 | 213,114 | 1276 | 823 |
| Energy devices | 9 | 3,618 | 11 | 402 |
| Setup | 256 | 9,123 | 2,522 | 352 |
| Miscellaneous | 256 | 88,126 | 794 | 344 |
| Hemostatic control | 256 | 81,160 | 2,098 | 317 |
| Robot partial nephrectomy | ||||
| Hemostatic agents | 228 | 124,165 | 795 | 545 |
| Energy devices | 81 | 32,929 | 90 | 407 |
| Setup | 231 | 44,268 | 3,302 | 192 |
| Miscellaneous | 229 | 24,846 | 1,864 | 109 |
*, Mean item cost per case calculated only with cases in which item was used. Hemostatic agents: Floseal, Tisseel, Surgicel, Arista, Surgifoam. Hemostatic control: Surgical clips, clip appliers, laparoscopic cautery hook. Energy device: Ligasure, Harmonic scalpel, Aquamantys bipolar sealer, Sonicision. Setup: drapes, suction and irrigation devices, Foley catheters, etc.
Table 4. Predictors of surgical supply costs: bivariate and multivariable regression.
| Predictor | Robot-assisted | Open | |||||||||
|---|---|---|---|---|---|---|---|---|---|---|---|
| Bivariate | Multivariable | Bivariate | Multivariable | ||||||||
| Estimate (95% CI) | P | Estimate (95% CI) | P | Estimate (95% CI) | P | Estimate (95% CI) | P | ||||
| Surgeon | <0.01 | <0.01 | |||||||||
| Surgeon A | 1,897 (1,776 to 2,018) | Ref. | 917 (836 to 997) | Ref. | |||||||
| Surgeon B | – | – | 978 (648 to 1,308) | 639 (639 to 1,310) | <0.01 | ||||||
| Surgeon C | 495 (189 to 801) | 541 (244 to 838) | <0.01 | – | – | – | |||||
| Surgeon D | 2,020 (1,866 to 2,174) | 1,989 (1,835 to 2,134) | <0.01 | 1,222 (1,067 to 1,376) | 1,188 (1,030 to 1,346) | <0.01 | |||||
| Surgeon E | 476 (105 to 846) | 545 (183 to 908) | <0.01 | 93 (–71 to 257) | 132 (–38 to 303) | 0.13 | |||||
| Surgeon F | – | – | 771 (539 to 1,003) | 747 (509 to 985) | <0.01 | ||||||
| Age | 8 (–4 to 20) | 0.19 | –5 (–11 to 1) | 0.12 | 11 (5 to 18) | <0.01 | 3 (–2 to 8) | 0.24 | |||
| Sex | –132 (–432 to 168) | 0.39 | –83 (–241 to 75) | 0.30 | 60 (–138 to 258) | 0.55 | 66 (–70 to 203) | 0.34 | |||
| BMI | 31 (12 to 50) | <0.01 | 9 (–1 to 20) | 0.08 | 9 (–5 to 23) | 0.22 | 2 (–8 to 11) | 0.74 | |||
| ASA 2 | 281 (–357 to 919) | <0.01 | 95 (–240 to 430) | 0.58 | 294 (–194 to 782) | 0.04 | –12 (–339 to 315) | 0.94 | |||
| ASA 3 | 763 (94 to 1,433) | – | 285 (–78 to 648) | 0.12 | 511 (17 to 1,005) | – | 62 (–283 to 407) | 0.72 | |||
| ASA 4 | – | – | – | – | –313 (–1,646 to 1,021) | – | –385 (–1,241 to 471) | 0.38 | |||
| Pre-op creatinine | 496 (–17 to 1,009) | 0.06 | 177 (–104 to 459) | 0.22 | 160 (–59 to 379) | 0.15 | 14 (–149 to 177) | 0.86 | |||
| Nephrometry score | 111 (26 to 196) | 0.01 | 46 (4 to 87) | 0.03 | –44 (–102 to 14) | 0.14 | –26 (–64 to 12) | 0.18 | |||
CI, confidence interval; BMI, body mass index; ASA, American Society of Anesthesiologists physical status classification.
Figure 1.
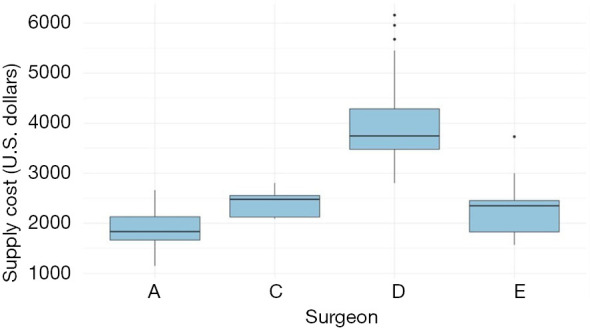
Robotic partial nephrectomy supply cost by surgeon.
Figure 2.
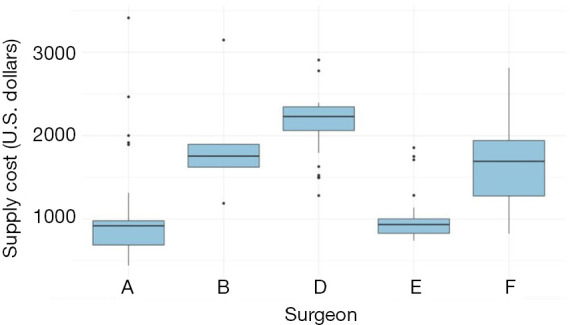
Open partial nephrectomy supply cost by surgeon.
We first assessed factors associated with variation in surgical supply costs. In univariate analysis, the surgeon was associated with surgical supply cost variation for both open and robotic partial nephrectomy (P<0.01, Table 4). Univariate analysis showed that increased patient BMI, ASA functional class, and nephrometry score were also significant predictors of increased supply cost for robotic partial nephrectomy (Table 4). However, in fixed-effects multivariable analysis of supply costs for the robotic procedure only surgeons and nephrometry score were associated with significant variation in surgical supply cost ($541–1,989 higher per case than lowest cost surgeon). In a mixed-effects multivariable model of robotic supply costs with surgeon as a random effect, only nephrometry score was associated with supply costs ($46 per point increase in nephrometry score; 95% CI, $6–87) (Table S1). Bivariate analysis of open partial nephrectomy supply cost revealed that increased patient age and ASA functional class were associated with increased supply cost (Table 4). On multivariable fixed-effects analysis, these variables were no longer significant predictors and again only surgeon was associated with variation in supply cost. With the exception of Surgeon E, all open surgeons in multivariable fixed-effects analysis were significant predictors of surgical supply cost in reference to Surgeon A ($747–1,188 more per case) (Table 4). In a mixed-effects multivariable model of open supply costs with surgeon as a random effect, there were no significant associations with surgical supply cost (Table S1).
We then turned our attention to the impact of supply costs on patient-related outcomes. In multivariable mixed-effects analysis adjusted for patient demographics and case complexity, supply cost was not a statistically significant predictor of length of stay for the open procedure (95% CI, –0.0002 to 0.0005). Supply cost was a significant predictor of longer length of stay for the robotic procedure, however it was not a clinically meaningful change in length of stay (0.02 days per $100 in supply costs) (Table S2). Surgical supply costs were similarly not associated with perioperative changes in serum creatinine for either the robotic (95% CI, –0.0002 to 0.00004) or open procedures (95% CI, –0.0002 to 0.00008) in multivariable mixed-effects analysis (Table S3).
Discussion
We evaluated patient- and provider-related factors and surgical supply costs for open and robotic partial nephrectomy at a large, high-volume academic medical center. For both procedures, we found that the individual surgeon was the only significant factor associated with cost variation. In a mixed-effect model, with surgeon as the random effect in order to account for clustering of patient data by surgeon, there were no significant associations predicting variation in supply cost. Additionally, we found that higher supply costs were not associated with significantly improved short-term outcomes, as measured by length of stay and perioperative change in serum creatinine. These results suggest that cost-effective utilization of partial nephrectomy surgical supplies could help contain healthcare costs without a negative impact on patients.
Prior investigations have found that higher spending in the operating room does not necessarily correlate with improved patient outcomes. Previously, we showed that surgical supply cost was not associated with length of stay following laparoscopic nephrectomy (P=0.85) (11). Other studies of surgical supply cost have focused more on complication rates following surgery. Brauer et al. examined laparoscopic cholecystectomy and found that variation in supply cost had no effect on complication rate (17,18). Brauer et al. also showed that supply costs in pancreaticoduodenectomy similarly were not associated with complication rate following surgery (19).
We separately analyzed costs and outcomes between the robotic and open procedures because the supplies and outcomes, such as length of stay, are considerably different between the two procedure types. We found that the robotic-assisted procedure is characterized by a higher median cost and wider IQR than open partial nephrectomy. This shows a greater potential for addressing surgeon-driven supply cost variation in robotic procedures than in open procedures. As the use of robotic surgical technologies continues to grow, it will be important to understand how to better address cost variation on the surgeon level. Cost studies of the 90-day direct hospital costs associated with robotic-assisted radical prostatectomy at an institutional level found that surgeons and hospitals with a higher volume of cases had a decreased odds of performing high cost robotic-assisted radical prostatectomies (20,21). They also found that approximately one-third of costs are attributable to hospital characteristics (size, geography, teaching status, etc.) and one-fifth of costs are attributable to surgeon characteristics. These studies help to identify the important relationships between volume and costs in robotic surgery. The results of our study, particularly that surgeons are the primary driver of variation in robotic partial nephrectomy, encourage further investigation into cost variability by surgeon in other robotic procedures.
We found that the highest and lowest cost surgeons were consistent across both the open and robotic techniques. This consistency in surgeon behavior across procedures suggests that interventions targeted at modifying surgeon knowledge of supply costs, behavior, and choice is critical for supply cost containment. A study of cholecystectomy showed that education on supply costs alone reduced costs by 10% without a significant effect on outcomes (22). An intervention designed to educate surgeons with a scorecard of their median surgical supply costs compared to other surgeons combined with a small departmental financial incentive for cost reductions was associated with a 9.95% reduction in surgical supply costs (P<0.01) (23). Systemic changes, such as preference card review and standardization, may be necessary for a substantial, sustained impact on surgical supply cost containment. Our supply cost analysis showed that hemostatic agents and energy devices were the primary drivers of increased costs for both robotic and open partial nephrectomies. Greater awareness of these high-cost items and potential lower costs alternatives can help surgeons contain cost without compromising quality.
Studies in laparoscopic appendectomy and laparoscopic cholecystectomy have shown that standardized case cards can reduce the cost of supplies by 17–30% per case (24-27). Efforts to promote standardization will likely be met with some resistance, particularly in more complex surgeries, since surgeons become comfortable with certain methods which may require specific supplies. Some openness to change will be important, as will continued prospective measurement of any potential impact that changes to surgical supplies may have on quality of care.
Standardization of supplies may indeed reduce costs across surgical procedures, but other strategies might more actively involve surgeons in cutting costs. Under the current reimbursement model, reducing costs of surgical supplies would benefit only the institution, not the surgeons who would themselves be creating those savings. Implementation of an institution-wide shared savings program at one hospital resulted in generation of almost $900,000 in total savings annually across several surgical divisions (28). Bundled payments have also been championed by those seeking to improve the value of care (29). Although alternative payment models like these are not yet widespread, giving all parties a stake in the value of care provided has the potential to be more effective at reducing costs than education or standardization alone.
This study has several limitations. As an observational study of surgeons practicing at a large academic institution, the results of this study may not be generalizable to other surgeons or practice settings. Certain practices may see a wider variation in patient comorbidity or surgical complexity, and these factors may in some cases contribute to variation in surgical supply cost. Our study also showed that supplies used in robotic partial nephrectomy were substantially higher cost than those used in the open procedure. Robotic procedures have nonetheless increased in incidence, as a less invasive procedure should allow the patient to heal more quickly and might therefore lead to decreased length of stay. However, a direct comparison of the relative value of these procedures is beyond the scope of our current analysis, and patients receiving open versus robotic partial nephrectomy at institutions performing both procedures are likely not identical populations. Our study is limited in the ability to control for variation in case difficulty. We adjusted for differences in patients and case complexity by including patient characteristics such as BMI, comorbidities, tumor complexity, and pre-operative renal function. These adjustments do not perfectly account for variation in case difficulty, but combined with our large sample size, are appropriate control measures for case difficulty. Additionally, surgeons in the study had different levels of experience, case volume, and trainee involvement. We did not separately adjust for this in our multivariable modeling due to the small number of surgeons represented. We limited the effect that inexperience might have on the data by eliminating procedures performed by surgeons who performed five or fewer surgeries of either type. Lastly, our outcome measures are limited by lack of granularity (ex-length of stay measured in days not hours) and variability in outcome measurements between patients (ex-time between pre- and post-operative creatinine measurements varied). However, other potential complication-related outcomes such as transfusion rates or mortality were very rare. We considered estimated blood loss (EBL) as an outcome, however we felt it had limited clinical significance since transfusions were rare and EBL is often unreliably recorded (30). Given these limitations, length of stay helped to assess whether increased spending in the operating room translated to improved patient recovery after surgery. Similarly, perioperative change in serum creatinine helped to assess the association between surgical supply spending and the potential impact surgery had on kidney function.
Conclusions
In this study of supply cost variation at a high-volume center for partial nephrectomy, we found that surgeons were the primary driver of variation in supply cost and that higher supply costs were not associated with significantly improved patient outcomes, as measured by length of stay and perioperative change in creatinine. Variability in surgeon supply preference is the likely source of variability in supply cost. Regardless, excellent outcomes were achieved by all surgeons across all modalities. These data suggest that efforts to promote cost-effective utilization of surgical supplies in partial nephrectomies could help contain healthcare costs without causing harm to patients.
Supplementary
The article’s supplementary files as
Acknowledgments
Funding: None.
Ethical Statement: The authors are accountable for all aspects of the work in ensuring that questions related to the accuracy or integrity of any part of the work are appropriately investigated and resolved. All procedures performed in this study were in accordance with the Declaration of Helsinki (as revised in 2013) and approved by the institutional review board at the University of California San Francisco (1517091) Because of the retrospective nature of the research, the requirement for informed consent was waived.
Footnotes
Reporting Checklist: The authors have completed the STROBE reporting checklist. Available at http://dx.doi.org/10.21037/tau-20-1050
Conflicts of Interest: All authors have completed the ICMJE uniform disclosure form (available at http://dx.doi.org/10.21037/tau-20-1050). The authors have no conflicts of interest to declare.
References
- 1.Martin AB, Hartman M, Washington B, et al. National health care spending in 2017: growth slows to post-great recession rates; share of GDP stabilizes. Health Aff (Millwood) 2019;38:101377hlthaff201805085. [DOI] [PubMed]
- 2.Porter ME. What is value in health care? N Engl J Med 2010;363:2477-81. 10.1056/NEJMp1011024 [DOI] [PubMed] [Google Scholar]
- 3.Porter ME. A strategy for health care reform--toward a value-based system. N Engl J Med 2009;361:109-12. 10.1056/NEJMp0904131 [DOI] [PubMed] [Google Scholar]
- 4.Levinson W, Kallewaard M, Bhatia RS, et al. “Choosing Wisely”: a growing international campaign. BMJ Qual Saf 2015;24:167-74. 10.1136/bmjqs-2014-003821 [DOI] [PubMed] [Google Scholar]
- 5.Wennberg JE. Practice variations and health care reform: connecting the dots. Health Aff (Millwood) 2004;Suppl Variation:VAR140-4. [DOI] [PubMed]
- 6.Lukish J, Powell D, Morrow S, et al. Laparoscopic appendectomy in children. Arch Surg 2007;142:58-61; discussion 62. 10.1001/archsurg.142.1.58 [DOI] [PubMed] [Google Scholar]
- 7.Crawshaw BP, Chien HL, Augestad KM, et al. Effect of laparoscopic surgery on health care utilization and costs in patients who undergo colectomy. JAMA Surg 2015;150:410-5. 10.1001/jamasurg.2014.3171 [DOI] [PubMed] [Google Scholar]
- 8.Bedeir K, Mann A, Youssef Y. Robotic single-site versus laparoscopic cholecystectomy: which is cheaper? A cost report and analysis. Surg Endosc 2016;30:267-72. 10.1007/s00464-015-4203-0 [DOI] [PubMed] [Google Scholar]
- 9.Hall BL, Campbell DA, Phillips LRS, et al. Evaluating individual surgeons based on total hospital costs: evidence for variation in both total costs and volatility of costs. J Am Coll Surg 2006;202:565-76. 10.1016/j.jamcollsurg.2005.12.015 [DOI] [PubMed] [Google Scholar]
- 10.Hampson LA, Odisho AY, Meng MV. Variation in laparoscopic nephrectomy surgical costs: opportunities for high value care delivery. Urol Pract 2018;5:334-41. 10.1016/j.urpr.2017.09.003 [DOI] [PMC free article] [PubMed] [Google Scholar]
- 11.Robinson JR, Carter NH, Gibson C, et al. Improving the value of care for appendectomy through an individual surgeon-specific approach. J Pediatr Surg 2018;53:1181-6. 10.1016/j.jpedsurg.2018.02.081 [DOI] [PMC free article] [PubMed] [Google Scholar]
- 12.Ghani KR, Sukumar S, Sammon JD, et al. Practice patterns and outcomes of open and minimally invasive partial nephrectomy since the introduction of robotic partial nephrectomy: results from the nationwide inpatient sample. J Urol 2014;191:907-12. 10.1016/j.juro.2013.10.099 [DOI] [PubMed] [Google Scholar]
- 13.Turner RM, Morgan TM, Jacobs BL. Epidemiology of the small renal mass and the treatment disconnect phenomenon. Urol Clin North Am 2017;44:147-54. 10.1016/j.ucl.2016.12.001 [DOI] [PMC free article] [PubMed] [Google Scholar]
- 14.Wu Z, Li M, Liu B, et al. Robotic versus open partial nephrectomy: a systematic review and meta-analysis. PLoS One 2014;9:e94878. 10.1371/journal.pone.0094878 [DOI] [PMC free article] [PubMed] [Google Scholar]
- 15.Benway BM, Bhayani SB, Rogers CG, et al. Robot assisted partial nephrectomy versus laparoscopic partial nephrectomy for renal tumors: a multi-institutional analysis of perioperative outcomes. J Urol 2009;182:866-72. 10.1016/j.juro.2009.05.037 [DOI] [PubMed] [Google Scholar]
- 16.Kutikov A, Uzzo RG. The R.E.N.A.L. nephrometry score: a comprehensive standardized system for quantitating renal tumor size, location and depth. J Urol 2009;182:844-53. 10.1016/j.juro.2009.05.035 [DOI] [PubMed] [Google Scholar]
- 17.Brauer DG, Hawkins WG, Strasberg SM, et al. Cost variation in a laparoscopic cholecystectomy and the association with outcomes across a single health system: implications for standardization and improved resource utilization. HPB 2015;17:1113-8. 10.1111/hpb.12500 [DOI] [PMC free article] [PubMed] [Google Scholar]
- 18.Adkins HH, Hardacker TJ, Ceppa EP. Examining variation in cost based on surgeon choices for elective laparoscopic cholecystectomy. Surg Endosc 2016;30:2679-84. 10.1007/s00464-015-4553-7 [DOI] [PubMed] [Google Scholar]
- 19.Brauer DG, Ohman KA, Jaques DP, et al. Surgeon variation in intraoperative supply cost for pancreaticoduodenectomy: is intraoperative supply cost associated with outcomes? J Am Coll Surg 2018;226:37-45.e1. 10.1016/j.jamcollsurg.2017.10.007 [DOI] [PMC free article] [PubMed] [Google Scholar]
- 20.Cole AP, Leow JJ, Chang SL, et al. Surgeon and hospital level variation in the costs of robot-assisted radical prostatectomy. J Urol 2016;196:1090-5. 10.1016/j.juro.2016.04.087 [DOI] [PubMed] [Google Scholar]
- 21.Herrel LA, Syrjamaki JD, Linsell SM, et al. Identifying drivers of episode cost variation with radical prostatectomy. Urology 2016;97:105-10. 10.1016/j.urology.2016.05.071 [DOI] [PubMed] [Google Scholar]
- 22.Gitelis M, Vigneswaran Y, Ujiki MB, et al. Educating surgeons on intraoperative disposable supply costs during laparoscopic cholecystectomy: a regional health system’s experience. Am J Surg 2015;209:488-92. 10.1016/j.amjsurg.2014.09.023 [DOI] [PubMed] [Google Scholar]
- 23.Zygourakis CC, Valencia V, Moriates C, et al. Association between surgeon scorecard use and operating room costs. JAMA Surg 2017;152:284-91. 10.1001/jamasurg.2016.4674 [DOI] [PubMed] [Google Scholar]
- 24.Avansino JR, Goldin AB, Risley R, et al. Standardization of operative equipment reduces cost. J Pediatr Surg 2013;48:1843-9. 10.1016/j.jpedsurg.2012.11.045 [DOI] [PubMed] [Google Scholar]
- 25.Guzman MJ, Gitelis ME, Linn JG, et al. A model of cost reduction and standardization. Dis Colon Rectum 2015;58:1104-7. 10.1097/DCR.0000000000000463 [DOI] [PubMed] [Google Scholar]
- 26.Skarda DE, Rollins M, Andrews S, et al. One hospital, one appendectomy: The cost effectiveness of a standardized doctor’s preference card. J Pediatr Surg 2015;50:919-22. 10.1016/j.jpedsurg.2015.03.009 [DOI] [PubMed] [Google Scholar]
- 27.Simon KL, Frelich MJ, Gould JC. Picking apart surgical pick lists--reducing variation to decrease surgical costs. Am J Surg 2018;215:19-22. 10.1016/j.amjsurg.2017.06.024 [DOI] [PubMed] [Google Scholar]
- 28.Eiferman D, Bhakta A, Khan S. Implementation of a shared-savings program for surgical supplies decreases inventory cost. Surgery 2015;158:996-1000; discussion 1000-2. 10.1016/j.surg.2015.06.010 [DOI] [PubMed] [Google Scholar]
- 29.Mok JM, Martinez M, Smith HE, et al. Impact of a bundled payment system on resource utilization during spine surgery. Int J Spine Surg 2016;10:19. 10.14444/3019 [DOI] [PMC free article] [PubMed] [Google Scholar]
- 30.Rothermel LD, Lipman JM. Estimation of blood loss is inaccurate and unreliable. Surgery 2016;160:946-53. 10.1016/j.surg.2016.06.006 [DOI] [PubMed] [Google Scholar]
Associated Data
This section collects any data citations, data availability statements, or supplementary materials included in this article.
Supplementary Materials
The article’s supplementary files as