

Abstract
Background
Pleckstrin homology domain family A (PHLDA) genes play important roles in cancer cellular processes, including inhibiting Akt activation, repressing growth factor signaling, inhibiting the negative feedback of EGFR/ErbB2 signaling cells, and inducing apoptosis. However, the prognostic significance of PHLDA in non-small cell lung cancer (NSCLC) and malignant pleural mesothelioma (MM) remains unclear. The present study investigates the associations between PHLDA expression patterns and their prognostic value in lung adenocarcinoma (LUAD) and MM.
Methods
We analyzed PHLDA family members at the genomic level in silico to explore their mRNA expression pattern and predictive significance in LUAD and MM. We then created a PHLDA–drug interaction network and a protein-protein interaction (PPI) network using different databases. Finally, we immunohistochemically assessed the protein expression of each PHLDA family member on tissue microarrays (TMAs) in both LUAD and MM cohorts with long-term follow-up.
Results
While PHLDA1 mRNA expression in both LUAD and MM was lower than that of normal tissue, PHLDA2 mRNA was significantly overexpressed in LUAD, and PHLDA3 mRNA was overexpressed in MM. In NSCLC, both low PHLDA1 mRNA expression and high PHLDA3 mRNA expression correlated with worse overall survival (OS) (P<0.01), whereas high PHLDA2 mRNA expression was associated with better OS (P<0.01). In MM, patients presenting high PHLDA1 and PHLDA2 mRNA expression had poor OS (P=0.01 and P<0.01, respectively). In addition, the PHLDA-drug interaction network indicated that several common drugs could potentially modulate PHLDA expression, and the PPI network suggested that PHLDA1 interacts with Notch family members, whereas PHLDA3 interacts with TP53. Our results also showed that the expression of PHLDA2 and PHLDA3 was significantly higher in LUAD and MM than that of PHLDA1 (P<0.05) and was associated with the risk of death. While patients with PHLDA2 >85.09 cells/mm2 had a low risk of death (P=0.01) and a median survival time of 48 months, those with PHLDA3 <70.38 cells/mm2 had a high risk of death (P=0.03) and a median survival time of 34 months.
Conclusions
We shed light on the role of the PHLDA family as promising predictive biomarkers and potential therapeutic targets in LUAD and MM.
Keywords: Morphometry, data mining, malignant mesothelioma, lung adenocarcinoma, pleckstrin homology-like domain family A (PHLDA)
Introduction
Non-small cell lung cancer (NSCLC) and malignant pleural mesothelioma (MM) are pathologies that share the common fact that both are potentially highly aggressive tumors, and their prognosis is highly dependent on the histological subtype, lymph node status, and the pathological TNM stage of the disease (1-4). In addition, these characteristics end up influencing the decision-making decision regarding the therapeutic strategy. For both, surgery is the standard treatment for patients with early disease, however, the overall 5-year survival rate remains below 50% (1-3).
Today, the major difference between these pathologies is the broader range of therapeutic possibilities available for NSCLC, while MM does not yet have a broad arsenal. Therefore, new biomarkers are much necessary that could assist in more individualized treatment for both pathologies. Since conventional therapeutic protocols have been limited in their effects on treatment outcomes, innovative strategies for treating NSCLC and MM are now being explored, especially those that are molecularly targeted.
The pleckstrin homology-like domain, family A (PHLDA) is a family of genes consisting of 3 members: PHLDA1, PHLDA2, and PHLDA3 (5). The genes in the PHLDA family have a similar organization, involving one coding exon and one noncoding exon separated by a small intron (6). All three genes encode for PH domain-containing proteins. These proteins share high similarity within their PH domains and are detectable using immunohistochemistry screening with variable sensitivity and specificity (5). Cumulative evidence has shown that PHLDA is a family of tumor oncogenes that play important roles in cancer cellular processes, including competing with Akt signaling (7-9), repressing growth factor signaling (10), inhibiting negative feedback of EGFR/ErbB2 signaling cells (8), inducing apoptosis (6), and recent reports suggest the PHLDA3 gene acts as a tumor suppressor in human neuroendocrine tumors (11,12).
Thus, the current study seeks to support the clinical value of PHLDA genes as potential agnostic biomarkers and to point at new targetable therapeutic pathways for patients with NSCLC and MM. We comprehensively analyzed the expression patterns of PHLDA family genes and their prognostic value in LUAD and MM using in silico data-mining investigation methods combined with clinical immunohistochemistry on tissue microarrays.
We present the following article in accordance with the REMARK reporting checklist (available at http://dx.doi.org/10.21037/jtd-20-2909).
Methods
PHLDA mRNA expression
We used UALCAN (RRID:SCR_015827), a user-friendly web resource for analyzing data from The Cancer Genome Atlas (TCGA; RRID:SCR_003193) (13), to investigate the relative mRNA expression of PHLDA family genes in lung adenocarcinoma (LUAD) and normal samples. The mRNA expression level of PHLDA genes was normalized to transcript per million reads, and only a P value of no more than 0.01, according to a Student’s t-test, was to be significant. We selected the Genomic Spatial Event (GSE) database (14) and GSE51024 (15) downloaded from NCBI GEO to analyze the mRNA expression of PHLDA family genes in MM and normal tissues according to adjusted P<0.01 and having |log FC| >2 as the threshold. The Oncomine database (RRID:SCR_007834), the world’s largest cancer microarray database and web-based data mining platform for extracting cancer gene information (16,17), was then used to determine the differences in the mRNA expression of each PHLDA family member between different cancer specimens and normal controls. The P value for these differences in expression was established through a Student’s t-test. We set the threshold at 2.0-fold change, P=0.05, and top 10% gene rank.
The prognostic significance value of the mRNA expression of PHLDA genes in NSCLC was evaluated using the Kaplan-Meier plotter database (RRID:SCR_018753) (18). Only validated probes were used to access the overall survival (OS), first progression (FPS), and post-progression survival (PPS) curves. Patient samples were divided into two cohorts, according to the median expression of each gene (high vs. low expression). The effects of different patterns of PHLDA expression on OS were estimated through univariate and multivariate Cox proportional hazards models, with or without adjustments for confounding factors. Variables including gender, TNM stage, and age were further adjusted during the evaluation. The Kaplan-Meier plotter database calculated the log-rank P value and hazard ratio (HR) with 95% confidence intervals (CI). P<0.05 was considered significant. The UCSC Xena (RRID:SCR_018938) (19) browser (http://xena.ucsc.edu/) was used to analyze OS in Mesothelioma (TCGA, Firehose Legacy) data.
Interaction networks
We searched within the Comparative Toxicogenomics Database (CTD; RRID: SCR_006530) (20) for PHLDA genes in cases employing drugs or chemicals that could decrease/increase their mRNA or protein expression and used this data to create a PHLDA-drug interaction network. This network was then generated using Cytoscape (RRID:SCR_003032) (21). Finally, we used the Search Tool for the Retrieval of Interacting Genes/Proteins (STRING; RRID:SCR_005223) database (22) to explore the protein-protein interaction (PPI) between PHLDA family members.
PHLDA protein expression
Tissue samples
Specimens were obtained from archived formalin-fixed paraffin-embedded (FFPE) histological sections of 102 primary tumors from patients with stage I–IV who had been treated at Clinicas Hospital of University of São Paulo Medical School (HC-FMUSP), the Heart Institute (InCor) and São Paulo Cancer Institute (ICESP) between 1995 and 2018. Their histologic diagnoses were reviewed and confirmed by two pathologists who specialize in lung cancer. The study included 41 LUAD and 61 MM (epithelioid and sarcomatoid histotypes), placed in tissue microarrays (TMAs), none of which had received neoadjuvant therapy. Each TMA was constructed from the primary resected tumors using three 1.5 mm tissue cores obtained from the center, middle, and periphery of the most representative tumor areas that were selected and marked on hematoxylin-eosin (HE) stained slides. Normal liver and kidney tissues were used for control and slide orientation purposes. The previous histological assessment of each analysis area was performed to ensure that the tumor tissue (at least 85% malignant cells) was included in the selected intratumoral region. Twelve slides containing 1,197 tumor cores were evaluated.
The Internal Ethics Committees of all participant institutions approved this study protocol.
Immunohistochemistry analysis
Firstly, the immunostains were tested on 10 whole tissue sections and 18 TMA to ensure that the stain was evenly and not patchy. Four-micron-thick sequential whole tissue sections and TMA sections were stained with immunoperoxidase. The staining was performed with antibodies against PHLDA1 (sc6142, clone M-20, dilution 1:100; Santa Cruz Biotechnology, Santa Cruz, CA, EUA; RRID:AB_2163292), PHLDA2 (polyclonal antibody, CAT#: TA344404, dilution 1:50; Origene, OriGene Technologies, Rockville, USA), PHLDA3 (polyclonal antibody, CAT#: TA315261, dilution 1:100; Origene, OriGene Technologies, Rockville, USA) and tumor suppressor P53 (clone 318-6-11, dilution 1:200; DAKO, Via Real Carpinteria, CA, USA). Cell expression of all markers was detected using a Novocastra Bond Polymer Refine Detection kit (Leica Microsystems) with a diaminobenzidine reaction to detect antibodies labeling and hematoxylin counterstaining. For PHLDAs expression, cytoplasmic with perinuclear accentuation and dots patterns were considered positive. Nuclear expression was considered positive for P53.
Immunohistochemical staining for the PHLDAs family showed homogeneous cytoplasmic staining with perinuclear accentuation and cytoplasmic staining in dots in all 10 MM and 18 LUAD whole mount slides and tumor cores. In addition, immunohistochemical staining for PHLDA family antibodies showed homogeneous cytoplasmic staining with perinuclear accentuation and cytoplasmic staining in dots in 40 (40%) MM and 60 (60%) LUAD tumor cores (Figure S1).
Image analysis quantification
To measure the IHC expression of each different marker and quantify protein expression, the TMA slides were digitally scanned at ×40 magnification using a Panoramic 250 whole slide scanner (3DHistech, Budapest, Hungary). The stained TMA sections were disarrayed within QuPath version 0.2.0-m429, 30 (Centre for Cancer Research & Cell Biology, University of Edinburgh, Edinburgh, Scotland; RRID:SCR_018257), an open-source image analysis platform. All cores were evaluated during the scoring process to manually exclude invalid cores (less than 10% of tumor per core or artefacts).
The TMAs were quantified on QuPath using a simple automated, semi-assisted method. First, each scanned TMA slide underwent a series of automated evaluations, starting with a staining vector analysis, followed by total tissue area detection, tumor separation from non-tumor areas, and cellular detection. Next, we established the threshold of positivity for each one of our four markers through trial and error, and positive cells were submitted to validation by an expert pathologist before being applied to the full array. QuPath then exported the result of this analysis as the number of positive cells per mm2 of tissue.
Based on each marker’s threshold of positivity, we generated a script used to automatically detect positive and negative cells in each slide and export the results in image format be validated by a pathologist who was blind to patient outcome. A membrane and cytoplasmic algorithm quantified PHLDA immunohistochemical expression, whereas a nuclear algorithm quantified P53 expression. The average number of positive nuclei was expressed as positive cell density per mm2 and used as the median value to which specific samples were compared. We refer to low expression as positive cell density equal or below the median expression level, and high expression as positive cell density above this median.
Clinical data and outcome
Clinical data of MM and LUAD patients was derived from an existing prospectively maintained database. Patient and tumor characteristics were retrospectively collected including age, sex, smoking history, tumor size, tumor stage (1,23,24), and follow-up information for OS rates (Table 1). OS served as the primary outcome and was defined as the interval from surgery to death or last contact. Secondary outcomes included associations with clinicopathological factors.
Table 1. Frequency of clinicopathologic characteristics of the patients included in the study.
| Characteristic | Lung adenocarcinoma (N=41) | Malignant mesothelioma (N=61) |
|---|---|---|
| Age (years), median | 65 | 59 |
| Sex, n (%)a | ||
| Female | 17 (41.5) | 18 (29.5) |
| Male | 22 (53.7) | 43 (70.5) |
| Tumor stage†, n (%) | ||
| I | 17 (41.5) | – |
| II | 14 (34.1) | – |
| III | 5 (12.2) | – |
| IV | 5 (12.2) | 61 (100.0) |
| Nodal status†, n (%)b | ||
| N0 | 21 (51.2) | – |
| N1 | 15 (36.6) | – |
| Status, n (%) | ||
| Death | 26 (63.4) | 36 (59.0) |
Statistical analysis
According to protocols of the tools employed in the in silico analyses, the mRNA levels of PHLDA in NSCLC, MM, and normal tissues were analyzed in each individual dataset using the Student’s t-test and the patients’ OS distribution was estimated using the Kaplan-Meier method. A log-rank test was performed to determine the difference in survival between the groups. For the clinical data, either the Chi-square test or the Fisher exact test was used to examine differences in categorical clinical variables, and the Wilcoxon rank-sum test and Kruskal-Wallis test were used to detect differences in continuous immunohistochemistry variables between groups of patients. A regression analysis of the risk of death (OR) was performed using univariate and multivariate Cox proportional hazards models. The criteria to include the variables in multivariate analysis was: (I) using the P value obtained in Cox’s univariate analysis, or (II) using classically accepted criteria with impact on the risk of death and OS, namely staging and histological types, as co-dependent variables of the significant variables obtained in the univariate analysis. If no statistical differences were found for any clinicopathologic and immunohistochemistry variables, multivariate analysis will be performed to determine if the immunohistochemistry variables would depend on the control of the model (co-dependency) by the classically accepted variables with an impact on the risk of death and OS, such as staging and histological types.
The statistical software programs IBM SPSS (version 22; Armonk, NY, USA; RRID:SCR_002865) and S-Plus (version 8.04; TIBCO, Palo Alto, CA, USA) were used to perform the computations for all analyses. P value <0.05 was considered significant.
Ethical statement
The study was conducted in accordance with the Declaration of Helsinki (as revised in 2013). The study was approved by the national ethics committee of nº 3.729.622 and individual consent for this retrospective analysis was waived.
Results
In silico data mining
PHLDA mRNA expression
The UALCAN analysis showed that PHLDA1, PHLDA2, and PHLDA3 mRNA expression levels were statistically significant in LUAD samples compared to normal tissues (P<0.01, P<0.01, and P=0.03, respectively; Figure 1A,B,C). There was a significant correlation between LUAD squamoid alveolar lineage type and PHLDA1 (P=0.02), PHLDA2 (P<0.01), and PHLDA3 (P<0.01) genes. No statistical differences were found for the other parameters (Table 2).
Figure 1.

The relative expression of pleckstrin homology domain family A (PHLDA) genes in normal and lung adenocarcinoma (LUAD) tissues according to The Cancer Genome Atlas (TCGA) datasets and the relative expression of PHLDA genes in normal and malignant mesothelioma (MM) tissues according to GSE51024 raw data. (A) PHLDA1, (B) PHLDA2, and (C) PHLDA3 in LUAD subtype tissue, (D) PHLDA1, (E) PHLDA2, and (F) PHLDA3 in MM tissue. (A) All PHLDA genes were highly expressed in LUAD when compared to normal tissue. (D) PHLDA1 gene expression in MM was lower than in normal tissue; (F) PHLDA3 gene expression was significantly higher than in normal tissue; (E) no statistical difference was found for PHLDA2 expression between MM and normal samples.
Table 2. Clinicopathological characteristics of the patients with lung cancer from TCGA database (Chi-square test; P value<0.05).
| Parameters | PHLDA1 | PHLDA2 | PHLDA3 | |||||||||||||||||
|---|---|---|---|---|---|---|---|---|---|---|---|---|---|---|---|---|---|---|---|---|
| High | Low | P value | High | Low | P value | High | Low | P value | ||||||||||||
| N | % | N | % | N | % | N | % | N | % | N | % | |||||||||
| Age | 0.23 | 0.34 | 0.44 | |||||||||||||||||
| ≤50 years | 15 | 5.8 | 22 | 8.5 | 21 | 8.1 | 16 | 6.2 | 21 | 8.1 | 16 | 6.2 | ||||||||
| >50 years | 234 | 90.7 | 227 | 87.6 | 224 | 86.8 | 237 | 91.5 | 231 | 89.5 | 230 | 88.8 | ||||||||
| NA | 9 | 3.5 | 10 | 3.9 | 13 | 5.0 | 6 | 2.3 | 6 | 2.3 | 13 | 5.0 | ||||||||
| Sex | 0.76 | 0.06 | 0.23 | |||||||||||||||||
| Female | 140 | 54.3 | 137 | 52.9 | 149 | 57.8 | 128 | 49.4 | 145 | 56.2 | 132 | 51.0 | ||||||||
| Male | 118 | 45.7 | 122 | 47.1 | 109 | 42.2 | 131 | 50.6 | 113 | 43.8 | 127 | 49.0 | ||||||||
| Race Category | 0.88 | 0.44 | 0.19 | |||||||||||||||||
| American Indian or Alaska native | 1 | 0.4 | 0 | 0.0 | 1 | 0.4 | 0 | 0.0 | 1 | 0.4 | 0 | 0.0 | ||||||||
| Asian | 4 | 1.6 | 4 | 1.5 | 3 | 1.2 | 5 | 1.9 | 2 | 0.8 | 6 | 2.3 | ||||||||
| Black or African American | 24 | 9.3 | 29 | 11.2 | 30 | 11.6 | 23 | 8.9 | 31 | 12.0 | 22 | 8.5 | ||||||||
| White | 194 | 75.2 | 195 | 75.3 | 187 | 72.5 | 202 | 78.0 | 196 | 76.0 | 193 | 74.5 | ||||||||
| NA | 35 | 13.6 | 31 | 12.0 | 37 | 14.3 | 29 | 11.2 | 28 | 10.9 | 38 | 14.7 | ||||||||
| Patient smoking | 0.07 | 0.40 | 0.36 | |||||||||||||||||
| Non smoker | 28 | 10.9 | 48 | 18.5 | 42 | 16.3 | 34 | 13.1 | 40 | 15.5 | 36 | 13.9 | ||||||||
| Reformed smoker (≤15 years) | 91 | 35.3 | 78 | 30.1 | 88 | 34.1 | 81 | 31.3 | 82 | 31.8 | 87 | 33.6 | ||||||||
| Reformed smoker (>15 years) | 72 | 27.9 | 63 | 24.3 | 62 | 24.0 | 73 | 28.2 | 72 | 27.9 | 63 | 24.3 | ||||||||
| Smoker | 56 | 21.7 | 63 | 24.3 | 54 | 20.9 | 65 | 25.1 | 51 | 19.8 | 68 | 26.3 | ||||||||
| NA | 11 | 4.3 | 7 | 2.7 | 12 | 4.7 | 6 | 2.3 | 13 | 5.0 | 5 | 1.9 | ||||||||
| Stage | 0.11 | 0.47 | 0.14 | |||||||||||||||||
| I/II | 205 | 79.5 | 194 | 74.9 | 195 | 75.6 | 204 | 78.8 | 206 | 79.8 | 193 | 74.5 | ||||||||
| III/IV | 47 | 18.2 | 63 | 24.3 | 58 | 22.5 | 52 | 20.1 | 48 | 18.6 | 62 | 23.9 | ||||||||
| NA | 6 | 2.3 | 2 | 0.8 | 5 | 1.9 | 3 | 1.2 | 4 | 1.6 | 4 | 1.5 | ||||||||
| ALK translocation status | 0.45 | 0.18 | 0.58 | |||||||||||||||||
| No | 106 | 41.1 | 105 | 40.5 | 107 | 41.5 | 104 | 40.2 | 113 | 43.8 | 98 | 37.8 | ||||||||
| Yes | 20 | 7.8 | 15 | 5.8 | 22 | 8.5 | 13 | 5.0 | 17 | 6.6 | 18 | 6.9 | ||||||||
| NA | 132 | 51.2 | 139 | 53.7 | 129 | 50.0 | 142 | 54.8 | 128 | 49.6 | 143 | 55.2 | ||||||||
| KRAS mutation | 0.13 | 0.87 | 0.87 | |||||||||||||||||
| No | 20 | 7.8 | 20 | 7.7 | 20 | 7.8 | 20 | 7.7 | 20 | 7.8 | 20 | 7.7 | ||||||||
| Yes | 16 | 6.2 | 7 | 2.7 | 11 | 4.3 | 12 | 4.6 | 12 | 4.7 | 11 | 4.2 | ||||||||
| NA | 222 | 86.0 | 232 | 89.6 | 227 | 88.0 | 227 | 87.6 | 226 | 87.6 | 228 | 88.0 | ||||||||
| Expression subtype† | 0.02 | <0.01 | <0.01 | |||||||||||||||||
| Bronchioid | 48 | 18.6 | 41 | 15.8 | 36 | 14.0 | 53 | 20.5 | 56 | 21.7 | 33 | 12.7 | ||||||||
| Magnoid | 25 | 9.7 | 38 | 14.7 | 20 | 7.8 | 43 | 16.6 | 19 | 7.4 | 44 | 17.0 | ||||||||
| Squamoid | 49 | 19.0 | 29 | 11.2 | 60 | 23.3 | 18 | 6.9 | 43 | 16.7 | 35 | 13.5 | ||||||||
| NA | 136 | 52.7 | 151 | 58.3 | 142 | 55.0 | 145 | 56.0 | 140 | 54.3 | 147 | 56.8 | ||||||||
†, according to Song et al. [2018] (25). PHLDA, pleckstrin homology domain family A; NA, not available.
The GSE51024 raw data on MM showed that PHLDA1 mRNA expression was lower than that of normal tissue (P=0.01), PHLDA2 expression was not statistically significant (P=0.13), and PHLDA3 expression was significantly increased compared to normal samples (P<0.01) (Figure 1D,E,F). Lower PHLDA3 mRNA expression was associated with lymph node status (P=0.02), tumor size (P=0.01), and TP53 mutational status (P<0.01). No correlation was found between PHLDA1 and PHLDA2 expression and clinicopathological characteristics (Table 3).
Table 3. Clinicopathological characteristics of the patients with malignant mesothelioma from TCGA database (Chi-square test; P value <0.05).
| Parameters | PHLDA1 | PHLDA2 | PHLDA3 | |||||||||||||||||
|---|---|---|---|---|---|---|---|---|---|---|---|---|---|---|---|---|---|---|---|---|
| High | Low | P value | High | Low | P value | High | Low | P value | ||||||||||||
| N | % | N | % | N | % | N | % | N | % | N | % | |||||||||
| Age | 0.23 | 0.05 | 0.05 | |||||||||||||||||
| ≤50 years | 2 | 4.7 | 5 | 11.4 | 6 | 14.0 | 1 | 2.3 | 6 | 14.0 | 1 | 2.3 | ||||||||
| >50 years | 41 | 95.3 | 39 | 88.6 | 37 | 86.0 | 43 | 97.7 | 37 | 86.0 | 43 | 97.7 | ||||||||
| Race category | 1.00 | 1.00 | 1.00 | |||||||||||||||||
| Asian | 1 | 2.3 | 0 | 0.0 | 0 | 0.0 | 1 | 2.3 | 1 | 2.3 | 0 | 0.0 | ||||||||
| Black or African American | 0 | 0.0 | 1 | 2.3 | 0 | 0.0 | 1 | 2.3 | 0 | 0.0 | 1 | 2.3 | ||||||||
| White | 42 | 97.7 | 43 | 97.7 | 43 | 100.0 | 42 | 95.5 | 42 | 97.7 | 43 | 97.7 | ||||||||
| Gender | 0.29 | 0.61 | 0.09 | |||||||||||||||||
| Female | 6 | 14.0 | 10 | 22.7 | 7 | 16.3 | 9 | 20.5 | 11 | 25.6 | 5 | 11.4 | ||||||||
| Male | 37 | 86.0 | 34 | 77.3 | 36 | 83.7 | 35 | 79.5 | 32 | 74.4 | 39 | 88.6 | ||||||||
| Tumor size | 0.72 | 0.60 | 0.01 | |||||||||||||||||
| 1 | 7 | 16.3 | 7 | 15.9 | 6 | 14.0 | 8 | 18.2 | 3 | 7.0 | 11 | 25.0 | ||||||||
| 2 | 12 | 27.9 | 14 | 31.8 | 16 | 37.2 | 10 | 22.7 | 18 | 41.9 | 8 | 18.2 | ||||||||
| 3 | 18 | 41.9 | 14 | 31.8 | 15 | 34.9 | 17 | 38.6 | 18 | 41.9 | 14 | 31.8 | ||||||||
| 4 | 5 | 11.6 | 8 | 18.2 | 6 | 14.0 | 7 | 15.9 | 4 | 9.3 | 9 | 20.5 | ||||||||
| TX | 1 | 2.3 | 1 | 2.3 | 0 | 0.0 | 2 | 4.5 | 0 | 0.0 | 2 | 4.5 | ||||||||
| Lymph node status | 0.73 | 0.06 | 0.02 | |||||||||||||||||
| Negative | 22 | 51.2 | 22 | 50.0 | 25 | 58.1 | 19 | 43.2 | 27 | 62.8 | 17 | 38.6 | ||||||||
| Positive | 18 | 41.9 | 21 | 47.7 | 14 | 32.6 | 25 | 56.8 | 14 | 32.6 | 25 | 56.8 | ||||||||
| NX | 3 | 7.0 | 1 | 2.3 | 4 | 9.3 | 0 | 0.0 | 2 | 4.7 | 2 | 4.5 | ||||||||
| Metastasis status | 0.55 | 0.47 | 0.63 | |||||||||||||||||
| Negative | 27 | 62.8 | 30 | 68.2 | 27 | 62.8 | 30 | 68.2 | 33 | 76.7 | 24 | 54.5 | ||||||||
| Positive | 1 | 2.3 | 2 | 4.5 | 2 | 4.7 | 1 | 2.3 | 2 | 4.7 | 1 | 2.3 | ||||||||
| MX | 15 | 34.9 | 12 | 27.3 | 14 | 32.6 | 13 | 29.5 | 8 | 18.6 | 19 | 43.2 | ||||||||
| Stage | 0.61 | 0.53 | 0.05 | |||||||||||||||||
| I | 6 | 14.0 | 4 | 9.1 | 6 | 14.0 | 4 | 9.1 | 3 | 7.0 | 7 | 15.9 | ||||||||
| II | 6 | 14.0 | 10 | 22.7 | 10 | 23.3 | 6 | 13.6 | 12 | 27.9 | 4 | 9.1 | ||||||||
| III | 24 | 55.8 | 21 | 47.7 | 20 | 46.5 | 25 | 56.8 | 23 | 53.5 | 22 | 50.0 | ||||||||
| IV | 7 | 16.3 | 9 | 20.5 | 7 | 16.3 | 9 | 20.5 | 5 | 11.6 | 11 | 25.0 | ||||||||
| TP53 status | 0.39 | 0.73 | <0.01 | |||||||||||||||||
| Wild type | 38 | 88.4 | 36 | 81.8 | 36 | 83.7 | 38 | 86.4 | 41 | 95.3 | 33 | 75.0 | ||||||||
| Mutated | 5 | 11.6 | 8 | 18.2 | 7 | 16.3 | 6 | 13.6 | 2 | 4.7 | 11 | 25.0 | ||||||||
PHLDA, pleckstrin homology domain family A.
To further validate and cross-examine the observations made in the TCGA and GEO databases, the Oncomine data was used to evaluate the differential mRNA levels of the PHLDA genes in both LUAD and MM. The mRNA expression levels of PHLDA1, PHLDA2, and PHLDA3 were collected from 457, 436, and 360 different types of tumor studies, respectively (Figure S2). Of these, 90 studies showed a statistical difference for the PHLDA1 gene, 56 for the PHLDA2 gene, and 6 for the PHLDA3 gene. From these data groups, we selected three datasets: Hou Lung (203476_at), Selamat Lung (ILMN_1687978), and Su Lung (217996_at) to investigate the expression of these genes in LUAD histotype and normal tissues (Figure S3).
The Hou Lung and Selamat datasets showed no significant difference in the expression of PHLDA1 mRNA (fold change =1.18 and −1.03) (Figure S3A,B). However, the Su dataset indicated a trend for PHLDA1 mRNA under-expression in LUAD (fold change =−1.71) (Figure S3C). In all three databases, PHLDA2 mRNA was overexpressed (fold change =2.21, 2.39, and 3.63, respectively) in LUAD compared to normal tissue (Figure S3D,E,F). Conversely, none of the datasets showed changes in the mRNA levels of PHLDA3 (fold change =−1.14, 1.29, and 1.03, respectively) (Figure S3G,H,I). Finally, the Gordon Mesothelioma dataset was used to assess PHLDA mRNA expression in MM (Figure S4), and neither PHLDA1 nor PHLDA3 mRNA showed a significantly different expression in tumor tissue compared to normal tissue (fold change =−1.09 and 1.25, respectively) (Figure S4A,C). PHLDA2, however, trended toward under-expression in MM (fold change =−1.92) (Figure S4B).
Prognostic significance of PHLDA mRNA expression
A Kaplan–Meier plotter analysis was used to find the correlation between PHLDA mRNA levels and OS, FPS, and PPS in NSCLC patients (Figure 2). Low PHLDA1 mRNA expression was correlated with worse OS (HR=0.77; 95% CI: 0.63–0.94; P<0.01; Figure 2A), FPS (HR =0.66; 95% CI: 0.47–0.93; P=0.02; Figure 2D), and PPS (HR =0.43; 95% CI: 0.26–0.72; P<0.01, Figure 2G); whereas high PHLDA2 mRNA expression was significantly associated with better OS (HR =0.84; 95% CI: 0.74–0.96; P<0.01; Figure 2B), though not with FPS (HR =1.14; 95% CI: 0.92–1.40; P=0.24; Figure 2E) or PPS (HR =0.82; CI: 0.62–1.08; P=0.16; Figure 2H). Finally, patients with high PHLDA3 mRNA expression had poor OS (HR =1.25; 95% CI: 1.1–1.42; P<0.01; Figure 2C), FPS (HR =1.78; 95% CI: 1.41–2.24; P<0.01; Figure 2F), and PPS (HR =1.37; 95% CI: 1.02–1.83; P=0.03; Figure 2I).
Figure 2.

This Kaplan Meier survival curve shows the correlation between pleckstrin homology domain family A (PHLDA) genes expression and overall survival (OS), first progression survival (FPS) and post progression survival (PPS) in lung cancer patients. (A) Low expression of the PHLDA1 gene was correlated with worse OS (HR =0.77, 95% CI: 0.63–0.94; P<0.01); (B) high expression of the PHLDA2 gene was significantly associated with better OS (HR =0.84, 95% CI: 0.74–0.96; P<0.01); (C) high expression of the PHLDA3 gene also correlated with worse OS (HR =1.25, 95% CI: 1.1–1.42; P<0.01); (D) low expression of the PHLDA1 gene showed a significant correlation with worse FPS (HR =0.66, 95% CI: 0.47–0.93; P=0.02); (E) PHLDA2 gene expression was not statistically significant on FPS (HR =1.14, 95% CI: 0.92–1.40; P=0.24); (F) high expression of the PHLDA3 gene was significantly correlated with worse FPS (HR =1.78, 95% CI: 1.41–2.24; P<0.01); (G) low expression of the PHLDA1 gene showed a significant correlation with worse PPS (HR =0.43, 95% CI: 0.26–0.72; P<0.01); (H) PHLDA2 gene expression was not statistically significant on PPS (HR =0.82, 95% CI: 0.62–1.08; P=0.16); (I) high expression of the PHLDA3 gene was significantly correlated with worse PPS (HR =1.37, 95% CI: 1.02–1.83; P=0.03).
Next, we correlated OS with clinicopathological data (Figure S5). Low PHLDA1 mRNA expression was significantly related to worse survival in male patients (HR =0.56; 95% CI: 0.37–0.86; P<0.01), female patients (HR =0.52; 95% CI: 0.34–0.77; P<0.01) and smokers (HR =0.37; 95% CI: 0.2–0.67; P<0.01) (Figure S5A,B,D); high PHLDA2 mRNA expression was significantly related to poor survival in male patients (HR =1.52; 95% CI: 1.08–2.14; P=0.01) and in non-smokers (HR =4.42; 95% CI: 1.83–10.67, P<0.01) (Figure S5E,G); and high PHLDA3 mRNA expression was correlated with short survival in male patients (HR =1.46; 95% CI: 1.01–2.11; P=0.04), female patients (HR =1.86; 95% CI: 1.24–2.8; P<0.01), non-smokers (HR =2.82; 95% CI: 1.26–6.3, P<0.01), and smokers (HR =1.83; 95% CI: 1.13–2.95; P=0.01) (Figure S5I,J,K,L).
The Kaplan-Meier curves in MM (n=87 samples) were generated using Mesothelioma (TCGA, Firehose Legacy) data from the UCSC Xena tool (Table S1). While patients with MM presenting high PHLDA1 and PHLDA2 mRNA expression had poor OS (HR =1.80; 95% CI: 1.1–2.9; P=0.01, and HR =1.87; 95% CI: 1.2–3.0; P<0.01, respectively; Figure 3A,B), their PHLDA3 mRNA expression showed no correlation with survival (HR =1.29; 95% CI: 0.8–2.1; P=0.27; Figure 3C). A multivariate Cox analysis that controlled for age, sex, lymph node metastases, stage, and TP53 confirmed that PHLDA1 and PHLDA2 mRNA expression were independent predictors of worse OS (HR =1.64; 95% CI: 1.0–2.6; P=0.04 and HR =1.71, 95% CI: 1.1–2.7; P=0.03; Table S1).
Figure 3.
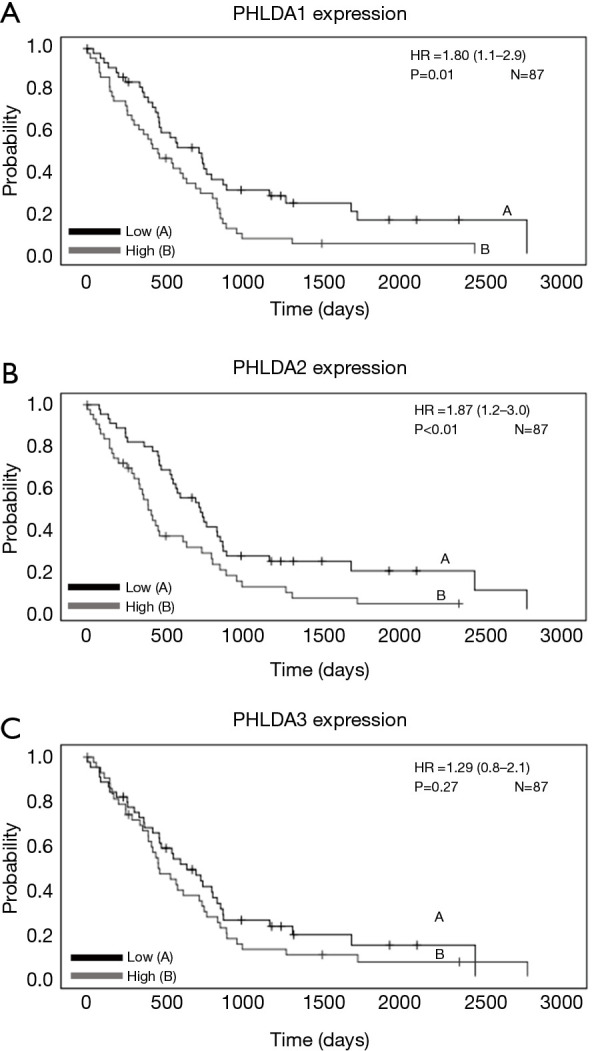
This Kaplan Meier survival curve shows the correlation between pleckstrin homology domain family A (PHLDA) genes expression and overall survival (OS) in malignant mesothelioma patients according to the The Cancer Genome Atlas (TCGA) Firehose Legacy datasets. (A) High expression of the PHLDA1 (HR=1.80, 95% CI: 1.1–2.9; P=0.01) and (B) PHLDA2 (HR=1.87, 95% CI: 1.2–3.0; P<0.01) genes was significant correlated with worse OS; (C) PHLDA3 gene expression was not correlated with survival (HR =1.29, 95% CI: 0.8–2.1; P=0.27).
Interaction network
We used the Comparative Toxicogenomics Database to investigate the possibility of interaction and modulation between PHLDA genes and potential chemical drugs. Our PHLDA–drug interaction network indicated that a number of commonly used drugs could modulate the mRNA or protein expression of PHLDA. Specifically, chemotherapy agents, including cisplatin, potentially decrease PHLDA1 levels; whereas carcinogenic substances, such as tetrachlorodibenzodioxin, were able to increase the expression of all PHLDA family members (Figure 4).
Figure 4.

The PHLDA-drug interaction network obtained from the Comparative Toxicogenomics Database. (A) PHLDA1-drug interaction network; (B) PHLDA2-drug interaction network; (C) PHLDA3-drug interaction network. This network shows that several common drugs could potentially modulate the mRNA or protein expression of PHLDA. PHLDA, pleckstrin homology domain family A.
Figure 5 shows the significant PHLDA-PPI network that was designed using the STRING database. Its molecular organization can be visualized as a network of differentially connected nodes. Each node stands for a protein and its edges represent dynamic interactions. The PHLDA1-PPI network had 31 nodes and 100 edges (P=2.06e-08), and its most significant biological processes and pathways were associated with positive regulation of the transcription of both the Notch receptor target (GO:0007221; Purple color) and Notch signaling pathway (GO:0007219; Red color) (Figure 5A). The PHLDA2-PPI network had 11 nodes and 40 edges (P=1.42e-12) and was related to the activity of cyclin-dependent protein serine/threonine kinase (GO:0004693; Red color) and the p53 signaling pathway (hsa04115; Purple color) (Figure 5B). Finally, the PHLDA3-PPI network had 21 nodes and 82 edges (P=8.31e-12) and was mainly associated with signal transduction by p53 class mediator (Figure 5C).
Figure 5.

Cluster analysis of the PPI network. (A) PHLDA1-PPI network. (B) PHLDA2-PPI network, and (C) PHLDA3-PPI network. PHLDA, pleckstrin homology domain family A; PPI, protein-protein interaction.
Taken together, the above in silico results suggest that the PHLDA genes may be reliable prognostic indicators for malignant thoracic tumors, including MM and NSCLC.
PHLDA protein expression
Protein expression and histotypes
PHLDA protein expression was assessed using immunohistochemistry on tissue microarrays (TMAs) in a well-characterized cohort of 41 LUAD and 61 MM. Figure 6 brings representative images of LUAD and MM stained by HE (Figure 6A,B), and subjected to immunohistochemistry for PHLDA1 (Figure 6C,D), PHLDA2 (Figure 6E,F), PHLDA3 (Figure 6G,H) and P53 (Figure 6I,J). The PHLDA1 staining created a cytoplasmic expression in dots pattern in mild number of MM and LUAD malignant cells (Figure 6C,D). In contrast, the PHLDA2 staining showed strong and diffuse expression in cytoplasm with perinuclear accentuation in numerous MM cells (Figure 6E), while a mild number of LUAD cells showed a predominance of cytoplasmic dots pattern (Figure 6F). Regarding PHLDA3 staining, a mild and diffuse cytoplasmic expression in numerous MM cells (Figure 6G), comparing to the cytoplasmic with perinuclear accentation expression in mild number of LUAD (Figure 6H). TP53 staining was predominantly found in LUAD (Figure 6J), and almost absent in MM (Figure 6I).
Figure 6.

PHLDA protein expression using immunohistochemistry on tissue microarrays (TMAs) in MM and LUAD. H&E staining of an epithelioid MM section/showing blocks of epithelioid cells infiltrating sparse desmoplasic stroma (A); H&E staining of a representative solid subtype LUAD composed of cohesive and poor differentiated malignant cells, aggregated in blocks and immersed in exuberant desmoplasic stroma (B). Immunohistochemistry: PHLDA1 staining of mild number of epithelioid MM cells (arrows, C) and LUAD cells (arrows, D); PHLDA2 with strong and diffuse cytoplasmic staining with perinuclear accentuation in numerous MM malignant cells (arrows, E), contrasting with diffuse cytoplasmic staining in a mild number of LUAD malignant cells (arrows, F); PHLDA3 with diffuse cytoplasmic expression in MM malignant cells (arrows, G), and cytoplasmic staining with perinuclear accentuation in a mild number of LUAD malignant cells (arrows, H); strong and diffuse P53 nuclear staining in LUAD (arrows, J) and weak, almost absent, in MM (I). PHLDA, pleckstrin homology domain family A; H&E, hematoxylin & eosin; LUAD, lung adenocarcinoma; MM, malignant mesothelioma.
Table 4 shows the protein expression frequency of PHLDAs and P53 in 41 LUAD and 61 MM samples. The expression of PHLDA2 and PHLDA3 was significantly higher in LUAD (median 88.16 cells/mm2 and 84.90 cells/mm2, respectively) than in MM (median 79.51 cells/mm2 and 67.80 cells/mm2 respectively). PHLDA1 expression was not statistically significant (P=0.37). 23 cases of LUAD (56.1%) and 31 cases of MM (50.8%) presented values above the median expression of PHLDA1 (P=0.49). For PHLDA2 protein expression, 26 cases (63.4%) of LUAD and 28 cases (45.9%) of MM showed higher cell density than the median (P=0.02), and the PHLDA3 protein was expressed above the median in 33 cases (80.5%) of LUAD, and 27 cases (44.3%) of MM (P<0.01).
Table 4. Median densities of PHLDAs and TP53 according to histological type (N=102) (Mann-Whitney test; P value <0.05).
| Protein (cells/mm2) | Malignant mesothelioma | Lung adenocarcinoma | P value | |||
|---|---|---|---|---|---|---|
| Mean | Median | Mean | Median | |||
| PHLDA1 | 52.76 | 51.47 | 55.49 | 56.74 | 0.37 | |
| PHLDA2 | 74.73 | 79.51 | 86.17 | 88.16 | 0.01 | |
| PHLDA3 | 64.99 | 67.80 | 80.71 | 84.90 | <0.01 | |
| TP53 | 2.64 | 1.11 | 239.67 | 48.40 | <0.01 | |
PHLDA, pleckstrin homology domain family A.
Protein expression and clinicopathological parameters
The demographic data and clinicopathological characteristics of the LUAD and MM cohorts were stratified according to PHLDA and P53 expression (Table 5). Specimens from 29 (28.4%) patients with LUAD presented higher expression of PHLDA3 compared to 22 (21.6%) patients with MM (P<0.01). Among patients in clinical stage IV, PHLDA3 expression was lower in 41 patients, and high in 25 patients (P<0.01). A significant correlation was demonstrated among 31 (31.6%) patients with high PHLDA1 expression (P=0.03), high PHLDA2 expression (P=0.01), high PHLDA3 expression (P<0.01) and high P53 protein expression (median expression value of 2.9 cells/mm2). No statistical differences were found for the other parameters.
Table 5. PHLDA and p53 protein expression and clinicopathologic characteristics of the patients with lung cancer and malignant mesothelioma (Chi-square test; P value <0.05).
| Characteristic | PHLDA1 (cell/mm2) | PHLDA2 (cell/mm2) | PHLDA3 (cell/mm2) | ||||||||
|---|---|---|---|---|---|---|---|---|---|---|---|
| Low | High | P value | Low | High | P value | Low | High | P value | |||
| Age (years) | 0.42 | 0.11 | 0.11 | ||||||||
| >61.5 | 27 (27.6%) | 22 (22.4%) | 29 (29.6%) | 20 (20.4%) | 29 (29.6%) | 20 (20.4%) | |||||
| ≤61.5 | 22 (22.4%) | 27 (27.6%) | 20 (20.4%) | 29 (29.6%) | 20 (20.4%) | 29 (29.6%) | |||||
| Sex | 0.09 | 1.0 | 0.09 | ||||||||
| Female | 13 (13.0%) | 22 (22.0%) | 17 (17.0%) | 18 (18.0%) | 13 (13.0%) | 22 (22.0%) | |||||
| Male | 37 (37.0%) | 28 (28.0%) | 33 (33.0%) | 32 (32.0%) | 37 (37.0%) | 28 (28.0%) | |||||
| Tumor type | 0.42 | 0.22 | <0.01 | ||||||||
| LUAD | 18 (17.6%) | 23 (22.5%) | 17 (16.7%) | 24 (23.5%) | 12 (11.8%) | 29 (28.4%) | |||||
| MM | 33 (32.4%) | 28 (27.5%) | 34 (33.3%) | 27 (26.5%) | 39 (38.2%) | 22 (21.6%) | |||||
| Tumor stage† | 0.61 | 0.30 | <0.01 | ||||||||
| I | 7 (7.0%) | 8 (8.0%) | 7 (7.0%) | 8 (8.0%) | 3 (3.0%) | 12 (12.0%) | |||||
| II | 7 (7.0%) | 7 (7.0%) | 5 (5.0%) | 9 (9.0%) | 5 (5.0%) | 9 (9.0%) | |||||
| III | 1 (1.0%) | 4 (4.0%) | 2 (2.0%) | 3 (3.0%) | 1 (1.0%) | 4 (4.0%) | |||||
| IV | 35 (35.0%) | 31 (31.0%) | 36 (36.0%) | 30 (30.0%) | 41 (41.0%) | 25 (25.0%) | |||||
| Statusa | 0.36 | 0.20 | 0.58 | ||||||||
| Alive | 13 (13.3%) | 20 (20.4%) | 12 (12.2%) | 21 (21.4%) | 17 (17.3%) | 16 (16.3%) | |||||
| Dead | 34 (34.7%) | 28 (28.6%) | 35 (35.7%) | 27 (27.6%) | 30 (30.6%) | 32 (32.7%) | |||||
| Overall survival | 0.28 | 0.83 | 0.83 | ||||||||
| >19.9 months | 25 (29.4%) | 18 (21.2%) | 22 (25.9%) | 21 (24.7%) | 22 (25.9%) | 21 (24.7%) | |||||
| ≤19.9 months | 19 (22.4%) | 23 (27.1%) | 20 (23.5%) | 22 (25.9%) | 23 (27.1%) | 19 (22.4%) | |||||
| p53 | 0.03 | 0.01 | <0.01 | ||||||||
| ≤2.9 cell/mm2 | 30 (30.6%) | 19 (19.4%) | 31 (31.6%) | 18 (18.4%) | 32 (3.7%) | 17 (17.3%) | |||||
| >2.9 cell/mm2 | 18 (18.4%) | 31 (31.6%) | 18 (18.4%) | 31 (31.6%) | 18 (18.4%) | 31 (31.6%) | |||||
Correlation between protein expression and clinical outcome
The Cox model analysis of our cohort appears in Table 6. While no statistical differences were found for any clinicopathologic parameters on the risk of death in univariate analysis, a multivariate Cox model analysis demonstrated that LUAD and epithelioid MM histotypes, and overall stage I were significantly related to low risk of death (P=0.02, P=0.01, P=0.01, respectively). For the quantitative tumor staining of PHLDA2 and PHLDA3 staining, multivariate analysis showed a significant association with the risk of death (P=0.01 and P=0.03). Patients that presented PHLDA2 >85.09 cells/mm2 had a low risk of death (HR =0.98; 95% CI: 0.96–0.99; P=0.01) and median survival time of 48 months. In contrast, those with PHLDA3 <70.38 cells/mm2 presented a high risk of death (HR =1.02; 95% CI: 1.00–1.05; P=0.03) and median survival time of 34 months. The multivariate Cox analysis confirmed that LUAD, epithelioid MM, overall stage I, reduced PHLDA2 protein expression, and increased PHLDA3 protein expression are independent risk factors.
Table 6. The univariate and multivariate analysis employed a Cox proportional hazards model.
| Clinicopathological characteristics | Univariate analysisa | Multivariate analysisb | ||||
|---|---|---|---|---|---|---|
| HR (95% CI) | HR | P value | HR (95% CI) | P value | ||
| Age (years) | ||||||
| >65 | ||||||
| ≤65 (reference) | 1.01 (0.99–1.03) | 0.01 | ||||
| Gender | ||||||
| Male | ||||||
| Female (reference) | 0.83 (0.45–1.51) | 0.19 | ||||
| Histologic types | ||||||
| Sarcomatoid MM (reference) | ||||||
| Epithelioid MM | 0.67 (0.35–1.29) | 0.23 | 0.30 | 0.22 (0.03–0.66) | 0.12 | |
| LUAD | 0.75 (0.44–1.29) | 0.28 | 0.30 | 0.17 (0.04–0.76) | 0.02 | |
| Overall stage | ||||||
| I | 0.50 | 0.01 | ||||
| II | 0.76 (0.34–1.71) | 0.28 | 0.14 | 0.13 (0.02–0.65) | 0.13 | |
| III | 1.68 (0.85–3.32) | 0.52 | 0.41 | 0.33 (0.08–1.36) | 0.05 | |
| IV (reference) | 0.43 (0.06–3.15) | 0.84 | 0.26 | 0.08 (0.01–1.01) | 0.06 | |
| PHLDAS and p53 (≤ median vs. > median) | ||||||
| PHLDA1+ cells/mm2 | ||||||
| >51.230 | 1.27 (0.74–2.17) | 0.24 | 0.38 | 0.99 (1.00–1.01) | 0.58 | |
| PHLDA2+cells/mm2 | ||||||
| >85.09 | 1.25 (0.73–2.14) | 0.23 | 0.40 | 0.98 (0.96–0.99) | 0.01 | |
| PHLDA3+cells/mm2 | ||||||
| <70.38 | 0.90 (0.57–1.69) | 0.01 | 0.96 | 1.02 (1.00–1.05) | 0.03 | |
| P53+cells/mm2 | ||||||
| >2.87 | 1.13 (0.65–1.96) | 0.12 | 0.66 | 1.00 (1.00–1.00) | 0.38 | |
a, univariate analysis was carried out without any adjustment in order to generate hazard ratios with confidence intervals for individual risk for each of the parameters on survival; b, multivariate analysis was carried out to analyze the effects of several risk parameters on survival. PHLDA, pleckstrin homology domain family A; HR, hazard ratio (β coefficient); CI, confidence interval; MM, malignant mesothelioma; LUAD, lung adenocarcinoma.
Discussion
Based on our previous studies, we found that the PHLDA family acts as an immediate target downstream of the EGFR/ErbB2 signaling pathway in breast cancer (6,26,27). Moreover, due to the fact that PHLDA genes are activated in various cancer types, the PHLDA family members have been increasingly perceived as promising targets for therapies against cancers (28). However, their detailed expression patterns, prognostic value, potential function, and drug interaction network in NSCLC, and especially in MM, remain largely unclear.
Several studies have reported decreased PHLDA1 mRNA expression in melanoma, breast carcinoma, oral carcinoma, gastric adenocarcinoma, and cholangiocarcinoma (6,26). Interestingly, for PHLDA2 expression, studies on lung cancer have shown controversial reports: while Wang et al. (8) found increased levels of PHLDA2 in lung cancer, results from Hsu et al. (29) reached the opposite conclusion. In addition, in human neuroendocrine tumors, PHLDA3 was shown to act as a tumor suppressor gene in cases with increased PHLDA3 mRNA expression (11,12). In agreement with these data, we noticed this variation of results during data mining, in which the data obtained in the TCGA for LUAD revealed significant mRNA expression of all members of the PHLDA family compared to normal tissue, and in Oncomine we observed underexpression of PHLDA1 mRNA and PHLDA2 mRNA overexpression, when compared to normal tissue. The same happened in the results for MM, where the GEO data showed lower expression of PHLDA1 and the expression of PHLDA3 significantly higher than normal samples, contrasting with the data from Oncomine in which both PHLDA1 and PHLDA3 mRNA were not significantly expressed in a tumor tissue compared to normal samples.
Regarding the prognostic significance of PHLDA genes in NSCLC and MM, we observed that low PHLDA1 expression was responsible for shorter OS, FPS, and PPS in NSCLC; high PHLDA2 mRNA expression was significantly associated with better OS; and high PHLDA3 mRNA expression led to poorer OS. Using Mesothelioma (TCGA, Firehose Legacy) data, we demonstrated that patients with MM presenting high PHLDA1 and PHLDA2 mRNA expression had poor OS. In contrast, Muroi et al. (30) demonstrated that low expression of PHLDA3 is associated with poor outcome in patients with esophageal squamous cell carcinomas.
We also used the Comparative Toxicogenomics Database to show that a number of commonly used drugs were able to modulate PHLDAs. For example, while cisplatin may decrease PHLDA1 levels, a few carcinogenic substances, such as tetrachlorodibenzodioxin and benzo(a)pyrene, seem to increase its expression (Figure 4). Moreover, the protein-protein interaction network that resulted from the STRING analysis revealed intricate interrelationships among PHLDA family members (Figure 5). For instance, PHLDA1 acts on the Notch signaling pathway, PHLDA2 impacts cyclin-dependent protein serine/threonine kinase activity, and PHLDA3 relates to signal transduction by p53 class mediator. Thus, there is great relevance in the study of the PHLDA family members for future applications as we suggested in this study.
Additionally, to our knowledge, this is the first reported case of a PHLDAs protein investigation using a quantitative approach in NSCLC and MM. In our experimental study, we found that median protein expression for PHLDA1 was similar between LUAD and MM, whereas PHLDA2 and PHLDA3 protein levels were significantly higher in LUAD than in MM, though increased PHLDA3 protein levels were dependent on an advanced stage of the disease. P53 density was also higher in LUAD when compared with MM. Increasing evidence demonstrates that PHLDA protein levels, based on immunohistochemistry, were associated with diagnosis, prognosis, and targeted therapy in different cancer cells (31-35), including lung cancer (8). In addition, IHC staining markers were quantified using a cytoplasmic and nuclear algorithm to analyze PHLDAs. LUAD and MM showed predominant cytoplasmic staining of PHLDA1 and PHLDA2, while PHLDA3 staining demonstrated a strong and diffuse nuclear and cytoplasmic expression. Viúdez et al. (32) presented a strong correlation between disease free survival and PHLDA3 nuclear expression, where a higher expression of PHLDA3 was associated with worse clinical outcomes.
The multivariate Cox model analysis of our cohort showed that higher levels of PHLDA2 and PHLDA3 in patients with stage I and stage III LUAD were also significantly associated with risk of death. While patients with PHLDA2 >85.09 cells/mm2 had lower risk of death and a median survival time of 48 months, those with PHLDA3 <70.38 cells/mm2 had higher risk of death and a median survival time of 34 months. These inconsistent associations of PHLDAs expression levels with prognosis in lung cancer and MM between our study and previous studies might be due to differences in racial composition, population and sample size, and methods employed to measure the expression of PHLDAs.
Nevertheless, this study has some limitations. First, our research consists of an analysis based on previous data; therefore, additional experimental studies are still needed to confirm its results. Second, the clinical sample size of immunohistochemistry on tissue microarrays was not large enough and may have resulted in false negatives, a well-described problem in real-world oncology (36). Finally, as a retrospective cohort, none of our patients received a targeted therapy that evaluated the role of PHLDA in the therapeutic outcome. In summary, we suggest that more well-designed studies be carried out to support our findings.
However, the present study validated PHLDA1 underexpression in LUAD patients and its involvement on worse survival outcomes. On the other hand, both PHLDA2 and PHLDA3 were highly expressed in LUAD and MM according to our bioinformatics analysis and clinical tissue microarray. We therefore conclude that PHILDA family members might be adopted as promising predictive biomarkers and potential therapeutic targets in LUAD and MM.
Supplementary
The article’s supplementary files as
Acknowledgments
We are grateful to Ms. Esmeralda Miristeni Eher and Ms. Sandra de Morais Fernezlian for their expertise on immunohistochemical protocols, and to Mr. Reginaldo Silva do Nascimento for his scanning expertise.
Funding: This work was supported by São Paulo Research Foundation (FAPESP) [2018/20403-6 to VLC]; the National Council for Scientific and Technological Development (CNPq) [483005/2012-6 to VLC]; and Coordenação de Aperfeiçoamento de Pessoal de Nível Superior - Brasil (CAPES) [Finance Code 001 to CMB].
Ethical Statement: The authors are accountable for all aspects of the work in ensuring that questions related to the accuracy or integrity of any part of the work are appropriately investigated and resolved. The study was conducted in accordance with the Declaration of Helsinki (as revised in 2013). The study was approved by the national ethics committee of nº 3.729.622 and individual consent for this retrospective analysis was waived.
Footnotes
Reporting Checklist: The authors have completed the REMARK reporting checklist. Available at http://dx.doi.org/10.21037/jtd-20-2909
Peer Review File: Available at http://dx.doi.org/10.21037/jtd-20-2909
Conflicts of Interest: All authors have completed the ICMJE uniform disclosure form (available at http://dx.doi.org/10.21037/jtd-20-2909). The authors have no conflicts of interest to declare.
References
- 1.Goldstraw P, Chansky K, Crowley J, et al. The IASLC Lung Cancer Staging Project: Proposals for Revision of the TNM Stage Groupings in the Forthcoming (Eighth) Edition of the TNM Classification for Lung Cancer. J Thorac Oncol 2016;11:39-51. 10.1016/j.jtho.2015.09.009 [DOI] [PubMed] [Google Scholar]
- 2.Sugarbaker DJ, Flores RM, Jaklitsch MT, et al. Resection margins, extrapleural nodal status, and cell type determine postoperative long-term survival in trimodality therapy of malignant pleural mesothelioma: Results in 183 patients. J Thorac Cardiovasc Surg 1999;117:54-63. 10.1016/S0022-5223(99)70469-1 [DOI] [PubMed] [Google Scholar]
- 3.Sugarbaker DJ, Strauss GM, Lynch TJ, et al. Node status has prognostic significance in the multimodality therapy of diffuse, malignant mesothelioma. J Clin Oncol 1993;11:1172-8. 10.1200/JCO.1993.11.6.1172 [DOI] [PubMed] [Google Scholar]
- 4.Rusch VW, Venkatraman ES. Important prognostic factors in patients with malignant pleural mesothelioma, managed surgically. Ann Thorac Surg 1999;68:1799-804. 10.1016/S0003-4975(99)01038-3 [DOI] [PubMed] [Google Scholar]
- 5.Frank D, Mendelsohn CL, Ciccone E, et al. A novel pleckstrin homology-related gene family defined by Ipl/Tssc3, TDAG51, and Tih1: tissue-specific expression, chromosomal location, and parental imprinting. Mamm Genome 1999;10:1150-9. 10.1007/s003359901182 [DOI] [PubMed] [Google Scholar]
- 6.Nagai MA. Pleckstrin homology-like domain, family A, member 1 (PHLDA1) and cancer. Biomed Rep 2016;4:275-81. 10.3892/br.2016.580 [DOI] [PMC free article] [PubMed] [Google Scholar]
- 7.Kawase T, Ohki R, Shibata T, et al. PH domain-only protein PHLDA3 is a p53-regulated repressor of Akt. Cell 2009;136:535-50. 10.1016/j.cell.2008.12.002 [DOI] [PubMed] [Google Scholar]
- 8.Wang X, Li G, Koul S, et al. PHLDA2 is a key oncogene-induced negative feedback inhibitor of EGFR/ErbB2 signaling via interference with AKT signaling. Oncotarget 2015;9:24914-26. 10.18632/oncotarget.3674 [DOI] [PMC free article] [PubMed] [Google Scholar]
- 9.Fearon AE, Carter EP, Clayton NS, et al. PHLDA1 Mediates Drug Resistance in Receptor Tyrosine Kinase-Driven Cancer. Cell Rep 2018;22:2469-81. 10.1016/j.celrep.2018.02.028 [DOI] [PMC free article] [PubMed] [Google Scholar]
- 10.Li G, Wang X, Hibshoosh H, et al. Modulation of ErbB2 blockade in ErbB2-positive cancers: the role of ErbB2 Mutations and PHLDA1. PLoS One 2014;9:e106349. 10.1371/journal.pone.0106349 [DOI] [PMC free article] [PubMed] [Google Scholar]
- 11.Takikawa M, Ohki R. A vicious partnership between AKT and PHLDA3 to facilitate neuroendocrine tumors. Cancer Sci 2017;108:1101-8. 10.1111/cas.13235 [DOI] [PMC free article] [PubMed] [Google Scholar]
- 12.Ohki R, Saito K, Chen Y, et al. PHLDA3 is a novel tumor suppressor of pancreatic neuroendocrine tumors. Proc Natl Acad Sci U S A 2014;111:E2404-13. 10.1073/pnas.1319962111 [DOI] [PMC free article] [PubMed] [Google Scholar]
- 13.Chandrashekar DS, Bashel B, Balasubramanya SAH, et al. UALCAN: A Portal for Facilitating Tumor Subgroup Gene Expression and Survival Analyses. Neoplasia 2017;19:649-58. 10.1016/j.neo.2017.05.002 [DOI] [PMC free article] [PubMed] [Google Scholar]
- 14.Danford T, Rolfe A, Gifford D. GSE: a comprehensive database system for the representation, retrieval, and analysis of microarray data. Pac Symp Biocomput 2008:539-50. [PMC free article] [PubMed] [Google Scholar]
- 15.Suraokar MB, Nunez MI, Diao L, et al. Expression profiling stratifies mesothelioma tumors and signifies deregulation of spindle checkpoint pathway and microtubule network with therapeutic implications. Ann Oncol 2014;25:1184-92. 10.1093/annonc/mdu127 [DOI] [PMC free article] [PubMed] [Google Scholar]
- 16.Rhodes DR, Yu J, Shanker K, et al. ONCOMINE: a cancer microarray database and integrated data-mining platform. Neoplasia 2004;6:1-6. 10.1016/S1476-5586(04)80047-2 [DOI] [PMC free article] [PubMed] [Google Scholar]
- 17.Rhodes DR, Kalyana-Sundaram S, Mahavisno V, et al. Oncomine 3.0: genes, pathways, and networks in a collection of 18,000 cancer gene expression profiles. Neoplasia 2007;9:166-80. 10.1593/neo.07112 [DOI] [PMC free article] [PubMed] [Google Scholar]
- 18.Győrffy B, Surowiak P, Budczies J, et al. Online Survival Analysis Software to Assess the Prognostic Value of Biomarkers Using Transcriptomic Data in Non-Small-Cell Lung Cancer. PLoS One 2013;8:e82241 10.1371/journal.pone.0082241 [DOI] [PMC free article] [PubMed] [Google Scholar]
- 19.Goldman MJ, Craft B, Hastie M., et al. Visualizing and interpreting cancer genomics data via the Xena platform. Nat Biotechnol 2020;38:675-8. 10.1038/s41587-020-0546-8 [DOI] [PMC free article] [PubMed] [Google Scholar]
- 20.Davis AP, Wiegers TC, Johnson RJ, et al. Text mining effectively scores and ranks the literature for improving chemical-gene-disease curation at the comparative toxicogenomics database. PLoS One 2013;8:e58201. 10.1371/journal.pone.0058201 [DOI] [PMC free article] [PubMed] [Google Scholar]
- 21.Shannon P, Markiel A, Ozier O, et al. Cytoscape: a software environment for integrated models of biomolecular interaction networks. Genome Res 2003;13:2498-504. 10.1101/gr.1239303 [DOI] [PMC free article] [PubMed] [Google Scholar]
- 22.Szklarczyk D, Gable AL, Lyon D, et al. STRING v11: protein-protein association networks with increased coverage, supporting functional discovery in genome-wide experimental datasets. Nucleic Acids Res 2019;47:D607-13. 10.1093/nar/gky1131 [DOI] [PMC free article] [PubMed] [Google Scholar]
- 23.Travis WD, Brambilla E, Nicholson AG, et al. The 2015 World Health Organization Classification of Lung Tumors: Impact of Genetic, Clinical and Radiologic Advances Since the 2004 Classification. J Thorac Oncol 2015;10:1243-60. 10.1097/JTO.0000000000000630 [DOI] [PubMed] [Google Scholar]
- 24.Travis WD, Brambilla E, Noguchi M, et al. International Association for the Study of Lung Cancer/American Thoracic Society/European Respiratory Society: International Multidisciplinary Classification of Lung Adenocarcinoma. J Thorac Oncol 2011;6:244-85. 10.1097/JTO.0b013e318206a221 [DOI] [PMC free article] [PubMed] [Google Scholar]
- 25.Song X, Zhao C, Jiang L, et al. High PITX1 expression in lung adenocarcinoma patients is associated with DNA methylation and poor prognosis. Pathol Res Pract 2018;214:2046-53. 10.1016/j.prp.2018.09.025 [DOI] [PubMed] [Google Scholar]
- 26.Bonatto N, Carlini MJ, de Bessa Garcia SA, Nagai MA. PHLDA1 (pleckstrin homology-like domain, family A, member 1) knockdown promotes migration and invasion of MCF10A breast epithelial cells. Cell Adh Migr 2018;12:37-46. 10.1080/19336918.2017.1313382 [DOI] [PMC free article] [PubMed] [Google Scholar]
- 27.Nagai MA, Fregnani JH, Netto MM, et al. Down-regulation of PHLDA1 gene expression is associated with breast cancer progression. Breast Cancer Res Treat 2007;106:49-56. 10.1007/s10549-006-9475-6 [DOI] [PubMed] [Google Scholar]
- 28.Fuselier TT, Lu H. PHLD Class Proteins: A Family of New Players in the p53 Network. Int J Mol Sci 2020;21:3543. 10.3390/ijms21103543 [DOI] [PMC free article] [PubMed] [Google Scholar]
- 29.Hsu YL, Hung JY, Lee YL, et al. Identification of novel gene expression signature in lung adenocarcinoma by using next-generation sequencing data and bioinformatics analysis. Oncotarget 2017;8:104831-54. 10.18632/oncotarget.21022 [DOI] [PMC free article] [PubMed] [Google Scholar]
- 30.Muroi H, Nakajima M, Satomura H, et al. Low PHLDA3 expression in oesophageal squamous cell carcinomas is associated with poor prognosis. Anticancer Res 2015;35:949-54. [PubMed] [Google Scholar]
- 31.Llamas-Velasco M, Pérez-Gónzalez YC, Bosch-Príncep R, et al. Solid carcinoma is a variant of microcystic adnexal carcinoma: A 14-case series. J Cutan Pathol 2018;45:897-904. 10.1111/cup.13351 [DOI] [PubMed] [Google Scholar]
- 32.Viúdez A, Carvalho FLF, Maleki Z, et al. A new immunohistochemistry prognostic score (IPS) for recurrence and survival in resected pancreatic neuroendocrine tumors (PanNET). Oncotarget 2016;7:24950-61. 10.18632/oncotarget.7436 [DOI] [PMC free article] [PubMed] [Google Scholar]
- 33.Jeon SY, Kim DC, Song KH, et al. Expression Patterns of Gli-1, Pleckstrin Homology-Like Domain, Family A, Member 1, Transforming Growth Factor-β1/β2, and p63 in Sebaceous and Follicular Tumors. Ann Dermatol 2014;26:713-21. 10.5021/ad.2014.26.6.713 [DOI] [PMC free article] [PubMed] [Google Scholar]
- 34.Battistella M, Carlson JA, Osio A, et al. Skin tumors with matrical differentiation: lessons from hair keratins, beta-catenin and PHLDA-1 expression. J Cutan Pathol 2014;41:427-36. 10.1111/cup.12313 [DOI] [PubMed] [Google Scholar]
- 35.Sellheyer K, Krahl D. PHLDA1 (TDAG51) is a follicular stem cell marker and differentiates between morphoeic basal cell carcinoma and desmoplastic trichoepithelioma. Br J Dermatol 2011;164:141-7. 10.1111/j.1365-2133.2010.10045.x [DOI] [PubMed] [Google Scholar]
- 36.Morris SM, Subramanian J, Gel ES, et al. Performance of next-generation sequencing on small tumor specimens and/or low tumor content samples using a commercially available platform. PLoS One 2018;13:e0196556. 10.1371/journal.pone.0196556 [DOI] [PMC free article] [PubMed] [Google Scholar]
Associated Data
This section collects any data citations, data availability statements, or supplementary materials included in this article.
Supplementary Materials
The article’s supplementary files as