Abstract
Background
Lung adenocarcinoma (LUAD) is the most predominant pathological subtype of lung cancer, accounting for 40–70% of all lung cancer cases. Although significant improvements have been made in the screening, diagnosis, and precise management in recent years, the prognosis of LUAD remains bleak. This study aimed to investigate the prognostic significance of autophagy-related long non-coding RNAs (lncRNAs) and construct an autophagy-related lncRNA prognostic model in LUAD.
Methods
The gene expression data of LUAD patients were obtained from The Cancer Genome Atlas (TCGA) database. All autophagy-related genes were downloaded from the Human Autophagy Database (HADb). Spearman’s correlation test was exploited to identify potential autophagy-related lncRNAs. The multivariate Cox regression analysis was used to construct the prognostic signature, which divided LUAD patients into high-risk and low-risk groups. Subsequently, the receiver operating characteristic (ROC) curves were generated to assess the predictive ability of this prognostic model for overall survival (OS) in these individuals. Then, the Gene set enrichment analysis (GSEA) was conducted to execute pathway enrichment analysis. Finally, a multidimensional validation was exploited to verify our findings.
Results
A total of 1,144 autophagy-related lncRNAs were identified to construct the co-expression network via Spearman’s correlation test (|R2| >0.4 and P≤0.001). Ultimately, a 16 autophagy-related lncRNAs prognostic model was constructed, and the area under the ROC curve (AUC) was 0.775. The results of GSEA enrichment analysis showed that the genes in the high-risk group were mainly enriched in cell cycle and p53 signaling pathways. The results of the multidimensional database validation indicated that the expression level of BIRC5 was significantly correlated with the expression level of TMPO-AS1. Furthermore, both TMPO-AS1 and BIRC5 had a higher expression level in LUAD samples. LUAD patients with high expression levels of TMPO-AS1 and BIRC5 were correlated with advanced disease stage and poor OS.
Conclusions
In summary, our results suggested that the prognostic signature of the 16 autophagy-related lncRNAs has significant prognostic value for LUAD patients. Furthermore, TMPO-AS1 and BIRC5 are potential predictors and therapeutic targets in these individuals.
Keywords: Lung adenocarcinoma (LUAD), autophagy, long non-coding RNA (lncRNA), prognostic model, The Cancer Genome Atlas (TCGA)
Introduction
Lung cancer is the most common malignant tumor type and the predominant cause of cancer-related deaths worldwide (1). It is reported that approximately 2.1 million new cases of lung cancer are diagnosed each year, and the mortality of lung cancer is staggering at 47%, accounting for 18.4% of cancer-related deaths (2,3). As the most common pathological subtype of lung cancer, lung adenocarcinoma (LUAD) accounting for 40–70% of all lung cancer patients (4,5). Although significant improvements have been made in the screening, diagnosis, and precise management in recent years, the prognosis of LUAD remains bleak, with overall survival (OS) less than 5 years (6). Furthermore, most LUAD patients are often diagnosed at an advanced stage and involved in disseminated metastatic tumors, which leads to a limited strategy for treatment (6).
Autophagy is a highly conserved and pivotal catabolic process in eukaryotic cells (7). It maintains the homeostasis of the intracellular environment by forming autophagosome vesicles, engulfing dysfunctional cytoplasm and organelles, and forming autolysosome to degrade the contents of vesicles (8,9). Although initially considered simply a degradative process, numerous studies have revealed that autophagy has two primary and opposing functions in the human pathophysiological process in recent decades (10). On the one hand, it represents a response to stress induced by chemotherapy or radiation by providing the necessary circulating metabolic substrates for survival, which serves as a cytoprotective function (10). On the other hand, it promotes tumor cell death either alone or in association with apoptosis, which plays a role in cytotoxic function (10). Whether autophagy plays a positive role or a negative role in tumor cells depends on its activation state and other cellular conditions. For instance, previous studies elucidated that autophagy regulates the proliferation and apoptosis of LUAD cells under different molecules (11).
Long non-coding RNAs (LncRNAs) referred to a class of non-protein-coding RNAs with transcripts longer than 200 bp (12). They have been proposed to play significant roles in the development, progression, and prognosis of various malignancies, including lung cancer, breast cancer, colorectal cancer, and so on (13-17). For example, it showed that LINC00173.v1 could promote the proliferation and migration of vascular endothelial cells and the tumorigenesis of lung squamous cell carcinoma (15). LncRNA AFAP1-AS1 predicts a poor prognosis and regulates non-small cell lung cancer (NSCLC) cell proliferation by epigenetically repressing p21 expression (16). LncRNA AK126698 has been found to confer cisplatin resistance by targeting the Wnt pathway in NSCLC cell lines (17). Furthermore, mounting studies have shown that lncRNAs also play pivotal roles in angiogenesis and metastasis in LUAD (18-20). Peng et al. reported that LINC00312 induces LUAD migration and vasculogenic mimicry through directly binding YBX1 (18). In a recently published study, Wang et al. indicated that LINC01116 contributes to chemoresistance in LUAD via the Epithelial-Mesenchymal Transition (EMT) process (19). Besides, it was reported that LINC00673-v4 is a driver molecule for metastasis via constitutively activating WNT/β-catenin signaling in LUAD and may represent a potential therapeutic target against the metastasis of LUAD (20).
Recently, increasing evidence suggests that lncRNAs regulate the autophagy regulatory network via mediating transcriptional and post-transcriptional levels of autophagy-related genes in various tumor cells, including LUAD (21-25). In this regard, autophagy-related lncRNAs may have potential prognostic value in patients with LUAD. Therefore, we conducted the present bioinformatic analysis to construct an autophagy-related lncRNA signature in these individuals using The Cancer Genome Atlas (TCGA) database. We present the following article in accordance with the MDAR reporting checklist (available at http://dx.doi.org/10.21037/jtd-20-2803).
Methods
Raw data acquisition and analysis
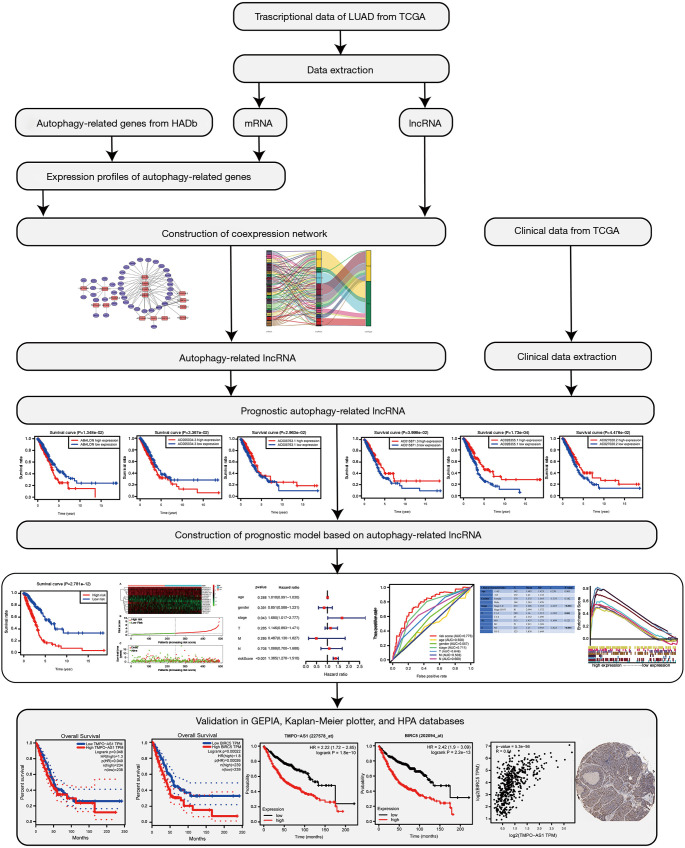
The gene expression profiles and corresponding clinical profiles of 594 LUAD patients (tumor samples, 535 cases; normal samples, 59 cases) were obtained from the TCGA database (https://tcgadata.nci.nih.gov/tcga/). The Practical Extraction and Report Language (Perl) script was used to merge all the clinical data, such as survival time, survival status, age, gender, disease stage, American Joint Committee on Cancer (AJCC) T stage, AJCC-N stage, and AJCC-M stage. All of the autophagy-related genes were downloaded from the Human Autophagy Database (HADb) (http://www.autophagy.lu/). Subsequently, Spearman’s correlation test was exploited to identify potential autophagy-related lncRNAs, with correlation coefficient |R2| >0.4 and P value <0.001 being used as filtering criteria. The detailed flow chart of this study was presented in Figure 1. Furthermore, Cytoscape of version 3.8.0 was used to visualize the co-expression network.
Figure 1.
Flow chart of this study (IHC, ×100).
Identification of autophagy-related lncRNA prognostic signature for LUAD
Among the extracted clinical profiles, a total of 499 samples had detailed clinical information. In the current study, we selected overall survival (OS) to measure the clinical outcomes of LUAD patients. Subsequently, we merged the expression levels of autophagy-related lncRNAs with their corresponding survival outcomes by matching the id number of each patient, and the univariate Cox regression analysis was applied to identify potential autophagy-related lncRNAs associated with survival. Finally, the multivariate Cox regression analysis was adopted to construct the prognostic signature, and the risk score was calculated based on the following formula:
| [1] |
In the formula, ‘k’ represents the total number of the autophagy-related lncRNAs in the prognostic model. ‘gene i’ represents the ith selected autophagy-related lncRNA, and ‘coefficient (gene i)’ represents the coefficient of the autophagy-related lncRNA in multivariate Cox regression analysis. We further chose the differentially expressed autophagy-related lncRNAs in multivariate Cox regression analysis, with the Kaplan-Meier survival curves were generated to compare their survival differences. Finally, all of the patients were divided into high-risk and low-risk score groups based on the median value of the risk score. The Kaplan-Meier survival analysis was conducted to estimate the survival difference between the two groups using the survival and survminer R packages.
The predictive ability of the constructed prognostic signature for LUAD
To evaluate the predictive ability of the constructed prognostic signature, we merged the clinicopathological characteristics and the calculated risk score of each patient. Then, we performed univariate and multivariate Cox regression analyses using the Survival R package. Furthermore, the receiver operating characteristic (ROC) curves were generated to assess the predictive ability for OS by different clinicopathological factors and risk score using the survivalROC R package.
Gene set enrichment analysis
Gene set enrichment analysis (GSEA) was conducted using the risk score as the phenotype label. We chose “c2.cp.kegg.v6.2.symbols.gmt” gene sets as reference gene sets, and GSEA 4.0 software was applied to data analysis. NOM P<0.05 and FDR q<0.25 were used as the criteria of significant enrichment pathways.
Multidimensional validation
The Gene Expression Profiling Interactive Analysis (GEPIA, http://gepia.cancer-pku.cn/) database, Kaplan-Meier plotter database (http://www.kmplot.com/), and Human Protein Atlas (HPA, https://www.proteinatlas.org/) database were utilized to validate the expression and prognosis of critical autophagy-related lncRNAs in the prognostic signature. The expression, survival, and correlation modules in the GEPIA database were used to validate the expression level, survival difference, and correlation significance of the identified autophagy-related lncRNAs. In the Kaplan-Meier plotter database, the Kaplan-Meier survival curves were generated according to the median expression values of the identified autophagy-related lncRNAs. Finally, the HPA database was used to compare the protein expression levels of the identified genes in normal lung and LUAD samples, and the original immunohistochemistry (IHC) results were downloaded from the website.
Statistical analysis
All statistical analysis was performed using R Studio (version 1.3.959) and Bioconductor (https://www.bioconductor.org/). The limma R package was used for differential analysis. The survival R package was adopted for the Cox regression model construction. The survival difference was evaluated and visualized using Kaplan-Meier survival curves, and the association was tested via log-rank tests. The independent samples t-test was utilized to evaluate the relationship between risk score and clinical characteristics of LUAD patients. The ROC curve was adopted to assess the predictive ability of the prognostic model, with an area under the ROC curve (AUC) value >0.60 was considered as acceptable for predictions (26,27).
Ethical statement
The study was conducted in accordance with the Declaration of Helsinki (as revised in 2013).
Results
Construction of co-expression network of autophagy-related lncRNA for LUAD
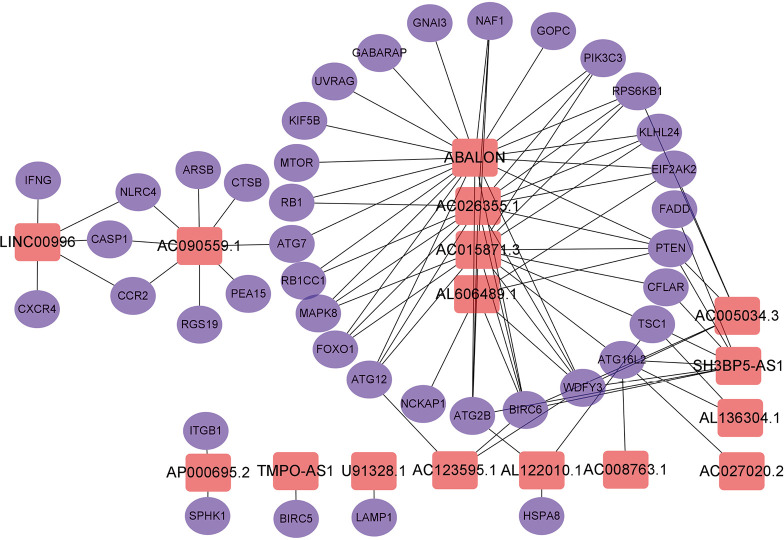
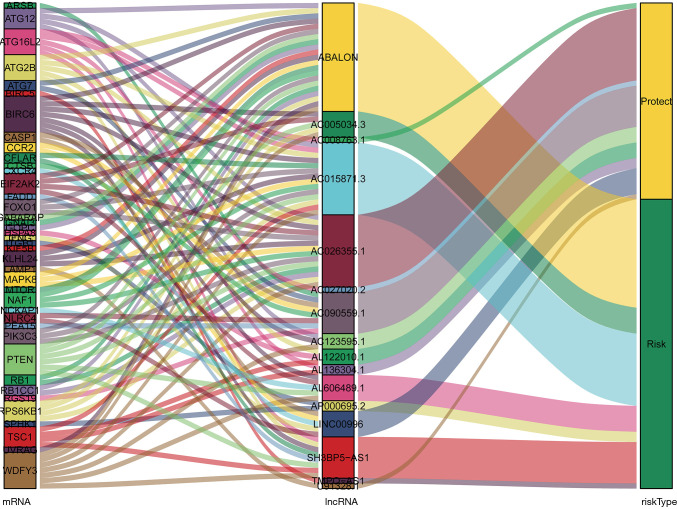
A total of 14,142 lncRNAs were obtained from the TCGA-LUAD cohort. Meanwhile, there were 232 autophagy-related genes downloaded from HADb. Finally, a total of 1,144 autophagy-related lncRNAs were identified to construct the co-expression network via Spearman’s correlation test (|R2| >0.4 and P≤0.001). Subsequently, the univariate and multivariate Cox regression analyses were performed to find autophagy-related lncRNAs associated with survival and construct a co-expression network. Ultimately, we obtained 16 optimal autophagy-related lncRNAs, and the Cytoscape software and ggalluvial R package were further used for visualization (Figures 2,3). The detailed information of the 16 autophagy-related lncRNAs was summarized in Table 1.
Figure 2.
The co-expression network of the 16 autophagy-related lncRNAs-mRNAs with prognostic value was constructed and visualized using Cytoscape.
Figure 3.
The constructed autophagy-related lncRNAs-mRNAs co-expression network was visualized using Sankey diagram.
Table 1. Detailed information for 16 autophagy-related lncRNAs significantly associated with OS in LUAD.
| LncRNA | Coefficient | SE | HR | 95% CI | |
|---|---|---|---|---|---|
| Lower | Upper | ||||
| TMPO-AS1 | 0.205 | 0.103 | 1.227 | 1.003 | 1.502 |
| AC005034.3 | 0.067 | 0.044 | 1.069 | 0.981 | 1.165 |
| AL606489.1 | 0.112 | 0.074 | 1.118 | 0.967 | 1.293 |
| AC123595.1 | −0.428 | 0.223 | 0.652 | 0.421 | 1.009 |
| AL136304.1 | −0.394 | 0.166 | 0.675 | 0.487 | 0.934 |
| AC008763.1 | −0.207 | 0.139 | 0.813 | 0.619 | 1.067 |
| U91328.1 | −0.284 | 0.172 | 0.753 | 0.538 | 1.054 |
| AL122010.1 | −0.181 | 0.116 | 0.835 | 0.665 | 1.047 |
| ABALON | 0.344 | 0.159 | 1.410 | 1.032 | 1.927 |
| AC090559.1 | −0.208 | 0.094 | 0.812 | 0.675 | 0.978 |
| AP000695.2 | 0.188 | 0.108 | 1.206 | 0.976 | 1.491 |
| SH3BP5-AS1 | 0.236 | 0.097 | 1.266 | 1.046 | 1.532 |
| LINC00996 | −0.365 | 0.231 | 0.694 | 0.441 | 1.092 |
| AC015871.3 | 0.154 | 0.093 | 1.167 | 0.972 | 1.401 |
| AC027020.2 | −0.355 | 0.181 | 0.701 | 0.492 | 0.998 |
| AC026355.1 | −0.228 | 0.079 | 0.796 | 0.682 | 0.929 |
LUAD, lung adenocarcinoma.
Identification of autophagy-related lncRNA prognostic signature for LUAD
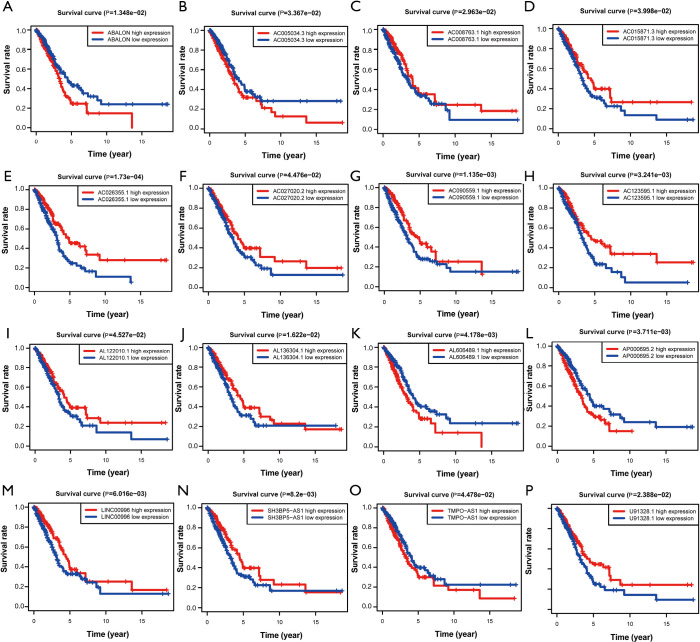
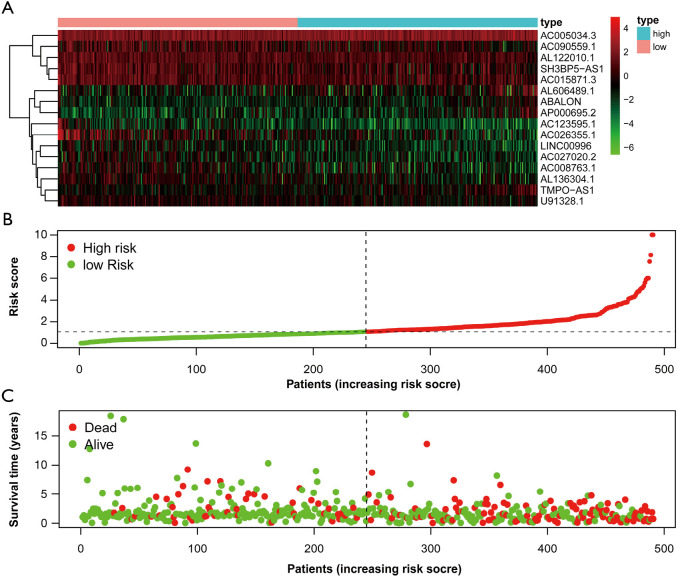
First of all, we drew the Kaplan-Meier curves of the identified 16 autophagy-related lncRNAs according to their expression levels. The results indicated that patients with high expression levels of ABALON, AC005034.3, AL606489.1, AP000695.2, and TMPO-AS1 were correlated with poor OS in LUAD (Figure 4). However, patients with high expression levels of AC008763.1, AC015871.3, AC026355.1, AC027020.2, AC090559.1, AC123595.1, AL122010.1, AL136304.1, LINC00996, SH3BP5-AS1, and U91328.1 were correlated with favourable OS (Figure 4). Furthermore, we classified all the patients into high-risk and low-risk score groups according to the median value of risk score to determine the difference between the two groups. We then performed a Kaplan-Meier curve based on the log-rank test, and it showed that patients in the high-risk score group had a worse prognosis (Figure 5). The heatmap was generated to depict the expression patterns of the identified autophagy-related lncRNAs in the two prognostic groups (Figure 6A). Besides, we created scatterplot to show the risk score and survival status of each LUAD sample (Figure 6B,C).
Figure 4.
Kaplan-Meier survival curves of the identified 16 autophagy-related lncRNAs in LUAD in TCGA database. (A) ABALON; (B) AC005034.3; (C) AC008763.1; (D) AC015871.3; (E) AC026355.1; (F) AC027020.2; (G) AC090559.1; (H) AC123595.1; (I) AL122010.1; (J) AL136304.1; (K) AL606489.1; (L) AP000695.2; (M) LINC00996; (N) SH3BP5-AS1; (O) TMPO-AS1; (P) U91328.1. LUAD, lung adenocarcinoma; TCGA, The Cancer Genome Atlas.
Figure 5.
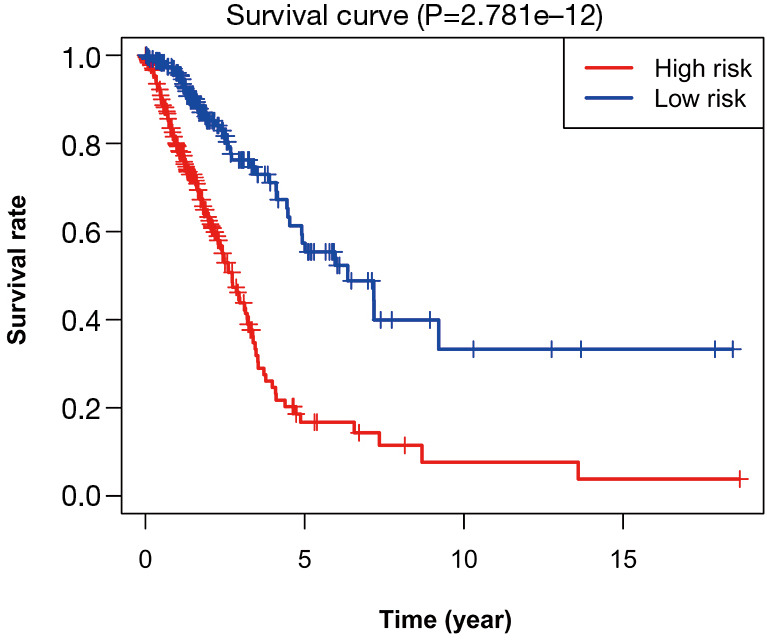
Kaplan-Meier survival analysis of the high-risk and low-risk groups based on the risk model and median risk score for LUAD patients. LUAD, lung adenocarcinoma.
Figure 6.
Autophagy-related lncRNA risk score analysis of LUAD patients. (A) Heatmap showed the expression profiles of autophagy-related lncRNAs in the low-risk and high-risk groups; (B) the risk curve based on the risk score of each sample; (C) the scatterplot based on the survival status of each sample. LUAD, lung adenocarcinoma.
Evaluation of the constructed prognostic signature as an independent prognostic factor for LUAD
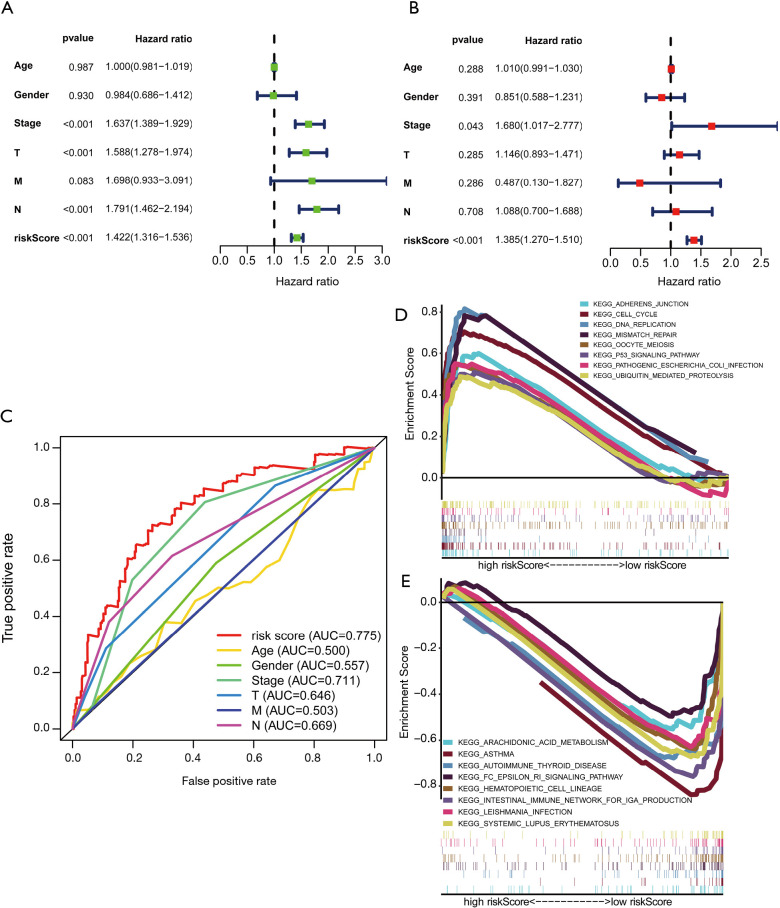
To evaluate whether the constructed autophagy-related lncRNAs is an independent prognostic factor for LUAD patients, we conducted the univariate and multivariate Cox regression analyses. The results of the Cox regression analysis indicated that the risk score could be used as an independent prognostic factor in LUAD (Figure 7A,B). Besides, the ROC curves were generated to assess the predictive sensitivity and specificity of the risk model on the prognosis of LUAD patients. It showed that the AUC of the risk score was 0.775, followed by the AUC of disease stage and N stage (Figure 7C), suggesting that the predictive ability of the constructed prognostic signature of 16 autophagy-related lncRNAs for the prognosis of LUAD was acceptable. We also explored the relationship between risk score and clinicopathological characteristics in LUAD. It showed that patients with high-risk scores were correlated with advanced disease stage (P<0.001), T stage (P=0.001), and N stage (P<0.001) (Table 2).
Figure 7.
Independent prognostic ability evaluation and functional enrichment analysis for the constructed prognostic signature in LUAD. (A,B) The univariate and multivariate Cox regression analysis of risk model score and clinical features regarding prognostic value. (C) The ROC curves of risk score and clinicopathological characteristics; (D,E) functional enrichment analysis based on the risk model of the 16 autophagy-related lncRNAs by GSEA. LUAD, lung adenocarcinoma; ROC, receiver operating characteristic curves; GSEA, gene set enrichment analysis.
Table 2. The association between risk score and clinical characteristics in LUAD.
| Clinical characteristics | Number | Mean | SD | t | P value |
|---|---|---|---|---|---|
| Age | 0.250 | 0.803 | |||
| ≤65 years | 162 | 1.485 | 1.423 | ||
| >65 years | 172 | 1.45 | 1.135 | ||
| Gender | −1.337 | 0.182 | |||
| Female | 170 | 1.375 | 1.055 | ||
| Male | 164 | 1.563 | 1.476 | ||
| Stage | −4.405 | <0.001 | |||
| Stage I–II | 253 | 1.266 | 1.103 | ||
| Stage III–IV | 81 | 2.094 | 1.572 | ||
| T | −3.382 | 0.001 | |||
| T1–2 | 289 | 1.36 | 1.212 | ||
| T3–4 | 45 | 2.152 | 1.496 | ||
| M | −1.609 | 0.121 | |||
| M0 | 313 | 1.437 | 1.275 | ||
| M1 | 21 | 1.911 | 1.309 | ||
| N | −3.623 | <0.001 | |||
| N0 | 211 | 1.25 | 0.945 | ||
| N1–3 | 123 | 1.838 | 1.649 |
LUAD, lung adenocarcinoma.
Gene set enrichment analysis
In order to explore the primarily involved biological processes and pathways of the differentially expressed genes in the prognostic signature, we performed GSEA enrichment analysis, with “c2.cp.kegg.v6.2.symbols.gmt” gene sets being used as reference gene sets. The results of GSEA enrichment analysis showed that in the high-risk score group, the genes were mainly enriched in the cell cycle, adherens junction, DNA replication, mismatch repair, p53 signaling pathway, and ubiquitin-mediated proteolysis pathway (Figure 7D). As to the low-risk score group, the genes were primarily enriched in immunological processes, such as an intestinal immune network for IgA production, systemic lupus erythematosus, and autoimmune thyroid disease (Figure 7E).
Multidimensional validation
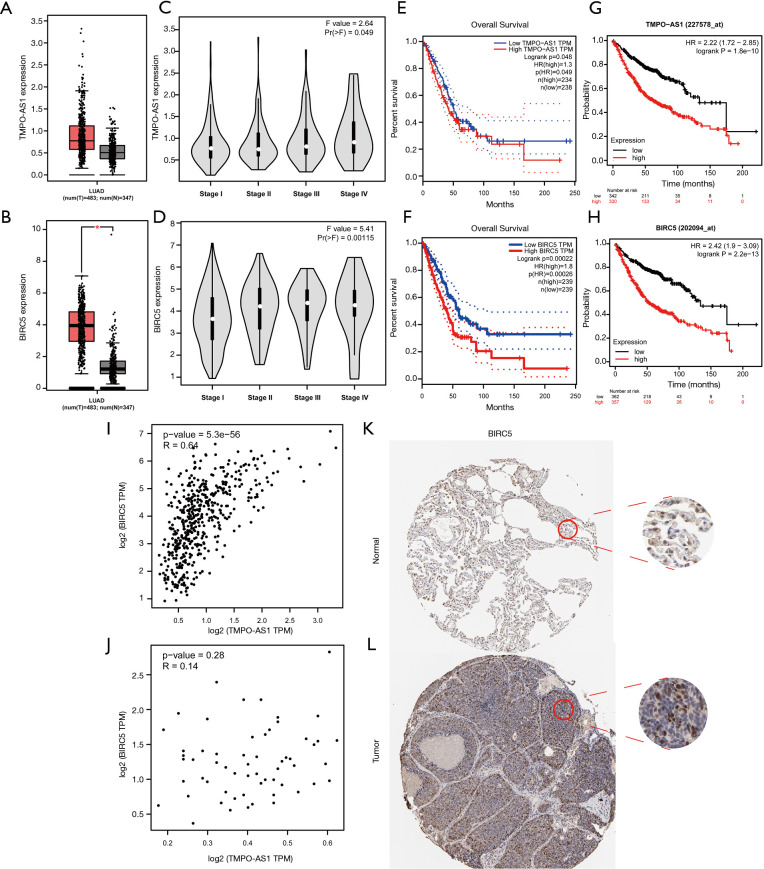
We found that TMPO-AS1 and BIRC5 had a higher correlation coefficient in the result of the Pearson correlation test. Meanwhile, the co-expression network also showed that TMPO-AS1 and BIRC5 were significantly correlated. Hence, we performed a multidimensional validation in other databases, including GEPIA, Kaplan-Meier plotter, and HPA databases. The results of the GEPIA database indicated that both TMPO-AS1 and BIRC5 had a higher expression level in LUAD samples (Figure 8A,B). We also analyzed the relationship between disease stage and the expression levels of TMPO-AS1 and BIRC5, which showed that patients with high expression levels of TMPO-AS1 and BIRC5 were correlated with advanced disease stage (TMPO-AS1: P=0.049, BIRC5: P=0.00115, respectively) (Figure 8C,D). Furthermore, the results of Kaplan-Meier curves in GEPIA and Kaplan-Meier Plotter databases indicated that high expression levels of TMPO-AS1 and BIRC5 were significantly associated with poor OS in LUAD patients (Figure 8E,F,G,H). In order to confirm the correlation between TMPO-AS1 and BIRC5, we did Spearman’s correlation test in the GEPIA database again, which suggested that the expression level of BIRC5 was significantly correlated with the expression level of TMPO-AS1 in LUAD (R=0.64 and P=5.3e−56) (Figure 8I). Nevertheless, no similar phenomenon was observed in normal lung samples (Figure 8J). Then, the HPA database was exploited to evaluate the protein expression level of BIRC5. We observed that BIRC5 was positively stained in the nuclear of lung tumor cells compared with the normal tissue (Figure 8K,L).
Figure 8.
Multidimensional validation of TMPO-AS1 and BIRC5 in external databases. (A,B) The expression levels of TMPO-AS1 and BIRC5 in GEPIA database; (C,D) the relationship between the expression levels of TMPO-AS1 and BIRC5 and disease stage in LUAD in GEPIA database; (E,F) Kaplan-Meier survival analysis based on the expression levels of TMPO-AS1 and BIRC5 in LUAD in GEPIA database; (G,H) Kaplan-Meier survival analysis based on the expression levels of TMPO-AS1 and BIRC5 in LUAD in Kaplan-Meier Plotter database; (I,J) Spearman’s correlation tests for TMPO-AS1 and BIRC5 expression in LUAD sample and normal lung tissue; (K,L) the expression level of BIRC5 in normal lung tissue and LUAD in HPA database (IHC, ×100). GEPIA, Gene Expression Profiling Interactive Analysis; LUAD, lung adenocarcinoma; HPA, Human Protein Atlas.
Discussion
In spite of achievements in the screening, diagnosis, and treatment of LUAD have been made in recent decades, especially the clinical application of next-generation sequencing (NGS) technology and immunotherapy, it remains one of the most aggressive and lethal malignant types (6). Recently, numerous studies have highlighted that autophagy and lncRNAs were involved in the development, progression, and prognosis of various malignancies, including lung cancer (11,17). Herein, we conducted this study to construct an autophagy-related lncRNA signature to predict the prognosis of LUAD patients using the TCGA database.
In the present study, we constructed a 16 autophagy-related lncRNAs prognostic signature using the transcription profiles from the TCGA-LUAD cohort. We observed that the prognostic signature could divide patients into high- and low-risk score groups according to the median value of risk score. Besides, it showed that patients in the high-risk score group were correlated with unfavourable OS. Furthermore, the results of the ROC curves analysis indicated that our prognostic signature had an acceptable ability to predict the survival outcomes of LUAD patients. Later GSEA enrichment analysis suggested that in the high-risk score group, the genes were mainly enriched in the cell cycle, adherens junction, DNA replication, mismatch repair, p53 signaling pathway, and ubiquitin-mediated proteolysis pathway. p53 tumour suppressor protein is a vital cellular stress sensor, which plays an important role in cell cycle arrest and apoptosis. Recently, a growing number of studies elucidated that p53 can also regulate autophagy (6,28,29). Cytoplasmic p53 inhibits autophagy while nuclear p53 promotes it. p53 translocates to the nucleus and promotes the transcription and expression levels of sestrin1 and sestrin2, which can further stimulate autophagy via the AMPK-TSC2-mTOR pathway (6,30). Furthermore, previously published studies revealed that the activation of mTORC1 and inhibition of AMP-dependent kinase could also manipulate the anti-autophagic role of p53 (31). Komarov et al. revealed that pifithrin-α could induce autophagy in cell lines and mouse models by blocking p53 expression (32). Meanwhile, p53 knockout cells display enhanced autophagy compared to its wild-type counterpart (6).
Among the 16 autophagy-related lncRNAs in the prognostic signature, we observed that TMPO-AS1 and BIRC5 had a higher correlation coefficient in the result of the Pearson correlation test. Besides, the co-expression network also showed that TMPO-AS1 and BIRC5 were significantly correlated. Hence, we did a multidimensional validation to explore their expression, prognosis, and correlation in other databases, including GEPIA, Kaplan-Meier plotter, and HPA databases. The results of the multidimensional database validation indicated that both TMPO-AS1 and BIRC5 had a higher expression level in LUAD samples. LUAD patients with high expression levels of TMPO-AS1 and BIRC5 were correlated with advanced disease stage as well. Furthermore, the results of Kaplan-Meier curves in the GEPIA and Kaplan-Meier Plotter databases also indicated that LUAD patients with high expression levels of TMPO-AS1 and BIRC5 were correlated with poor OS. The result of Spearman’s correlation test in the GEPIA database suggested that the expression level of BIRC5 was significantly correlated with the expression level of TMPO-AS1 in LUAD. Therefore, TMPO-AS1 may induce autophagy by upregulating the expression of BIRC5. TMPO antisense RNA 1 (TMPO-AS1), located on the opposite strand of the gene TMPO, is upregulated in multiple malignant types and correlated with reduced OS in these individuals (33). The results of previously published studies suggested that TMPO-AS1 is upregulated and correlated with poor prognosis in LUAD patients via upregulating its natural antisense transcript TMPO (33,34). Recently, Mu et al. reported that TMPO-AS1 could promote cell growth, apoptosis, and invasion in LUAD cell lines (34). Furthermore, they also revealed that miR-383-5p could directly target TMPO-AS1, followed by inhibiting the expression and function of TMPO-AS1 (34). Besides, Peng et al. observed that TMPO-AS1 could affect the prognosis of LUAD by deregulating cell cycle pathway genes through bioinformatics analysis (35).
BIRC5 (also named survivin) located near the telomeric end of chromosome 17, is a well-known cancer therapeutic target (36). A growing number of studies indicated that the high expression level of BIRC5 was associated with worse clinical outcomes in various malignancies, including LUAD, hepatobiliary and pancreatic cancer, esophageal cancer, and breast cancer (36-40). Consistent with the results of previous studies, we observed that high expression of BIRC5 was correlated with advanced disease stage and reduced OS in LUAD (41,42). The abnormal expression of BIRC5 plays a crucial role in the prognosis and sensitivity of chemoradiotherapy in patients with cancer (43). BIRC5 also plays a dual role in inhibiting apoptosis and regulating mitosis by suppressing the activities of caspase3 and caspase7. Recently, mounting evidence shows that BIRC5 regulates tumor cells proliferation through the β-catenin pathway and promotes the migration and invasion of tumor cells through the TGF-β pathway and the PI3K/AKT pathway, which suggests that BIRC5 may promote the development of tumor by regulating cell cycle and apoptosis signaling pathways (40,44,45). In the present study, we observed that the differentially expressed genes in the high-risk score group were involved in cell cycle and p53 signaling pathways. Taken together, TMPO-AS1 may upregulate the expression of BIRC5 and induce autophagy via cell cycle and p53 signaling pathways in LUAD. Although the result is meaningful and interesting, there are no relevant biological experiments to support our findings. We will continue to explore the potential mechanisms on how the lncRNA TMPO-AS1 upregulates the expression of BIRC5 and induce autophagy in LUAD in our future work.
As far as we can tell, this is the first study that constructed an autophagy-related lncRNA prognostic signature in LUAD. Although we conducted a multidimensional validation of our findings, there are also several inevitable limitations in our study. First, there was no relevant basic experiment to detect the expression levels of the identified autophagy-related lncRNAs in cell lines or clinical samples; Second, although we observed that TMPO-AS1 might upregulate the expression of BIRC5 and induce autophagy via cell cycle and p53 signaling pathways in LUAD, there are no relevant biological experiments to support our findings. Moreover, the potential mechanisms on how the lncRNA TMPO-AS1 upregulates the expression of BIRC5 and induces autophagy should be further explored in the future. Last but not least, there is no external or independent sample to verify the validity of the current autophagy-related lncRNA prognostic model.
Conclusions
In summary, our study provided a systematic analysis of autophagy-related lncRNAs in LUAD patients and constructed an autophagy-related lncRNA prognostic signature. The results suggested that patients with high-risk scores are associated with worse prognosis in LUAD patients. Our study also suggested that the prognostic signature of the 16 autophagy-related lncRNAs has significant prognostic value for LUAD patients. Furthermore, TMPO-AS1 and BIRC5 are potential predictors and therapeutic targets in these individuals. Further biological experiments and clinical researches are warranted to validate the results of our study.
Supplementary
The article’s supplementary files as
Acknowledgments
We would like to acknowledge Rim Ali Said for providing linguistic editing in this manuscript.
Funding: None.
Ethical Statement: The authors are accountable for all aspects of the work in ensuring that questions related to the accuracy or integrity of any part of the work are appropriately investigated and resolved. The study was conducted in accordance with the Declaration of Helsinki (as revised in 2013).
Footnotes
Reporting Checklist: The authors have completed the MDAR reporting checklist. Available at http://dx.doi.org/10.21037/jtd-20-2803
Conflicts of Interest: All authors have completed the ICMJE uniform disclosure form (available at http://dx.doi.org/10.21037/jtd-20-2803). The authors have no conflicts of interest to declare.
References
- 1.Chen Z, Fillmore CM, Hammerman PS, et al. Non-small-cell lung cancers: a heterogeneous set of diseases. Nat Rev Cancer 2014;14:535-46. 10.1038/nrc3775 [DOI] [PMC free article] [PubMed] [Google Scholar]
- 2.Fitzmaurice C, Allen C, Barber RM, et al. Global, Regional, and National Cancer Incidence, Mortality, Years of Life Lost, Years Lived With Disability, and Disability-Adjusted Life-years for 32 Cancer Groups, 1990 to 2015: A Systematic Analysis for the Global Burden of Disease Study. JAMA Oncol 2017;3:524-48. 10.1001/jamaoncol.2016.5688 [DOI] [PMC free article] [PubMed] [Google Scholar]
- 3.Siegel RL, Miller KD, Jemal A. Cancer statistics, 2019. CA Cancer J Clin 2019;69:7-34. 10.3322/caac.21551 [DOI] [PubMed] [Google Scholar]
- 4.Travis WD, Brambilla E, Nicholson AG, et al. The 2015 World Health Organization Classification of Lung Tumors: Impact of Genetic, Clinical and Radiologic Advances Since the 2004 Classification. J Thorac Oncol 2015;10:1243-60. 10.1097/JTO.0000000000000630 [DOI] [PubMed] [Google Scholar]
- 5.Neal RD, Hamilton W, Rogers TK. Lung cancer. BMJ 2014;349:g6560. 10.1136/bmj.g6560 [DOI] [PubMed] [Google Scholar]
- 6.Denisenko TV, Budkevich IN, Zhivotovsky B. Cell death-based treatment of lung adenocarcinoma. Cell Death Dis 2018;9:117. 10.1038/s41419-017-0063-y [DOI] [PMC free article] [PubMed] [Google Scholar]
- 7.Han J, Hou W, Goldstein LA, et al. A Complex between Atg7 and Caspase-9: A novel mechanism of cross-regulation between autophagy and apoptosis. J Biol Chem 2014;289:6485-97. 10.1074/jbc.M113.536854 [DOI] [PMC free article] [PubMed] [Google Scholar]
- 8.Klionsky DJ. Autophagy: from phenomenology to molecular understanding in less than a decade. Nat Rev Mol Cell Biol 2007;8:931-7. 10.1038/nrm2245 [DOI] [PubMed] [Google Scholar]
- 9.Levine B, Mizushima N, Virgin HW. Autophagy in immunity and inflammation. Nature 2011;469:323-35. 10.1038/nature09782 [DOI] [PMC free article] [PubMed] [Google Scholar]
- 10.Gewirtz DA. The four faces of autophagy: implications for cancer therapy. Cancer Res 2014;74:647-51. 10.1158/0008-5472.CAN-13-2966 [DOI] [PubMed] [Google Scholar]
- 11.Liu G, Pei F, Yang F, et al. Role of Autophagy and Apoptosis in Non-Small-Cell Lung Cancer. Int J Mol Sci 2017;18:367. 10.3390/ijms18020367 [DOI] [PMC free article] [PubMed] [Google Scholar]
- 12.Kopp F, Mendell JT. Functional Classification and Experimental Dissection of Long Noncoding RNAs. Cell 2018;172:393-407. 10.1016/j.cell.2018.01.011 [DOI] [PMC free article] [PubMed] [Google Scholar]
- 13.Yue B, Qiu S, Zhao S, et al. LncRNA-ATB mediated E-cadherin repression promotes the progression of colon cancer and predicts poor prognosis. J Gastroenterol Hepatol 2016;31:595-603. 10.1111/jgh.13206 [DOI] [PubMed] [Google Scholar]
- 14.Augoff K, McCue B, Plow EF, et al. miR-31 and its host gene lncRNA LOC554202 are regulated by promoter hypermethylation in triple-negative breast cancer. Mol Cancer 2012;11:5. 10.1186/1476-4598-11-5 [DOI] [PMC free article] [PubMed] [Google Scholar]
- 15.Chen J, Liu A, Wang Z, et al. LINC00173.v1 promotes angiogenesis and progression of lung squamous cell carcinoma by sponging miR-511-5p to regulate VEGFA expression. Mol Cancer 2020;19:98. 10.1186/s12943-020-01217-2 [DOI] [PMC free article] [PubMed] [Google Scholar]
- 16.Yin D, Lu X, Su J, et al. Long noncoding RNA AFAP1-AS1 predicts a poor prognosis and regulates non-small cell lung cancer cell proliferation by epigenetically repressing p21 expression. Mol Cancer 2018;17:92. 10.1186/s12943-018-0836-7 [DOI] [PMC free article] [PubMed] [Google Scholar]
- 17.Yang Y, Li H, Hou S, et al. The noncoding RNA expression profile and the effect of lncRNA AK126698 on cisplatin resistance in non-small-cell lung cancer cell. PLoS One 2013;8:e65309. 10.1371/journal.pone.0065309 [DOI] [PMC free article] [PubMed] [Google Scholar]
- 18.Peng Z, Wang J, Shan B, et al. The long noncoding RNA LINC00312 induces lung adenocarcinoma migration and vasculogenic mimicry through directly binding YBX1. Molecular Cancer 2018;17:167. 10.1186/s12943-018-0920-z [DOI] [PMC free article] [PubMed] [Google Scholar]
- 19.Wang J, Gao J, Chen Q, et al. LncRNA LINC01116 Contributes to Cisplatin Resistance in Lung Adenocarcinoma. Onco Targets Ther 2020;13:9333-48. 10.2147/OTT.S244879 [DOI] [PMC free article] [PubMed] [Google Scholar] [Retracted]
- 20.Guan H, Zhu T, Wu S, et al. Long noncoding RNA LINC00673-v4 promotes aggressiveness of lung adenocarcinoma via activating WNT/β-catenin signaling. Proc Natl Acad Sci U S A 2019;116:14019-28. 10.1073/pnas.1900997116 [DOI] [PMC free article] [PubMed] [Google Scholar]
- 21.Yang L, Zhang X, Li H, et al. The long noncoding RNA HOTAIR activates autophagy by upregulating ATG3 and ATG7 in hepatocellular carcinoma. Mol Biosyst 2016;12:2605-12. 10.1039/C6MB00114A [DOI] [PubMed] [Google Scholar]
- 22.Ge D, Han L, Huang S, et al. Identification of a novel MTOR activator and discovery of a competing endogenous RNA regulating autophagy in vascular endothelial cells. Autophagy 2014;10:957-71. 10.4161/auto.28363 [DOI] [PMC free article] [PubMed] [Google Scholar]
- 23.Luan F, Chen W, Chen M, et al. An autophagy-related long non-coding RNA signature for glioma. FEBS Open Bio 2019;9:653-67. 10.1002/2211-5463.12601 [DOI] [PMC free article] [PubMed] [Google Scholar]
- 24.Liu CY, Zhang YH, Li RB, et al. LncRNA CAIF inhibits autophagy and attenuates myocardial infarction by blocking p53-mediated myocardin transcription. Nat Commun 2018;9:29. 10.1038/s41467-017-02280-y [DOI] [PMC free article] [PubMed] [Google Scholar]
- 25.Wang LJ, Sun GZ, Chen YF. LncRNA MSTO2P promotes proliferation and autophagy of lung cancer cells by up-regulating EZH2 expression. Eur Rev Med Pharmacol Sci 2019;23:3375-82. [DOI] [PubMed] [Google Scholar]
- 26.Cho SH, Pak K, Jeong DC, et al. The AP2M1 gene expression is a promising biomarker for predicting survival of patients with hepatocellular carcinoma. Journal of Cellular Biochemistry 2019;120:4140-6. 10.1002/jcb.27699 [DOI] [PubMed] [Google Scholar]
- 27.Han M-E, Kim J-Y, Kim GH, et al. SAC3D1: a novel prognostic marker in hepatocellular carcinoma. Scientific Reports 2018;8:15608. 10.1038/s41598-018-34129-9 [DOI] [PMC free article] [PubMed] [Google Scholar]
- 28.Bensaad K, Vousden KH. p53: new roles in metabolism. Trends Cell Biol 2007;17:286-91. 10.1016/j.tcb.2007.04.004 [DOI] [PubMed] [Google Scholar]
- 29.Tasdemir E, Chiara Maiuri M, Morselli E, et al. A dual role of p53 in the control of autophagy. Autophagy 2008;4:810-4. 10.4161/auto.6486 [DOI] [PubMed] [Google Scholar]
- 30.Budanov AV, Karin M. p53 target genes sestrin1 and sestrin2 connect genotoxic stress and mTOR signaling. Cell 2008;134:451-60. 10.1016/j.cell.2008.06.028 [DOI] [PMC free article] [PubMed] [Google Scholar]
- 31.Tasdemir E, Maiuri MC, Galluzzi L, et al. Regulation of autophagy by cytoplasmic p53. Nat Cell Biol 2008;10:676-87. 10.1038/ncb1730 [DOI] [PMC free article] [PubMed] [Google Scholar]
- 32.Komarov PG, Komarova EA, Kondratov RV, et al. A chemical inhibitor of p53 that protects mice from the side effects of cancer therapy. Science 1999;285:1733-7. 10.1126/science.285.5434.1733 [DOI] [PubMed] [Google Scholar]
- 33.Qin Z, Zheng X, Fang Y. Long noncoding RNA TMPO-AS1 promotes progression of non-small cell lung cancer through regulating its natural antisense transcript TMPO. Biochem Biophys Res Commun 2019;516:486-93. 10.1016/j.bbrc.2019.06.088 [DOI] [PubMed] [Google Scholar]
- 34.Mu X, Wu H, Liu J, et al. Long noncoding RNA TMPO-AS1 promotes lung adenocarcinoma progression and is negatively regulated by miR-383-5p. Biomed Pharmacother 2020;125:109989. 10.1016/j.biopha.2020.109989 [DOI] [PubMed] [Google Scholar]
- 35.Peng F, Wang R, Zhang Y, et al. Differential expression analysis at the individual level reveals a lncRNA prognostic signature for lung adenocarcinoma. Mol Cancer 2017;16:98. 10.1186/s12943-017-0666-z [DOI] [PMC free article] [PubMed] [Google Scholar]
- 36.Cao Y, Zhu W, Chen W, et al. Prognostic Value of BIRC5 in Lung Adenocarcinoma Lacking EGFR, KRAS, and ALK Mutations by Integrated Bioinformatics Analysis. Disease Markers 2019;2019:5451290. 10.1155/2019/5451290 [DOI] [PMC free article] [PubMed] [Google Scholar]
- 37.Zhou L, Lu J, Liang ZY, et al. High nuclear Survivin expression as a poor prognostic marker in pancreatic ductal adenocarcinoma. J Surg Oncol 2018;118:1115-21. 10.1002/jso.25253 [DOI] [PubMed] [Google Scholar]
- 38.Tian QG, Wu YT, Liu Y, et al. Expressions and correlation analysis of HIF-1α, survivin and VEGF in patients with hepatocarcinoma. Eur Rev Med Pharmacol Sci 2018;22:3378-85. [DOI] [PubMed] [Google Scholar]
- 39.Hamy AS, Bieche I, Lehmann-Che J, et al. BIRC5 (survivin): a pejorative prognostic marker in stage II/III breast cancer with no response to neoadjuvant chemotherapy. Breast Cancer Res Treat 2016;159:499-511. 10.1007/s10549-016-3961-2 [DOI] [PubMed] [Google Scholar]
- 40.Shang X, Liu G, Zhang Y, et al. Downregulation of BIRC5 inhibits the migration and invasion of esophageal cancer cells by interacting with the PI3K/Akt signaling pathway. Oncol Lett 2018;16:3373-9. 10.3892/ol.2018.8986 [DOI] [PMC free article] [PubMed] [Google Scholar]
- 41.Duan L, Hu X, Jin Y, et al. Survivin protein expression is involved in the progression of non-small cell lung cancer in Asians: a meta-analysis. BMC Cancer 2016;16:276. 10.1186/s12885-016-2304-3 [DOI] [PMC free article] [PubMed] [Google Scholar]
- 42.Hu S, Qu Y, Xu X, et al. Nuclear survivin and its relationship to DNA damage repair genes in non-small cell lung cancer investigated using tissue array. PLoS One 2013;8:e74161. 10.1371/journal.pone.0074161 [DOI] [PMC free article] [PubMed] [Google Scholar]
- 43.Zhou C, Zhu Y, Lu B, et al. Survivin expression modulates the sensitivity of A549 lung cancer cells resistance to vincristine. Oncol Lett 2018;16:5466-72. 10.3892/ol.2018.9277 [DOI] [PMC free article] [PubMed] [Google Scholar]
- 44.Wang B, Li X, Zhao G, et al. miR-203 inhibits ovarian tumor metastasis by targeting BIRC5 and attenuating the TGFβ pathway. J Exp Clin Cancer Res 2018;37:235. 10.1186/s13046-018-0906-0 [DOI] [PMC free article] [PubMed] [Google Scholar]
- 45.Yang CT, Li JM, Li LF, et al. Stomatin-like protein 2 regulates survivin expression in non-small cell lung cancer cells through β-catenin signaling pathway. Cell Death Dis 2018;9:425. 10.1038/s41419-018-0461-9 [DOI] [PMC free article] [PubMed] [Google Scholar]
Associated Data
This section collects any data citations, data availability statements, or supplementary materials included in this article.
Supplementary Materials
The article’s supplementary files as


