

Abstract
Despite near-annual human outbreaks of Nipah virus (NiV) disease in Bangladesh, typically due to individual spillover events from the local bat population, only twenty whole-genome NiV sequences exist from humans and ten from bats. NiV whole-genome sequences from annual outbreaks have been challenging to generate, primarily due to the low viral load in human throat swab and serum specimens. Here, we used targeted enrichment with custom NiV-specific probes and generated thirty-five additional unique full-length genomic sequences directly from human specimens and viral isolates. We inferred the temporal and geographic evolutionary history of NiV in Bangladesh and expanded a tool to visualize NiV spatio-temporal spread from a Bayesian continuous diffusion analysis. We observed that strains from Bangladesh segregated into two distinct clades that have intermingled geographically in Bangladesh over time and space. As these clades expanded geographically and temporally, we did not observe evidence for significant branch and site-specific selection, except for a single site in the Henipavirus L polymerase. However, the Bangladesh 1 and 2 clades are differentiated by mutations initially occurring in the polymerase, with additional mutations accumulating in the N, G, F, P, and L genes on external branches. Modeling the historic geographical and temporal spread demonstrates that while widespread, NiV does not exhibit significant genetic variation in Bangladesh. Thus, future public health measures should address whether NiV within in the bat population also exhibits comparable genetic variation, if zoonotic transmission results in a genetic bottleneck and if surveillance techniques are detecting only a subset of NiV.
Keywords: Nipah virus, virus evolution, selective pressure, phylogeography
1. Introduction
Nipah (NiV) and Hendra (HeV) viruses are non-segmented negative-sense RNA viruses in the Paramyxoviridae family, Henipavirus genus that are carried by Pteropus spp. bats (Wang, Mackenzie, and Broder 2013). The Henipavirus genus consists of five species (Cedar, Kumasi, Mojiang, HeV, and NiV henipaviruses) ('ICTV Master Species List 2018b.v1' 2019)—HeV is carried by Pteropus bats in north eastern Australia and NiV is carried by Pteropus bats in south and south east Asia (including Thailand, Bangladesh, Cambodia, India, and Malaysia), while related paramyxoviruses have been recently identified in north eastern Australia (Cedar, CedV), Ghana (Kumasi, KV), and Yunnan Province, China (Mojiang, MojV) (Hsu et al. 2004; Reynes et al. 2005; Arankalle et al. 2011; Smith et al. 2011; Drexler et al. 2012; Marsh et al. 2012; Wacharapluesadee 2013; Wu et al. 2014; Arunkumar et al. 2019; Centers for Disease, Control, and Prevention 1999a). The prototypical species, HeV and NiV, encode six proteins, and an additional two proteins (V and W proteins) are produced from either transcriptional editing or an alternative start site (C protein) (Wang et al. 1998; Harcourt et al. 2000; Lo et al. 2009; Wang, Mackenzie, and Broder 2013). Currently, only NiV and HeV have been identified as causing human disease (Wang, Mackenzie, and Broder 2013). Symptoms of human disease consist of fever and features of encephalitis including headache, vomiting, altered mental status, and unconsciousness with a subset of patients presenting with pulmonary involvement and severe respiratory disease (Wang, Mackenzie, and Broder 2013).
NiV was first identified in Perak State, Malaysia in 1998 where it caused an outbreak among pigs and pig farmers (Centers for Disease, Control, and Prevention 1999a). Zoonotic transmission between Pteropus spp. bats and pigs spilled over into the human population and stopping the outbreak involved culling of over one million pigs (Centers for Disease, Control, and Prevention 1999b; Chua et al. 1999; Chua et al. 2000, 2002). Since its first appearance in 2001 in both Bangladesh and in nearby West Bengal, India (Hsu et al. 2004; Chadha et al. 2006), NiV outbreaks have been identified almost every year within the ‘NiV season’ of December to April (Harcourt et al. 2005; Luby et al. 2009; Homaira et al. 2010; Arankalle et al. 2011; Lo et al. 2012; Rahman et al. 2012; Islam et al. 2016). In Bangladesh, human infections were associated with close contact with infected individuals, including contact with corpses or consumption of fresh or fermented date palm sap that were likely contaminated with Pteropus excretia (Rahman et al. 2012; Sazzad et al. 2013; Chakraborty et al. 2016; Islam et al. 2016). In 2018, a NiV outbreak occurred in southern India in the Kozhikode District and Pteropus spp. bats were implicated as the source of the outbreak due to similarity between human and bat NiV sequences (Arunkumar et al. 2019; Yadav et al. 2019).
Limited sequence data from previous NiV outbreaks demonstrates that the virus clearly segregates into Malaysian (M), and Bangladesh (B) clades, with the recently collected Indian strains sharing a most recent common ancestor with Bangladeshi strains (Lo et al. 2012; Lo Presti et al. 2016; Arunkumar et al. 2019; Yadav et al. 2019; Li et al. 2020; Rahman et al. in preparation). Despite annual NiV outbreaks in Bangladesh, whole-genome sequences (WGS) from each Bangladesh outbreak do not currently exist and to date only twenty human (eight—Malaysia, eight—Bangladesh, four—India) sequences exist (Chan et al. 2001; Lo et al. 2012; Anderson et al. 2019; Yadav et al. 2019). The even more limited sequence information from Pteropus spp. bats demonstrates that partial N NiV bat sequences from Thailand/Cambodia are intermingled or form clonal isolates (Bangladesh) related to human sequences (Wacharapluesadee et al. 2010, 2016; Anderson et al. 2019). In Bangladesh, only ten nearly identical bat whole NiV genomes exist and these were collected at one location near the Bangladesh Nipah spillover area (Manikganj) and two locations outside this spillover area (Raipur and Sylhet) (Anderson et al. 2019).
While much is known about the epidemiology of NiV outbreaks in Malaysia, Bangladesh, and India, relatively little is known about the genetic and spatial relatedness of NiV within Bangladesh. It is currently unknown whether there are distinct subclades within Bangladesh, if these clades are separated by geography, how these hypothetical clades have spread over time, and whether the phylogenetic differences in human sequences is reflective of genetic variation in the bat population. A particular challenge to WGS NiV from human specimens is that throat swabs and serum specimens collected from patients typically have a high viral cycle threshold (Ct) value by diagnostic quantitative reverse-transcription PCR (qRT-PCR), indicative of a low viral load. Thus, genomes were either not generated from previous outbreaks, or phylogenies were constructed using partial genomes, which can lack the sequence variation needed to form trees with strong topological support.
In Bangladesh, meningo-encephalitis surveillance for NiV occurs at three hospitals: Rajshahi, Rangpur, and Faridpur Medical College. There is some debate as to the efficacy of the current NiV surveillance system in Bangladesh. Hegde et al. (2019) observed that 89 per cent of all outbreaks and 76 per cent of all cases were detected by the surveillance hospitals, with the remainder detected through other means. By modeling healthcare-seeking behavior with the distribution of observed NiV cases Hegde et al. (2019) further suggested that NiV surveillance within Bangladesh may miss nearly half of all Nipah outbreaks and that additional small clusters and sporadic cases may occur. To accommodate this uncertainty the surveillance area in Bangladesh has recently expanded to include additional healthcare sites.
Since 2006, blood, oral swab, urine, and cerebrospinal fluid have been collected from patients with encephalitis and during the ‘Nipah season’ from December to April these specimens are tested for NiV; outside of this time period they are tested for Japanese Encephalitis Virus. NiV infection is initially confirmed at The Institute for Epidemiology Disease Control and Research and re-confirmed at the US Centers for Disease Control and Prevention (CDC) using an IgM-capture enzyme immunoassay to detect NiV-specific IgM (Sazzad et al. 2015). Since 2012, acute infection is also confirmed using NiV-specific qRT-PCR testing of serum and oral swabs (Lo et al. 2012).
To better understand the genetic variation of NiV in Bangladesh and Malaysia, we WGS NiV from a subset of clinical specimens (n = 110) and viral isolates (n = 24, representing six outbreaks) stored in the CDC inventory (representing years 1999, 2004, 2008, and 2011–15). We provide thirty-five additional unique full-length genomes (twenty-two directly from Bangladeshi clinical specimens and thirteen viral isolates—six Malaysian and seven Bangladeshi) tripling the total count of full-length NiV genomes. Using these genomes, we explored how geographic, temporal, or other selective pressures contribute to the overall tree topology.
2. Materials and methods
2.1 Human subject requirements
This project was reviewed by the CDC National Center for Emerging and Zoonotic Infectious Diseases Human Subjects Team and determined to be non-research public health surveillance. Therefore, Institutional Review Board review was not required.
2.2 Next generation sequencing and genome assembly
RNA was extracted from clinical material (serum, urine, or throat swabs) (50, 100, 200, or 250 μl) or low passage viral isolates made from a freeze/thaw of virus-infected Vero E6 cell monolayers and supernatant (200 or 250 μl) using Tripure (Roche), followed by phase separation with 1-bromo-3-chloropane (Sigma-Aldrich). Input volumes of clinical specimens and viral isolates were scaled to prevent depletion of original material. RNA was extracted from the upper phase using Clean and Concentrate-25 columns (Zymo) and eluted in 40 or 50 μl of distilled water based on the volume of input material. RNA from specimens 201601138, 201601187, and 201601191 (100 μl) was extracted with MagMax 96 Viral Isolation kit (Applied Biosystems) and residual RNA from diagnostic RT-PCR were used for NGS (original clinical material was low or non-existent). RNA from viral isolates (808579, 808581, 808583, 805585, 808589, 808651, 808652, 810405, 810428, 810482, 810398, 811373, and 811375) was treated with RNase-free DNase (Roche) and libraries were prepared with NEBNExt Ultra II Directional library preparation kit (NEB). Duplicate libraries were prepared for a subset of specimens (201206313, 201302571, 201302591, 201601138, 201601187, 201601191, 812001, 811998) using Nextera XT library preparation kit (Illumina, Inc.) similar to Park et al. (2015). Ribosomal RNA was depleted from a subset of specimens (812001 and 811998) using rRNA depletion similar to Park et al., but was not used with subsequent samples because of the potential to deplete viral reads. RNA extracted from clinical specimens was treated with RNase-free DNase (Roche) and sequenced using TruSeq RNA Access Library preparation kit with NiV-specific enrichment oligos. NiV-specific enrichment probes were constructed using in-house scripts (github.com/evk3/Nipah_phylogenetics). A summary of specimens and sequencing methods can be found in Supplementary Table S1.
Viral genomes were assembled using viral-ngs, version 1.19.3 (Broad Institute) with a custom NiV-specific LASTAL database. Genomes with missing or incomplete coverage from viral-ngs were also assembled with an in-house pipeline (github.com/evk3/Nipah_phylogenetics) consisting of adaptor removal (cutadapt), quality trimming (prinseq-lite -min_qual_mean 25 -trim_qual_right 20 -min_len 50), read mapping (bwa mem) to a reference genome—MK673570 and basecalling with Geneious/v 10.2.3, (consensus threshold = majority base, >=two-fold coverage per base). Consensus genomes were built using the consensus genomes from both viral-ngs and in-house script pipelines. Ambiguous bases with low coverage were reviewed by hand (n = 5) and converted to N because an equal number of reads (two or four) prevented identification of a majority base. Full-length genomes containing complete or partial termini were submitted to GenBank (MK673558-92).
2.3 Strandedness analysis
Complete genomes from clinical specimens and viral isolates were aligned with MUSCLE in Geneious, version 11.1.2. and alignments were checked by eye. Genomes were aligned to ensure identical coordinates between individual genomes during downstream strandedness analysis. Using in-house scripts, reads were re-mapped to reference genomes and duplicates were removed with Picard. Read strandedness was assessed with a modified script (github.com/evk3/Nipah_phylogenetics) from Whitmer et al. (2018). Regions with missing coverage were removed from the resulting plot (24 bp from the 5′ end and 63 bp from the 3′ end, viral anti-genome, positive sense). Read strandedness was plotted using R, version 3.5.2.
2.4 Chimeric read analysis
Clinical specimens and a subset of viral isolates (808579, 808581, 808585, 808589, 808651, 810428) were treated with RNase-free DNase (Roche) and sequenced using TruSeq RNA Access Library preparation kit with NiV-specific enrichment oligos. Chimeric reads, indicative of defective or truncated genomes, were identified using chimeric_reads_v3.6.2.py (github.com/jtladner) from Whitmer et al. (2018). Read chimerism was plotted using R, version 3.5.2.
2.5 Recombination analysis
Evidence for viral recombination was assessed using RDP5.5 (Martin et al. 2015) using 1, an alignment of all available Henipavirus genomes and 2, NiV genomes from Bangladesh. Weak statistical support for recombination using all Henipavirus genomes was observed between closest relatives FN869553 and AJ627196. Using NiV genomes from Bangladesh we observed low support for recombination from only three tests (GENECONV, BootScan, and 3Sep; P values: 1.7*10−3, 8.6*10−4 and 1.4*10−5) for a breakpoint region 219 bp long. When the putative breakpoints were reviewed by hand, we observed no evidence for recombination with the identified major parent and recombinants (a minor parent was not identified). Furthermore, the putative recombination event occurred in a region with low genetic variation between nearest relatives, a common mis-interpretation for RDP5.5 (Martin et al. 2017).
2.6 Maximum likelihood phylogenies
Maximum likelihood phylogenies were constructed using raxmlHPC-PTHREADS/v7.3.0 with the GTRGAMMA model, a rapid Bootstrap analysis (n = 1,000 bootstrap replicates) and search for the best-scoring ML tree (-m GTRGAMMA -p $RANDOM -f a -x $RANDOM -N 1000). Phylogenies were visualized with R, treeio and ggtree (Wang et al. 2020; Yu 2020). Supplementary Fig. S3 was rooted to KF278639, BatPV and Supplementary Fig. S4C was midpoint rooted. All trees are displayed with nodes descending. Root-to-tip analyses were performed using a rooted ML tree with the TempEst software (Rambaut et al. 2016) and R, version 3.6.1 in a jupyter notebook.
2.7 Bayesian phylogenetic and phylogeographic analysis
Complete (18,246–18,252 bp), nearly complete NiV genomes (>18,000 bp) and partial N sequences were downloaded from GenBank in October 2018. Alignments were initially constructed by aligning with MUSCLE in Geneious, version 11.1.2. Coding and non-coding regions were split with in-house scripts from Ladner et al. (2015). Coding sequences were locally realigned by amino acid alignment and converted back to nucleotide alignments using translator.co.uk. Nucleotide substitution models were split into coding and non-coding regions. Bayesian analysis was performed with BEAST, version 1.8.4 and Tracer (Rambaut et al. 2018; Suchard et al. 2018) for 100 M iterations (logged every 10,000 states) with the HKY+Γ(4) nucleotide substitution model and an independent codon rate model comparing different clock (strict, relaxed uncorrelated lognormal clock) and demographic models [constant, exponential, skyline, and skygrid (fifty categories)]. Four-independent replicates were performed for each model tested and runs that mixed completely (‘hairy caterpillar’ traces) with similar log likelihood values were combined using LogCombiner v.1.8.4. Independent replicates for each model tested had effective sample size (ESS) values for posterior, prior, and likelihood that were >200 and burn-in (early states typically removed before chain reaches equilibrium, typically set at 10% of total states) was set at 10 per cent of the total states for each independent run. Path sampling and stepping stone analysis was performed for all parameter combinations tested and model fit was evaluated by Bayes Factor value comparison. Bayesian analysis was performed using: 1 all available full-length genomes (n = 63 total sequences, representing thirty-five new and twenty-eight publicly available sequences). Of the thirty-five new sequences (representing thirty-four individuals), thirteen were from viral isolates and twenty-two were sequenced directly from clinical specimens) (Fig. 2A and Supplementary Table S2); 2 a 729 bp fragment from the N gene (n = 63) (Supplementary Fig. S4A, Table S3, and Fig. 3A); and 3 a 357 bp N fragment containing additional sequences from Cambodia and Thailand (n = 90) (Supplementary Fig. S4B). All maximum clade credibility (MCC) trees are displayed with nodes descending. Bayesian continuous geographic diffusion was performed with BEAST, version 1.10.2 with the HKY+Γ(4) nucleotide substitution model, an independent codon rate model, a relaxed uncorrelated lognormal clock and skygrid demographic model (fifty categories) and different geographic diffusion (Brownian, Cauchy, Log, Gamma) models and operator models (Old vs. New) were compared (Supplementary Table S2). Analysis was performed with all available full-length genomes from Bangladesh with 100 M iterations (logged every 10,000 states). Four-independent replicates were performed for each model tested and data was analyzed as described above for full-length genome BEAST analysis. Path sampling and stepping stone analysis was performed for all parameter combinations tested and model fit was evaluated by Bayes Factor value comparison. Geographic spread from the continuous diffusion analysis was visualized using in-house scripts (github.com/evk3/Nipah_phylogenetics), which were initially built upon the curonia.py iPython notebook (github.com/evogytis) and EBOV_phylogeography_animation.ipynb from Dudas et al. (2017). Median branch velocities and diffusions coefficients were estimated from one hundred trees subsampled from the MCMC posterior distribution (similar to the SERAPHIM program (Dellicour et al. 2016)), where mean branch velocities and diffusions coefficients were calculated from each tree using:
where d is the great circle distance between parent and child nodes divided by the time separating parent and child nodes. Median and 95 per cent Highest Posterior Density (HPD) estimates were calculated from the one hundred mean estimates using numpy. These calculations were done separately for Bangladesh clades 1 and 2 and for all nodes. Geographic density of the internal and external Bangladesh nodes was calculated using Seaborn kdeplot for bivariate density with default parameters.
Figure 2.

Inferred phylogenetic history of NiV and HeV—full genomes. (A) MCC tree summarized from three independent BEAST runs of 100 M states each. Posterior support is included at major nodes, and leaves are colored according to host. Background highlighting and labels indicate major nodes. Tree includes sixty-three total sequences including thirty-five new (indicated by ** at the end of sequence names) and twenty-eight publicly available sequences. The thirty-five new sequences were from thirteen viral isolates, twenty-two clinical specimens and represent thirty-four unique individuals. (B) NiV Bangladesh sequences separate into two clades. B is an expansion of clades outlined with dotted box in A. (C) Effective population size (Ne) mean (dark lines) and standard deviation (light shading) estimates vs. time from MCC trees generated with the skygrid demographic models using full-genome alignments, or alignments of partial N fragments (729 and 357 bp).
Figure 3.

Geographic and temporal distribution of the Bangladesh 1 and 2 clades. (A) Geographic distribution of Bangladesh 1 and 2 clades over time. Locations of internal nodes (red, blue, or gray (root) triangles on map) and their 80 per cent HPD uncertainty estimates (blue or red transparent polygons) were estimated using BEAST/v1.10.2. Tiles represent selected frames of a movie iterating forward in time through the time-scaled phylogeny and Bangladesh map. Bangladesh clades 1 and 2 are blue and red, respectively. The MCC tree (n = 33 sequences) and node locations on the map are connected by moving red or blue curves. Round points on the map indicate external leaves and known geographic locations on the MCC tree. Alternating gray and white shading on the phylogenetic tree is time span in years. (B) Inhomogeneous spatial intensity of the Bangladesh 1 and 2 clades and internal node estimates. (C) Median branch velocity and 95 per cent HPD estimates from one hundred trees subsampled from the MCMC posterior distribution. (D) Median diffusion coefficients and 95 per cent HPD estimates from one hundred trees subsampled from the MCMC posterior distribution. (E) Maximal spatial wavefront distance from the estimated root location for all NiV sequences from the Bangladesh clade (purple line). Purple shading indicates 95 per cent HPD upper and lower estimates. Gradient of linear trendline (r2=0.92) is the invasion velocity (0.445 km/year).
2.8. Selection analysis
Selective pressures were evaluated using PAML, version 4.5 (Yang 2007) and renaissance counting in BEAST, version 1.8.4 (Lemey et al. 2012). Paml codeml, model0 was used to evaluate a uniform dN/dS estimate for each gene for the HeV and NiV species. The cladogram of the best fitting MCC tree made using full-length HeV and NiV genomes (described above, Supplementary Table S2) was used as input for paml codeml. Evidence for site-specific positive selection under variable selective pressure models was evaluated in the Henipavirus genus and NiV Bangladesh-specific sequences by comparing two different selective pressure models: 1 model 1a (null hypothesis) vs. 2a (alternative hypothesis) and 2 model 7 (null hypothesis) vs. 8 (alternative hypothesis). Significance values were evaluated using the 2Δlog-likelihood method (degrees of freedom = 2) and significance was established with χ2 values below 0.025 (P < 0.5, with Bonferroni correction applied for two tests run on same data sets). The Bayes empirical Bayes method of PAML was used to evaluate sites under selection. NextStrain (nextstrain.org) was used to identify branch–site-specific differences between the Bangladesh 1 and 2 clades.
Results from the PAML selective pressure analysis were compared with a second, but similar selective pressure analysis algorithm by using Renaissance counting. Renaissance counting was performed in BEAST, version 1.8.4 using all available full-length Henipavirus genes. Model parameters include the HKY nucleotide substitution model, UCLN clock set to an initial value of 5*10−3 subs/site/year, skygrid demographic model, and classic operator mix. Analysis was run for 100 M iterations (logged every 10,000 states) and eight-independent replicates were performed for each gene. Runs that mixed completely were combined with LogCombiner, v.1.8.4 (4–8 replicates per each gene) and analyzed as described above for full-length and partial genome BEAST analysis.
3. Results
3.1 Viral replication and chimeric reads observed in clinical specimens and viral isolates
In Bangladesh acute NiV infection is confirmed using NiV-IgM-specific capture ELISA and (since 2012) NiV-specific qRT-PCR. In general, we observed high Ct values from initial serum (33.94 ± 2.86) (n = 52) and initial throat swabs (33.00 ± 3.70) (n = 49) collected from sixty-three individuals, demonstrating a low concentration of viral RNA in clinical specimens when individuals first report to a clinic (Fig. 1). Ct values were not significantly different between sample matrices (P value = 0.2151).
Figure 1.
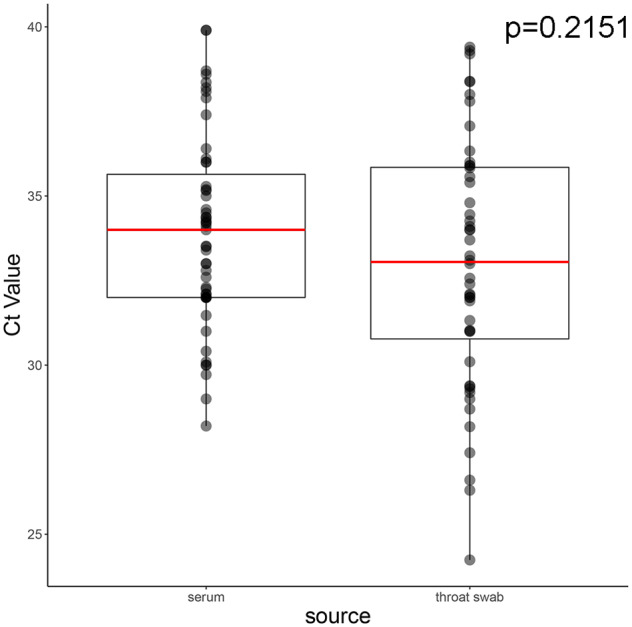
Ct value distribution from specimens collected during acute infection. Ct values were generated from serum and throat swab specimens collected at initial presentation to a clinic setting. Upper and lower hinges of box represent 25th and 75th quantiles and red line is sample median. Whiskers represent the upper and lower inter-quartile range * 1.5. Ct values were not significantly different between matrices (p = 0.2151, Wilcoxon rank sums test).
Previous work from O’Flaherty et al. (2018) and unpublished data from our previous work has identified that, without enrichment, sequencing RNA viruses from clinical specimens with Cts equal to or greater than thirty-two generally yields a partial genome. Therefore, we tested different targeted enrichment kits with custom NiV-specific probes to enrich for NiV nucleic acids prior to sequencing and we validated this approach using synthetic samples (NiV RNA added to RNA from human blood) designed to mimic clinical specimens with Ct values of 28 and 31 (Supplementary Fig. S1A). Since we observed a loss in full-genome coverage for synthetic samples with Ct = 31, we ranked clinical specimens collected in Bangladesh by Ct value and NiV WGS was attempted with specimens containing a Ct lower than thirty-three. We attempted sequencing on forty-five NiV positive specimens, consisting of both first passage viral isolates (n = 15) and clinical specimens (n = 30) (Supplementary Table S1). We generated thirty-nine partial or nearly complete viral sequences; the majority of complete viral genomes were generated from throat swab specimens or viral isolates. Using a stranded sequencing approach we verified the presence of positive-sense anti-genomic viral RNA, indicative of active replication in clinical specimens and viral isolates (Supplementary Fig. S1C), and observed minor differences in the distribution of chimeric reads (0.01% of total mapped reads) from clinical specimens or viral isolates (Supplementary Fig. S2). For clinical specimens, we observed a small number of reads containing deletions (n = 34) or duplications (n = 38) that span the region detected by our NiV diagnostic assay (Lo et al. 2012) However, compared to the total number of mapped reads (65 million) and total number of reads with secondary alignments (10,260), we do not think that these chimeric reads will significantly interfere with the NiV diagnostic assay results.
3.2 Inference of Henipavirus phylogeny including new Bangladeshi viral sequences
A maximum likelihood tree constructed from a full-genome alignment inferred strong bootstrap support for placing the new genomes within the Henipavirus genus, with more recently discovered Cedar and Mojiang viruses forming a consistent outgroup to NiV and HeV clades (Supplementary Fig. S3A). A time-scaled phylogeny (Fig. 2A and B) was consistent with the ML tree (Supplementary Fig. S3A). Model selection analysis comparing strict vs. relaxed (uncorrelated lognormal distribution, UCLN) clocks and different tree priors (constant, exponential, skyline, and skygrid) supported the UCLN skygrid/skyline models as better fits with Bayes Factor values ranging from 17 to 50 for path sampling and stepping stone statistics (Supplementary Tables S2 and S3). The phylogeny segregated into distinct HeV and NiV clades, while the NiV clade was further segregated by geographic region (India/Malaysia/Bangladesh) with the Bangladesh clade being further subdivided into two distinct clades (Fig. 2A and B)—posterior support for nodes defining these major clades was uniformly 1. Node age estimate for the Malaysia and Bangladesh/India split is 1,780 (1,642.587, 1,906 95% HPD), and for the 2018 Indian/Bangladesh sequences is 1,958 (1,986, 1,926 95% HPD). Node age estimates for the Bangladesh 1 and 2 split is 1,988 (1,998, 1,977 95% HPD). A relaxed substitution rate model was applied to the tree and the Bangladesh clade substitution rates was estimated to be 2.18 *10−4 subs/site/year (1.6–2.8 *10−4 subs/site/year, 95% HPD), which was similar to the estimate from a divergence vs. time analysis (1.45 *10−4 subs/site/year, Supplementary Fig. S3B). We did not observe a statistical difference between Bangladesh clade 1 (2.18 *10−4 subs/site/year 1.6–2.7 *10−4 subs/site/year, 95% HPD) and clade 2 (2.26 *10−4 subs/site/year 1.5–3.0 *10−4 subs/site/year, 95% HPD) substitution rate estimates. The coefficient of variation was 0.58 (0.33–0.82 95% HPD, ESS = 245), further supporting the use of a relaxed clock model, rather than a strict clock model.
Lo et al. (2012) proposed a 729 bp genotyping window in the N gene to differentiate between Malaysian and Bangladeshi viral sequences and we explored whether it could also differentiate the Bangladesh 1 and 2 clades. In agreement with Lo et al., the posterior support for the major nodes separating the HeV and NiV clades and the NiV Malaysian and Indian/Bangladesh clades were still well-supported. However, further node topology beyond these splits was not well-supported (–e.g. Bangladesh 1 vs. 2 clades) (Supplementary Fig. S4A).
Additional partial NiV genomes (N gene) have been generated from bats collected in Cambodia (Reynes et al. 2005), Indonesia (Sendow et al. 2013), and Thailand (Wacharapluesadee et al. 2005, 2010, 2013, 2016) and we explored the relationship of the new Bangladeshi sequences with viral sequences from bats. Bat sequences from Thailand were intermingled with the Malaysia and Bangladesh clades (an observation that was previously made by Wacharapluesadee et al. (2005)) (Supplementary Fig. S4B and C). Apart from the major Malaysia and Bangladesh nodes, we observed low topological support for trees constructed using ML and Bayesian methods (Supplementary Fig. S4B and C). Thus, while the partial N fragments can be used to genotype viruses at the major clade level (i.e. HeV vs. NiV, Malaysian vs. Bangladesh), it does not fully recapitulate full-genome genetic variation (Fig. 2C). If full-genome sequencing cannot be performed, inclusion of a second genotyping region to produce a supermatrix of partial genomes, along with supertree methods (WGS and supermatrix trees) could potentially improve the inference of NiV population structure.
3.3 Bangladesh clades 1 and 2 temporal and geographic distribution
Since sequences from Bangladesh segregated into two distinct clades, we explored whether geographic segregation could explain the tree topology (Fig. 3A). Our ability to generate complete viral genomes was limited by the high viral Ct values in clinical specimens, but we observed that the distribution of new viral sequences closely matches the known distribution of human NiV cases from Gurley et al. (2017) (Fig. 3B).
To explore the temporal and geographic distribution of NiV in Bangladesh, we performed a Bayesian continuous geographic analysis and inferred the geographic locations for internal nodes of the phylogenetic tree. Model selection analysis comparing different geographic expansion parameters supported the Cauchy relaxed random walk model as the best fit with Bayes Factor values ranging from 12.22 to 2.13 (Supplementary Table S2). We observed that initially the Bangladesh clades segregated into a north (Bangladesh 2) and south (Bangladesh 1) distribution, however the initial 80 per cent HPD estimate for the Bangladesh 2 clade also encompasses the Bangladesh 1 region (Fig. 3A, panel 1 and Movie 1). Over space and time the clades intermingled and we observed that by 2015 clade 2’s spatial distribution differed from that of clade 1, but partially overlapped in some regions (Fig. 3B). However, branch velocity and diffusivity did not significantly differ between clades 1 and 2 (branch velocity: 14.35 km/year, 5.73–27.47 km/year 95% HPD clade 1 vs. 17.76 km/year, 8.15–38.17 km/year 95% HPD clade 2) (diffusivity: 171.9 km2/year, 107.3–274.7 km2/year 95% HPD clade 1 vs. 455.6 km2/year, 190.0–1,023.9 km2/year 95% HPD clade 2) (Fig. 3C and D). Total branch velocity was 16.11 km/year (7.75–33.32 km/year 95% HPD) and diffusivity was 318.2 km2/year (165.6–616.6 km2/year 95% HPD). The spatial wavefront invasion velocity (i.e.total distance from root location/time) was 0.445 km/year (Fig. 3E)—compared to the mean branch velocity, this data suggests viral diffusion within an endemic area, instead of continual range expansion. The geographic boundaries inferred for the internal nodes closely match the distribution of known NiV cases, bats and sap consumption (Gurley et al. 2017), supporting the robustness of the Bayesian modeling.
Movie 1.

Bayesian continuous diffusion analysis of NiV expansion in Bangladesh. Locations of internal nodes (red, blue or gray (root) triangles on map) and their 80 per cent HPD uncertainty estimates (blue or red transparent polygons) were estimated using BEAST/v1.10.2. The frames of the movie iterate forward in time through the time-scaled phylogeny and Bangladesh map. Bangladesh clades 1 and 2 are blue and red, respectively. The MCC tree and node locations on the map are connected by moving red or blue curves. Large points on the map indicate external leaves and known geographic locations on the MCC tree. Alternating gray and white shading on the phylogenetic tree is time span in years.
3.4 Henipavirus selective pressures
Since Bangladesh clades 1 and 2 are intermingled geographically and temporally we explored whether they experienced different selective pressures. Using two different methods, we observed that all Henipavirus genes experience negative selection (Fig. 4A). Comparisons of the HeV and NiV clades, NiV Malaysia and NiV Bangladesh clades, and Bangladesh 1 and 2 clades did not support a significant difference in selective pressures between the respective clades (Fig. 4B and Supplementary Fig. S5A and B). We also evaluated positive site-specific selective pressures using PAML and renaissance counting and observed weak positive selection occurring in the N and L genes, but not in other genes (Table 1 and Supplementary Table S4). Site 642 M in the viral polymerase L gene exhibited positive selection (or a lack of negative selection) that was strongly supported by PAML and moderately supported by renaissance counting (Table 1). The Bangladesh 1 and 2 clades did not exhibit selective pressure differences, and the L gene had the one of the lower dN/dS rates. However, we did identify Bangladesh 1 and 2 clade-defining mutations within the polymerase (relative to 2018 Indian sequences), that are suggestive of directional, rather than diversifying selection (Fig. 4C). Additional L, G, and F mutations are observed on internal Bangladesh clade 1 or 2 nodes, while non-fixed mutations are observed on external nodes (Supplementary Fig. S5C and D).
Figure 4.

Selection in the HeV/NiV species and NiV Bangladesh clade. (A) Comparison of selective pressures for all available full-length Henipaviruses under a single dN/dS model (model 0, PAML) and variable dN/dS model (renaissance counting). (B) Comparison of selective pressures between Bangladesh clades 1 and 2 using a variable dN/dS model (renaissance counting). (C) Mutations within the polymerase define the Bangladesh 1 and 2 clades. ML tree constructed using full-length sequences from the Bangladesh clades (n = 37 total sequences including twenty-nine new sequences indicated by ** at the end of sequence names). Bootstrap support greater than 70 per cent is annotated at all nodes (purple).
Table 1.
Sites under selection in the Henipavirus genus.
| Gene | Model | Sites | ω ±SE | Mean posterior prob. |
|---|---|---|---|---|
| N | PAML, M7: beta vs. M8: beta + ω | 500 P | 1.582 ± 0.767 | 0.814 |
| N | PAML, M7: beta vs. M8: beta + ω | 506 D | 1.466 ± 0.796 | 0.74 |
| N | PAML, M7: beta vs. M8: beta + ω | 512 K | 1.654 ± 0.791 | 0.852 |
| L | PAML, M7: beta vs. M8: beta + ω | 642 M | 1.427 ± 0.259 | 0.914 |
| L | PAML, M7: beta vs. M8: beta + ω | 658 R | 1.274 ± 0.429 | 0.766 |
| L | PAML, M7: beta vs. M8: beta + ω | 1645 F | 1.386 ± 0.335 | 0.882 |
|
| ||||
| Model | Site | ω (95% CPD) | ||
|
| ||||
| N | Renaissance Counting | 512 | 0.73 (0.50–1.11) | |
| L | Renaissance Counting | 642 | 0.67 (0.45–1.04) | |
4. Discussion
Here, we inferred the evolutionary relationships of historical NiV strains. Prior to this work, a limited number of NiV sequences were available from Bangladesh, despite near-annual human outbreaks of NiV disease. Now, we have a detailed understanding that NiV human-derived strains in Bangladesh segregate into two distinct clades that have intermingled over time and space yet have not exhibited significant branch- and site-specific selection (except for limited sites in the N and L genes). These clades are differentiated by mutations initially occurring in the polymerase, with additional mutations accumulating in the N, P, G, F, and L genes.
The biological implications of two distinct NiV-human-derived clades are currently unknown. NiV outbreaks occur almost every year within Bangladesh and the index cases for outbreaks are individuals that typically consume fresh or fermented date palm sap that is likely contaminated with Pteropus excretia (Harcourt et al. 2005; Luby et al. 2009; Homaira et al. 2010; Arankalle et al. 2011; Lo et al. 2012; Rahman et al. 2012; Sazzad et al. 2013; Chakraborty et al. 2016; Islam et al. 2016). Only a single Pteropus species (Pteropus medius) is endemic to Bangladesh (Olival et al. 2020), leading us to hypothesize that two cryptic Pteropus species in Bangladesh may transmit the virus to humans or, conversely, P.medius carries two NiV substrains that were independently introduced into Bangladesh. Olival et al. present genetic evidence that P.medius populations in Bangladesh cluster into three separate (P.medius, P.lylei and P.vampyrus) lineages, providing evidence to support at least three cryptic species in Bangladesh (53). As an additional consideration, human-derived NiV genetic variation may not fully represent bat-derived NiV genetic variation and a host restriction could limit zoonotic bat to human transmission (i.e. a genetic bottleneck). To confirm this hypothesis, additional surveillance is needed to assess NiV variation in the bat population. Such additional surveillance can also confirm whether current NiV molecular and serological diagnostics are detecting the majority or only a subset of NiV variants. For example, Olival et al. (2020) demonstrate that sampling Pteropus bats outside of the ‘Nipah Belt’ detected a novel NiV variant in the Comilla district.
Pteropus species movement in Bangladesh has not been closely documented, however, studies from related species indicates that food and roost availability can influence dispersal and migration patterns. Across southeast Asia and Australia Pteropus species have been documented to forage within 0 or 6–8 km from the roost (Jones and Kuntz 2000; Roberts et al. 2012). Telemetry studies in Australia demonstrate that over 1 week, median net displacement was 0 km, but this value increases to 147 km/10 weeks (Roberts et al. 2012) and in Malaysia, Pteropus long distance travel rates of 87.5 km/day and 363 km/4 days have been recorded (Epstein 2009). Pteropus movement in Bangladesh needs better tracking, but we hypothesize that bat movement may closely follow NiV spread; mean branch velocity was 16.11 km/year (7.75–33.32 km/year 95% HPD), and spatial wavefront velocity was 0.445 km/year, suggesting regional NiV spread, but slow NiV wavefront expansion. Within West Bengal, India Pteropus forms large roosts near bodies of water (Dey, Roy, and Chattopadhyay 2013), and disruption of habitat, either through hunting or habitat loss (food or roost availability) could increase bat dispersal and bat-human interactions. While bats are evenly distributed across Bangladesh (Gurley et al. 2017), the clade 1 distribution (Fig. 4B) is distinct from clade 2, but overlaps in some regions, suggesting that dispersal of clades 1 and 2 across Bangladesh could occur by two different Pteropus populations. Alternatively, antibody-mediated protection within the Pteropus (or human) population could also lead to the distribution see in Fig. 4B— a single non-synonymous change was identified in the Fusion protein (an externally displayed protein) for most members of clade 1.
Similar to Lo Presti et al. (2016) and Li et al. (2020), we observed that most Henipavirus genes experience negative selection. The Bangladesh 1 and 2 clades are differentiated by mutations initially occurring in the L polymerase (K112R, N639D, LT665I, and T94I), however, these mutations are outside of the six conserved linear domains within the polymerases of all negative-stranded RNA viruses, but where mutations have accumulated in HeV relative to NiV (upstream of domain 1 and between domains II and III) (Harcourt et al. 2001). Therefore, these regions may be more tolerant of genetic drift, or could represent adaptation to the host bat species. The remaining non-synonymous changes are on branches leading to external nodes or nodes associated with a specific outbreak. These mutations likely reflect genetic variation within the local transmitting bat population that have not been completely pruned by negative selection. Furthermore, mean substitution rate estimates 10.1 * 10−4 (WGS, limited sequences) vs. 6.5 * 10−4 (partial N) vs. 2.18 *10−4 (WGS, here), observed here and by others (Lo Presti et al. 2016; Li et al. 2020) support the conclusion that NiV evolves relatively slower than viruses with similar genomes (e.g. Ebola virus (Dudas et al. 2017)).
Vector-mediated spread of other viruses also exhibit similarities to NiV replication and spread. For example, yellow fever virus (YVF) exhibits both sylvatic (replication in mosquitos/primates with occasional spillover into humans—similar to bat NiV spillover) and urban (human–mosquito–human transmission) outbreaks (Auguste et al. 2010). Time-scaled phylogenies constructed using YVF partial prM/E sequences [3.7 * 10−4 subs/site/year (2.6–5.1 * 10−4), 95% HPD] and full-length E sequences [2.1 * 10−4 substitutions/site/year (1.0–3.3 * 10−4 subs/site/year), 95% HPD] exhibit mutation rates within a similar range as NiV [2.18 *10−4 subs/site/year (1.6–2.8 * 10−4 subs/site/year), 95% HPD] (Auguste et al. 2010; Sall et al. 2010). For YVF this reduced substitution rate is attributed to reduced generation time and fewer opportunities to mutate per unit time—possibly due to vertical transmission. Extending similar concepts to NiV, a reduced substitution rate could result from slow/persistent viral replication in the bat vector. It is worth noting that the NiV substitution rate estimates presented here may not accurately represent bat and human NiV population rate estimates, since our new NiV Bangladesh sequences are only from human samples, and additional NiV genetic variation may exist in the bat population.
Phylogeographic reconstructions for other endemic viruses have observed that landscape, vector–human interactions, selective pressures, and human behaviors can also influence viral phylogenies and spread (Holmes 2004; Talbi et al. 2010; Brunker et al. 2018; Faria et al. 2019). For example, YVF sylvatic spread in the Americas has an estimated dispersal rate of 182 km/year (Auguste et al. 2010), whereas during a 2016–7 outbreak in Brazil mean branch velocity increased to 4.24 km/day (Faria et al. 2018). In contrast, NiV mean branch velocity was 16.11 km/year (7.75–33.32 km/year 95% HPD)—a difference that may reflect mosquito (YVF) versus bat (NiV) mediated viral spread. We also explored the diffusivity of NiV compared to other mosquito and mammalian-borne diseases. NiV diffusivity was 318.2 km2/year (165.6–616.6 km2/year 95% HPD), which was similar to the unweighted diffusivity observed with WNV (200 km2/year) (Pybus et al. 2012), but slower than skunk, racoon, bat, and dog RABV diffusion (NiV weighted diffusion: 290.0 km2/year, 192–445 km2/year 95% HPD vs. 983, 1,127, 1,051, and 2,874 km2/year) (Dellicour et al. 2017). NiV invasion velocity was also considerably slower than RABV mammalian-borne spread (4, 6, 15–22, and 20 km/year for spread in bats, skunks, dogs, and racoons) (Dellicour et al. 2017). Thus, NiV sequences generated directly from human specimens suggests that NiV diffusion is slower than RABV mammalian-borne spread.
Herein, we acknowledge the implicit biases and limitations to our modeling. NiV surveillance within Bangladesh may miss additional small clusters and sporadic cases, as projected by Hegde et al. (2019), and limited data would skew the NiV distributions presented here. Furthermore, this study focused primarily on human-derived NiV sequences, and limited bat-derived WGS has been performed (Anderson et al. 2019). Additional bat-derived sequences are needed to elucidate whether additional NiV clades exist, and whether the Bangladesh 1 and 2 clades are the only NiV clades capable of spilling over into the human population.
Overall, our spatio-temporal modeling identified that human-derived NiV segregates into two distinct clades in Bangladesh that are intermingled geographically and temporally. Thus, a re-examination of meta- and epidemiological data should be considered in this new context. For example, it is currently unknown whether the clades 1 and 2 genotypes translate into different phenotypes, such as differences in human-to-human transmission rates, pathology, morbidity, and mortality. In this context, our phylogeny tracing tool can be easily modified to incorporate and visualize additional spatial attributes and/or meta-data. In light of the data presented here, future public health measures should address whether NiV within in the bat population also exhibits comparable genetic variation, if zoonotic transmission results in a genetic bottleneck and if surveillance techniques are detecting only a subset of NiV.
Data availability
Full-length genomes are available at GenBank (MK673558-92). Scripts and data analysis programs are available at: github.com/evk3/Nipah_phylogenetics.
Supplementary data
Supplementary data are available at Virus Evolution online.
Funding
This research was supported with core funding provided to the Viral Special Pathogens Branch.
Conflict of interest: The authors declare that they have no competing interests. The findings and conclusions in this report are those of the authors and do not necessarily represent the official position of the Centers for Disease Control and Prevention.
Supplementary Material
References
- Anderson D. E. et al. (2019) ‘Isolation and Full-genome Characterization of Nipah Viruses from Bats, Bangladesh’, Emerging Infectious Diseases, 25: 166–70. [DOI] [PMC free article] [PubMed] [Google Scholar]
- Arankalle V. A. et al. (2011) ‘Genomic Characterization of Nipah Virus, West Bengal, India’, Emerging Infectious Diseases, 17: 907–9. [DOI] [PMC free article] [PubMed] [Google Scholar]
- Arunkumar G. et al. (2019) ‘Outbreak Investigation of Nipah Virus Disease in Kerala, India, 2018’, The Journal of Infectious Diseases, 219: 1867–78. [DOI] [PubMed] [Google Scholar]
- Auguste A. J. et al. (2010) ‘Yellow Fever Virus Maintenance in Trinidad and Its Dispersal throughout the Americas’, Journal of Virology, 84: 9967–77. [DOI] [PMC free article] [PubMed] [Google Scholar]
- Brunker K. et al. (2018) ‘Landscape Attributes Governing Local Transmission of an Endemic Zoonosis: Rabies Virus in Domestic Dogs’, Molecular Ecology, 27: 773–88. [DOI] [PMC free article] [PubMed] [Google Scholar]
- Centers for Disease, Control, and Prevention. (1999a) ‘Outbreak of Hendra-like Virus—Malaysia and Singapore, 1998–1999’, Morbidity and Mortality Weekly Report, 48: 265–9. [PubMed] [Google Scholar]
- Centers for Disease, Control, and Prevention. (1999b) ‘Update: Outbreak of Nipah Virus—Malaysia and Singapore, 1999’, Morbidity and Mortality Weekly Report, 48: 335–7. [PubMed] [Google Scholar]
- Chadha M. S. et al. (2006) ‘Nipah Virus-Associated Encephalitis Outbreak, Siliguri, India’, Emerging Infectious Diseases, 12: 235–40. [DOI] [PMC free article] [PubMed] [Google Scholar]
- Chakraborty A. et al. (2016) ‘Evolving Epidemiology of Nipah Virus Infection in Bangladesh: Evidence from Outbreaks during 2010–2011’, Epidemiology and Infection, 144: 371–80. [DOI] [PMC free article] [PubMed] [Google Scholar]
- Chan Y. P. et al. (2001) ‘Complete Nucleotide Sequences of Nipah Virus Isolates from Malaysia’, Journal of General Virology, 82: 2151–5. [DOI] [PubMed] [Google Scholar]
- Chua K. B. et al. (1999) ‘Fatal Encephalitis Due to Nipah Virus among Pig-Farmers in Malaysia’, The Lancet, 354: 1257–9. [DOI] [PubMed] [Google Scholar]
- Chua K. B. et al. (2000) ‘Nipah Virus: A Recently Emergent Deadly Paramyxovirus’, Science, 288: 1432–5. [DOI] [PubMed] [Google Scholar]
- Chua K. B. et al. (2002) ‘Isolation of Nipah Virus from Malaysian Island Flying-Foxes’, Microbes and Infection, 4: 145–51. [DOI] [PubMed] [Google Scholar]
- Dellicour S. et al. (2016) ‘SERAPHIM: Studying Environmental Rasters and Phylogenetically Informed Movements’, Bioinformatics, 32: 3204–6. [DOI] [PubMed] [Google Scholar]
- Dellicour S. et al. (2017) ‘Using Viral Gene Sequences to Compare and Explain the Heterogeneous Spatial Dynamics of Virus Epidemics’, Molecular Biology and Evolution, 34: 2563–71. [DOI] [PubMed] [Google Scholar]
- Dey S., Roy U. S., Chattopadhyay S. (2013) ‘ 'Distribution and Abundance of Three Populations of Indian Flying Fox (Pteropus giganteus) From Purulia district of West Bengal, India’, Taprobanica: The Journal of Asian Biodiversity, 5: 60–6. [Google Scholar]
- Drexler J. F. et al. (2012) ‘Bats Host Major Mammalian Paramyxoviruses’, Nature Communications, 3: 796. [DOI] [PMC free article] [PubMed] [Google Scholar]
- Dudas G. et al. (2017) ‘Virus Genomes Reveal Factors That Spread and Sustained the Ebola Epidemic’, Nature, 544: 309–15. [DOI] [PMC free article] [PubMed] [Google Scholar]
- Epstein J. H. et al. (2009) ‘Pteropus vampyrus, a Hunted Migratory Species with a Multinational Home-range and a Need for Regional Management’, Journal of Applied Ecology, 46: 991–1002. [Google Scholar]
- Faria N. R. et al. (2018) ‘Genomic and Epidemiological Monitoring of Yellow Fever Virus Transmission Potential’, Science, 361: 894–9. [DOI] [PMC free article] [PubMed] [Google Scholar]
- Faria N. R. et al. (2019) ‘Distinct Rates and Patterns of Spread of the Major HIV-1 Subtypes in Central and East Africa’, PLoS Pathogens, 15: e1007976. [DOI] [PMC free article] [PubMed] [Google Scholar]
- Gurley E. S. et al. (2017) ‘Convergence of Humans, Bats, Trees, and Culture in Nipah Virus Transmission, Bangladesh’, Emerging Infectious Diseases, 23: 1446–53. [DOI] [PMC free article] [PubMed] [Google Scholar]
- Harcourt B. H. et al. (2000) ‘Molecular Characterization of Nipah Virus, a Newly Emergent Paramyxovirus’, Virology, 271: 334–49. [DOI] [PubMed] [Google Scholar]
- Harcourt B. H. et al. (2001) ‘Molecular Characterization of the Polymerase Gene and Genomic Termini of Nipah Virus’, Virology, 287: 192–201. [DOI] [PubMed] [Google Scholar]
- Harcourt B. H. et al. (2005) ‘Genetic Characterization of Nipah Virus, Bangladesh, 2004’, Emerging Infectious Diseases, 11: 1594–7. [DOI] [PMC free article] [PubMed] [Google Scholar]
- Hegde S. T. et al. (2019) ‘Using Healthcare-seeking Behaviour to Estimate the Number of Nipah Outbreaks Missed by Hospital-based Surveillance in Bangladesh’, International Journal of Epidemiology, 48: 1219–27. [DOI] [PMC free article] [PubMed] [Google Scholar]
- Holmes E. C. (2004) ‘The Phylogeography of Human Viruses’, Molecular Ecology, 13: 745–56. [DOI] [PubMed] [Google Scholar]
- Homaira N. et al. (2010) ‘Nipah Virus Outbreak with Person-to-person Transmission in a District of Bangladesh, 2007’, Epidemiology and Infection, 138: 1630–6. [DOI] [PMC free article] [PubMed] [Google Scholar]
- Hsu V. P. et al. (2004) ‘Nipah Virus Encephalitis Reemergence, Bangladesh’, Emerging Infectious Diseases, 10: 2082–7. [DOI] [PMC free article] [PubMed] [Google Scholar]
- ‘ICTV Master Species List 2018b.v1’. ( 2019) International Committee on Taxonomy of Viruses (ICTV) <https://talk.ictvonline.org/files/master-species-lists/m/msl/8266> accessed May 2019.
- Islam M. S. et al. (2016) ‘Nipah Virus Transmission from Bats to Humans Associated with Drinking Traditional Liquor Made from Date Palm Sap, Bangladesh, 2011–2014’, Emerging Infectious Diseases, 22: 664–70. [DOI] [PMC free article] [PubMed] [Google Scholar]
- Jones D. P., Kuntz T. H. (2000) ‘Pteropus hypomelanus’, Mammalian Species, 639: 1–6. [Google Scholar]
- Ladner J. T. et al. (2015) ‘Evolution and Spread of Ebola Virus in Liberia, 2014–2015’, Cell Host & Microbe, 18: 659–69. [DOI] [PMC free article] [PubMed] [Google Scholar]
- Lemey P. et al. (2012) ‘A Counting Renaissance: Combining Stochastic Mapping and Empirical Bayes to Quickly Detect Amino Acid Sites under Positive Selection’, Bioinformatics, 28: 3248–56. [DOI] [PMC free article] [PubMed] [Google Scholar]
- Li K. et al. (2020) ‘Emergence and Adaptive Evolution of Nipah Virus’, Transboundary and Emerging Diseases, 67: 121–32. [DOI] [PMC free article] [PubMed] [Google Scholar]
- Lo M. K. et al. (2009) ‘Determination of the Henipavirus Phosphoprotein Gene mRNA Editing Frequencies and Detection of the C, V and W Proteins of Nipah Virus in Virus-infected Cells’, Journal of General Virology, 90: 398–404. [DOI] [PubMed] [Google Scholar]
- Lo M. K. et al. (2012) ‘Characterization of Nipah Virus from Outbreaks in Bangladesh, 2008–2010’, Emerging Infectious Diseases, 18: 248–55. [DOI] [PMC free article] [PubMed] [Google Scholar]
- Lo Presti A. et al. (2016) ‘Origin and Evolution of Nipah Virus’, Journal of Medical Virology, 88: 380–8. [DOI] [PubMed] [Google Scholar]
- Luby S. P. et al. (2009) ‘Recurrent Zoonotic Transmission of Nipah Virus into Humans, Bangladesh, 2001–2007’, Emerging Infectious Diseases, 15: 1229–35. [DOI] [PMC free article] [PubMed] [Google Scholar]
- Marsh G. A. et al. (2012) ‘Cedar Virus: A Novel Henipavirus Isolated from Australian Bats’, PLoS Pathogens, 8: e1002836. [DOI] [PMC free article] [PubMed] [Google Scholar]
- Martin D. P. et al. (2015) ‘RDP4: Detection and Analysis of Recombination Patterns in Virus Genomes’, Virus Evolution, 1: vev003. [DOI] [PMC free article] [PubMed] [Google Scholar]
- Martin D. P. et al. (2017) ‘Detecting and Analyzing Genetic Recombination Using RDP4’, Methods in Molecular Biology, 1525: 433–60. [DOI] [PubMed] [Google Scholar]
- O'Flaherty B. M. et al. (2018) ‘Comprehensive Viral Enrichment Enables Sensitive Respiratory Virus Genomic Identification and Analysis by Next Generation Sequencing’, Genome Research, 28: 869–77. [DOI] [PMC free article] [PubMed] [Google Scholar]
- Olival K. J. et al. (2020) ‘Population Genetics of Fruit Bat Reservoir Informs the Dynamics, Distribution and Diversity of Nipah Virus’, Molecular Ecology, 29: 970–85. [DOI] [PubMed] [Google Scholar]
- Park D. J. et al. (2015) ‘Ebola Virus Epidemiology’, Cell, 161: 1516–26. [DOI] [PMC free article] [PubMed] [Google Scholar]
- Pybus O. G. et al. (2012) ‘Unifying the Spatial Epidemiology and Molecular Evolution of Emerging Epidemics’, Proceedings of the National Academy of Sciences, 109: 15066–71. [DOI] [PMC free article] [PubMed] [Google Scholar]
- Rahman M. A. et al. (2012) ‘Date Palm Sap Linked to Nipah Virus Outbreak in Bangladesh, 2008’, Vector-Borne and Zoonotic Diseases, 12: 65–72. [DOI] [PubMed] [Google Scholar]
- Rahman M. Z. et al. (in preparation) ‘Genetic Diversity of Nipah Virus in Bangladesh’. [DOI] [PubMed]
- Rambaut A. et al. (2016) ‘Exploring the Temporal Structure of Heterochronous Sequences Using TempEst (Formerly Path-O-Gen)’, Virus Evolution, 2: vew007. [DOI] [PMC free article] [PubMed] [Google Scholar]
- Rambaut A. et al. (2018) ‘Posterior Summarization in Bayesian Phylogenetics Using Tracer 1.7’, Systematic Biology, 67: 901–4. [DOI] [PMC free article] [PubMed] [Google Scholar]
- Reynes J. M. et al. (2005) ‘Nipah Virus in Lyle's Flying Foxes, Cambodia’, Emerging Infectious Diseases, 11: 1042–7. [DOI] [PMC free article] [PubMed] [Google Scholar]
- Roberts B. J. et al. (2012) ‘Long-distance and Frequent Movements of the Flying-fox Pteropus poliocephalus: Implications for Management’, PLoS One, 7: e42532. [DOI] [PMC free article] [PubMed] [Google Scholar]
- Sall A. A. et al. (2010) ‘Yellow Fever Virus Exhibits Slower Evolutionary Dynamics than Dengue Virus’, Journal of Virology, 84: 765–72. [DOI] [PMC free article] [PubMed] [Google Scholar]
- Sazzad H. M. et al. (2013) ‘Nipah Virus Infection Outbreak with Nosocomial and Corpse-to-human Transmission, Bangladesh’, Emerging Infectious Diseases, 19: 210–7. [DOI] [PMC free article] [PubMed] [Google Scholar]
- Sazzad H. M. et al. (2015) ‘Exposure-based Screening for Nipah Virus Encephalitis, Bangladesh’, Emerging Infectious Diseases, 21: 349–51. [DOI] [PMC free article] [PubMed] [Google Scholar]
- Sendow I. et al. (2013) ‘Nipah Virus in the Fruit Bat Pteropus vampyrus in Sumatera, Indonesia’, PLoS One, 8: e69544. [DOI] [PMC free article] [PubMed] [Google Scholar]
- Smith I. et al. (2011) ‘Identifying Hendra Virus Diversity in Pteropid Bats’, PLoS One, 6: e25275. [DOI] [PMC free article] [PubMed] [Google Scholar]
- Suchard M. A. et al. (2018) ‘Bayesian Phylogenetic and Phylodynamic Data Integration Using BEAST 1.10’, Virus Evolution, 4: vey016. [DOI] [PMC free article] [PubMed] [Google Scholar]
- Talbi C. et al. (2010) ‘Phylodynamics and Human-mediated Dispersal of a Zoonotic Virus’, PLoS Pathogens, 6: e1001166. [DOI] [PMC free article] [PubMed] [Google Scholar]
- Wacharapluesadee S. et al. (2005) ‘Bat Nipah Virus, Thailand’, Emerging Infectious Diseases, 11: 1949–51. [DOI] [PMC free article] [PubMed] [Google Scholar]
- Wacharapluesadee S. et al. (2010) ‘A Longitudinal Study of the Prevalence of Nipah Virus in Pteropus lylei Bats in Thailand: Evidence for Seasonal Preference in Disease Transmission’, Vector-Borne and Zoonotic Diseases, 10: 183–90. [DOI] [PubMed] [Google Scholar]
- Wacharapluesadee S. et al. (2013) ‘Genetic Characterization of Nipah Virus from Thai Fruit Bats (Pteropus lylei)’, Asian Biomedicine, 7: 813–9. [Google Scholar]
- Wacharapluesadee S. et al. (2016) ‘Molecular Characterization of Nipah Virus from Pteropus hypomelanus in Southern Thailand’, Virology Journal, 13: 53. [DOI] [PMC free article] [PubMed] [Google Scholar]
- Wang L. F. et al. (1998) ‘A Novel P/V/C Gene in a New Member of the Paramyxoviridae Family, Which Causes Lethal Infection in Humans, Horses, and Other Animals’, Journal of Virology, 72: 1482–90. [DOI] [PMC free article] [PubMed] [Google Scholar]
- Wang L. F., Mackenzie J. S., Broder C. C. (2013) ‘Henipaviruses’, in Knipe D. M., Howley P. M. (eds.), Fields Virology, 6th edn. Philadelphia, PA: Wolters Kluwer Lippincott Williams and Wilkins. [Google Scholar]
- Wang L. G. et al. (2020) ‘Treeio: An R Package for Phylogenetic Tree Input and Output with Richly Annotated and Associated Data’, Molecular Biology and Evolution, 37: 599–603. [DOI] [PMC free article] [PubMed] [Google Scholar]
- Whitmer S. L. M. et al. (2018) ‘Active Ebola Virus Replication and Heterogeneous Evolutionary Rates in EVD Survivors’, Cell Reports, 22: 1159–68. [DOI] [PMC free article] [PubMed] [Google Scholar]
- Wu Z. et al. (2014) ‘Novel Henipa-like Virus, Mojiang Paramyxovirus, in Rats, China, 2012’ Emerging Infectious Diseases, 20: 1064–6. [DOI] [PMC free article] [PubMed] [Google Scholar]
- Yadav P. D. et al. (2019) ‘Nipah Virus Sequences from Humans and Bats during Nipah Outbreak, Kerala, India, 2018’, Emerging Infectious Diseases, 25: 1003–6. [DOI] [PMC free article] [PubMed] [Google Scholar]
- Yang Z. (2007) ‘PAML 4: Phylogenetic Analysis by Maximum Likelihood’, Molecular Biology and Evolution, 24: 1586–91. [DOI] [PubMed] [Google Scholar]
- Yu G. (2020) ‘Using Ggtree to Visualize Data on Tree-like Structures’, Current Protocols in Bioinformatics, 69: e96. [DOI] [PubMed] [Google Scholar]
Associated Data
This section collects any data citations, data availability statements, or supplementary materials included in this article.
Supplementary Materials
Data Availability Statement
Full-length genomes are available at GenBank (MK673558-92). Scripts and data analysis programs are available at: github.com/evk3/Nipah_phylogenetics.