

Abstract
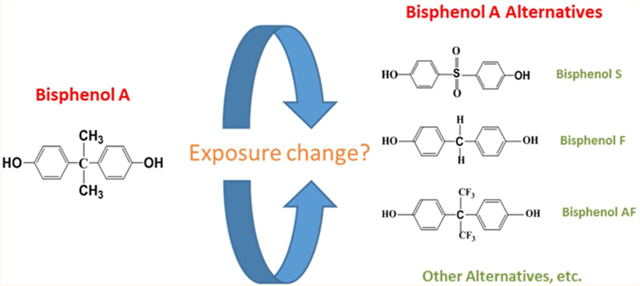
Because of regulatory actions and public concerns, the use of bisphenol A (BPA) may decrease, while the use of BPA alternatives may increase. Although BPA alternatives are considered safer than BPA, their effects on health are still largely unknown. For risk assessment, understanding exposure to these chemicals is necessary. We measured the urinary concentrations of BPA and three bisphenol analogs, bisphenol S (BPS), bisphenol F (BPF), and bisphenol AF (BPAF), in 616 archived samples collected from convenience samplings of U.S. adults at eight time points between 2000 and 2014. We detected BPA at the highest frequency and geometric mean (GM) concentrations (74–99%, 0.36–2.07 μg/L), followed by BPF (42–88%, 0.15–0.54 μg/L) and BPS (19–74%, < 0.1–0.25 μg/L); BPAF was rarely detected (<3% of all samples). Although concentrations of BPF were generally lower than for other bisphenols, the 95th percentile concentration of BPF was often comparable or higher than that of BPA. We did not observe obvious exposure trends for BPF. However, the significant changes in GM concentrations of BPA and BPS suggest that exposures may be declining (BPA) or on the rise (BPS). Nationally representative data will be useful to confirm these findings and to allow monitoring future exposure trends to BPA and some of its bisphenol alternatives.
Graphical Abstract
INTRODUCTION
Bisphenol A (2,2-bis(4-hydroxyphenyl)-propane, BPA) is one of the highest production-volume chemicals.1 BPA, primarily used to manufacture polycarbonate plastic and epoxy resins, can also be used in the processing of polyvinyl chloride plastic and of thermal paper.2 Diet is the main pathway of exposure to BPA.2,3 Several food regulatory agencies around the world (e.g., the European Food Safety Authority, Health Canada, and the U.S. Food and Drug Administration) have determined that BPA poses no health risk to the general population from current dietary exposures.4–6 However, concerns over potential health risks of BPA in sensitive populations, particularly infants and young children, have led to restrictions on the use of BPA in certain baby and children products in different countries, including the United States, Canada, France, and other European Union countries, Australia, Japan, and Turkey.6–9In response to these restrictions and public pressure, the use of BPA alternatives may increase. BPA alternatives include bisphenol analogs, such as bisphenol S (BPS, 4,4′-sulfonyldiphenol), bisphenol F (BPF, 4,4′-dihydroxydiphenylmethane), and bisphenol AF (BPAF, 2,2-bis(4-hydroxyphenyl)-hexafluoropropane),2 and other chemicals or products (e.g., ether sulfone, styrene, ethylene terephthalate, and Tritan).10
BPS has been used as an alternative of BPA in the production of baby bottles11 and thermal paper,12,13 and all three bisphenol analogs are used in the manufacture of certain plastics and epoxy resins.2 BPS has been detected in currency bills from 21 countries and in thermal receipt paper and airplane luggage tags from the United States;14 BPS was also reported to leach from food cans.15 BPS, BPF, and BPAF were detected in indoor dust samples in the United States and seven Asian countries16 as well as in food and beverages.17
Information on the bioactivity of these bisphenol analogs is rather limited, but the estrogenic and genotoxic activities of BPS and BPA are reportedly similar.18,19 BPS can disrupt nongenomic signaling pathways in cultured estrogen-responsive pituitary cells20 and can irreversibly bind to human serum albumin.21 BPAF can bind to the estrogen receptor α and function as an endocrine-disrupting chemical.22 BPAF was nominated by the U.S. National Toxicology Program for comprehensive toxicological characterization.23 In vitro studies suggest that BPF could interfere with specific cellular processes and possessed weak estrogenic activity, although BPF estrogenic activity was lower than that of BPA.24 BPF also exhibited cytotoxicity and genotoxicity in HepG2 cells.25
In the United States, data on human exposure to BPA are available since 2003–2004 through the National Health and Nutrition Examination Survey (NHANES), conducted by the U.S. Centers for Disease Control and Prevention (CDC); NHANES data show that more than 90% of Americans have detectable concentrations of BPA in their urine.26 However, exposure data on bisphenol analogs are rather limited and unavailable from NHANES. To date, one study reported detecting BPS in convenience human populations from eight different countries, with the highest urinary geometric mean (GM) concentrations in Japanese (1.18 μg/L), followed by American populations (0.299 μg/L).27 A recent study investigated the exposure to bisphenol analogs in residents living near a BPAF manufacturing plant in south China; urinary concentrations of BPS, BPF, BPA, and BPAF ranged from below the limit of quantification (0.024–0.310 μg/L, depending on the compound) to a few μg/L.28 Nonetheless, exposure data to BPS and other bisphenol analogs in the general population are scarce. To fill in this gap, we quantified concentrations of BPA, BPF, BPS, and BPAF in urine collected anonymously at eight time points between 2000 and 2014 from U.S. adults and compared the urinary concentrations of BPA and its analogs during this period of time.
MATERIALS AND METHODS
Urine Collection.
For this study, we used 616 archived spot urine specimens (stored at −70 °C until analysis) collected anonymously from convenience samples of U.S. male and female adult volunteers in Atlanta, GA in 2000, 2001, 2007, 2009, 2010, 2011, 2013, and 2014. We cannot rule out the possibility that the same donor contributed urine in different collection years or in multiple urine specimens, albeit on different days and at different time of day, during a given collection year. The number of samples varied from 27 (2007) to 141 (2013), depending on the year (Table 1). Study participants had no documented occupational exposure to the target analytes, and no personal and demographic data were available. Urine samples were collected between 8:00 a.m. and 5:00 p.m. CDC’s Subjects Institutional Review Board reviewed and approved the study protocol. A waiver of informed consent was requested under 45 CFR 46.116(d).
Table 1.
Geometric Mean (95th Confidence Interval) and Select Percentiles of Total Concentrations of Bisphenol A, Bisphenol F, Bisphenol S, and Bisphenol AF per Collection Yeara
| select percentiles (μg/L) | ||||||
|---|---|---|---|---|---|---|
| analyte | year | number of samples | frequency of detection (%) | GM (95th CI), μg/L | 50th | 95th |
| bisphenol A | 2000 | 79 | 97 | 1.34 (0.17–10.70) | 1.3 | 7.4 |
| 2001 | 67 | 99 | 1.29 (0.11–14.68) | 1.3 | 11.6 | |
| 2007 | 27 | 81 | 0.74 (<LOD-14.97) | 0.8 | 4.7 | |
| 2009 | 122 | 98 | 1.34 (<LOD-20.89) | 1.3 | 11.4 | |
| 2010 | 43 | 98 | 2.07 (0.45–9.48) | 2.0 | 8.7 | |
| 2011 | 95 | 99 | 0.96 (0.15–6.11) | 0.8 | 4.9 | |
| 2013 | 141 | 97 | 0.67 (<LOD-4.94) | 0.6 | 3.9 | |
| 2014 | 42 | 74 | 0.36 (<LOD-5.21) | 0.5 | 1.7 | |
| bisphenol F | 2000 | 79 | 84 | 0.34(0.25–0.45) | 0.3 | 6.9 |
| 2001 | 67 | 63 | 0.30 (0.19–0.45) | 0.2 | 10.8 | |
| 2007 | 27 | 63 | 0.16 90.11–0.23) | 0.2 | 0.7 | |
| 2009 | 122 | 75 | 0.54 (0.39–0.75) | 0.4 | 11.7 | |
| 2010 | 43 | 44 | 0.17 (0.11–0.26) | <LOD | 1.9 | |
| 2011 | 95 | 42 | 0.15 (0.12–0.20) | <LOD | 1.5 | |
| 2013 | 141 | 50 | 0.18 (0.14–0.23) | <LOD | 6.6 | |
| 2014 | 42 | 88 | 0.41(0.28–0.61) | 0.3 | 9.1 | |
| bisphenol S | 2000 | 79 | 25 | NCb | <LOD | 0.3 |
| 2001 | 67 | 19 | NC | <LOD | 0.7 | |
| 2007 | 27 | 22 | NC | <LOD | 1.2 | |
| 2009 | 122 | 73 | 0.18 (<LOD-1.16) | 0.1 | 1.1 | |
| 2010 | 43 | 65 | 0.17 (<LOD-1.21) | 0.1 | 1 | |
| 2011 | 95 | 63 | 0.17 (<LOD-1.38) | 0.1 | 1.5 | |
| 2013 | 141 | 74 | 0.22 (<LOD-1.73) | 0.2 | 1.3 | |
| 2014 | 42 | 74 | 0.25 (<LOD-3.06) | 0.2 | 1.8 | |
| bisphenol AF | 2000 | 79 | 0 | NC | <LOD | <LOD |
| 2001 | 67 | 0 | NC | <LOD | <LOD | |
| 2007 | 27 | 0 | NC | <LOD | <LOD | |
| 2009 | 122 | 2 | NC | <LOD | <LOD | |
| 2010 | 43 | 0 | NC | <LOD | <LOD | |
| 2011 | 95 | 1 | NC | <LOD | <LOD | |
| 2013 | 141 | 1 | NC | <LOD | <LOD | |
| 2014 | 42 | 0 | NC | <LOD | <LOD | |
GM, geometric mean; CI, confidence interval; LOD, limit of detection. LOD = 0.1 μg/L for all four analytes.
NC, not calculated. The GM (95th CI) of BPS (years 2000, 2001, and 2007) and BPAF (all years) were not calculated because the proportion of results below LOD was too high to provide a valid result.
Chemicals and Reagents.
BPA, BPS, BPF, BPAF, 4-methylumbelliferyl glucuronide, 4-methylumbelliferyl sulfate, ammonium acetate (>98%), and β-glucuronidase/sulfatase (Helix pomatia, H1) were purchased from Sigma-Aldrich Laboratories, Inc. (St. Louis, MO, USA). 13C12–BPA and 13C4-4-methylumbelliferone were obtained from Cambridge Isotope Laboratories, Inc. (Andover, MA, USA), and 13C12–BPS and 13C12–BPF were purchased from CanSyn Chem Corp. (Toronto, Canada). We used 13C12–BPA as the internal standard for BPAF. Optima LC/MS grade methanol was purchased from Fisher Scientific (Pittsburgh, PA, USA). HPLC-grade formic acid (98%) was purchased from EM Science (Gibbstown, NJ, USA).
Analytical Method.
We quantified the total (conjugated plus free species) and free urinary concentrations of BPA, BPS, BPF, and BPAF by a modification of the online solid-phase extraction coupled to isotope-dilution high-performance liquid chromatography–tandem mass spectrometry (online SPE–HPLC–MS/MS) method described previously.29 The system consisted of several Agilent 1200 modules (Agilent Technologies, Wilmington, DE, USA) and an ABSciex 5500 QTRAP mass spectrometer (Applied Biosystems, Foster City, CA, USA), and was designed to allow for concurrent SPE and HPLC-MS/MS cycles with peak focusing (i.e., diluting the SPE elute before HPLC).29 Briefly, to estimate the total concentrations, the conjugates of BPA, BPS, BPF, and BPAF present in 100 μL of urine were first enzymatically hydrolyzed. The target analytes were then extracted by online SPE (LiChrospher RP-18 ADS, Merck KGaA, Germany), resolved by HPLC (Chromolith High-Resolution RP-18e, Merck KGaA, Germany), and detected by MS/MS with negative-atmospheric-pressure chemical ionization. During the enzymatic hydrolysis, 4-methylumbelliferone glucuronide and 4-methylumbelliferyl sulfate hydrolyzed similarly to the conjugated phenols; thus, we used the peak area ratio of the 4-methylumbelliferone/13C4-4-methylumbelliferone to monitor the extent of the deconjugation.29 To quantitate the urinary concentrations of free species, we followed the same procedure described above but skipped the enzymatic hydrolysis step. The limits of detection (LODs) were calculated as 3S0, where S0 is the standard deviation as the concentration approaches 0.30 The LOD for all four analytes was 0.1 μg/L. Information about preparation of standards and quality control (QC) materials and calculation of LODs are described in the Supporting Information. The analytical method was fully validated (see details in the Supporting Information); accuracy (percent of spike recovery) and precision (relative standard deviation from repeated measurements of QC materials over one month) varied from 91% to 107% and 5% to 11%, respectively, depending on the analyte (see the Supporting Information). To ensure data accuracy and precision, we included QC samples, standards, and reagent blanks in each batch of samples. We prepared standards, QCs, and reagent blanks using the same procedure as described above for the study samples to be analyzed for total concentrations but replaced the urine with the same volume of mixed standard stock solution, QC materials, and HPLC-grade H2O (reagent blank). The calibration curve, obtained from standards spiked in water with concentrations ranging from 0.01 μg/L to 100 μg/L, was weighted by the reciprocal of the standard amount (1/x) for quantification (see the Supporting Information). The QC concentrations were evaluated using standard statistical probability rules,31 and all laboratory operations were conducted under the requirements set forth by the Clinical Laboratory Improvement Act of 1988.
Statistical Analysis.
For statistical analyses, we used SAS (version 9.2, SAS Institute, Cary, NC). We calculated the frequency of detection, GM, and distribution percentiles of the volume-based (in μg/L) concentrations. For concentrations below the LOD, we used a value equal to the LOD divided by the square root of 2.32 Because urinary concentrations of bisphenols were not normally distributed, we used their log 10 transformation. Statistical significance was set at p < 0.05. For the trend analysis, we used a simple linear regression in which the log10 urinary bisphenol concentration was the dependent variable and the year of urine collection was the independent variable. We also compared the linear regression models with different imputation methods for nondetectable concentrations (i.e., numerical instrumental readings, LOD divided by square root of 2) for trend analyses.33 We evaluated the downward trend of GM concentration of BPA from its highest point (2010) to 2014. Similarly, we evaluated the trend of GM concentration of BPS from 2010 to 2014.
RESULTS AND DISCUSSION
We measured the urinary concentrations of BPA, BPS, BPF, and BPAF in 616 samples collected in 2000, 2001, 2007, 2009, 2010, 2011, 2013, and 2014 from convenience groups of anonymous U.S. male and female adults. Because BPA and its analogues are rapidly metabolized through phase II biotransformation to facilitate urinary excretion,34 these urinary concentrations reflect recent exposures to the bisphenols (most likely within 24 h). BPA was detected most frequently, while BPAF was detected in fewer than 3% of the samples. Depending on the collection year, the detection frequencies ranged from 74% to 99% (BPA), 42% to 88% (BPF), 19% to 74% (BPS), and 0% to 2% (BPAF) (Table 1). BPA was also detected at the highest total concentrations; the urinary GM and median BPA total concentrations varied from 0.36 to 2.07 μg/L and from 0.5 to 2.0 μg/L, respectively (Table 1).
Interestingly, we observed a significant downward trend (p <0.001, β coefficient = −0.34) of the urinary GM total concentration of BPA from 2010 (2.07 μg/L) to 2014 (0.36 μg/L) (Figure 1A, Table 1) using numerical readings for nondetected results. This trend significance was not changed when the nondetected results were imputed with the LOD divided by the square root of 2 (p < 0.0001, β coefficient = −0.23). Although samples were collected in a 14 year time period, all of the urine samples analyzed for this study were collected from similar groups of people who worked at the same location. Furthermore, a previous report indicated that at subfreezing temperatures, conjugated BPA (the major species of urinary BPA) was stable up to at least 30 months after collection.35 Therefore, for the archived samples used for the current study, we expected a negligible degradation of BPA conjugates (to free BPA) during storage. Even if some degradation to free BPA did occur, because we measured the total (free plus conjugated) urinary BPA concentration, degradation would not have contributed to the observed downward trend of GM total concentration. For the above reasons, we speculate that the apparent decline in the urinary GM total concentration of BPA may be explained, at least in part, by reduced human exposure to BPA because in recent years, several U.S. companies have pledged to remove BPA from its food packaging36 and thermal receipt paper and other paper products.37
Figure 1.
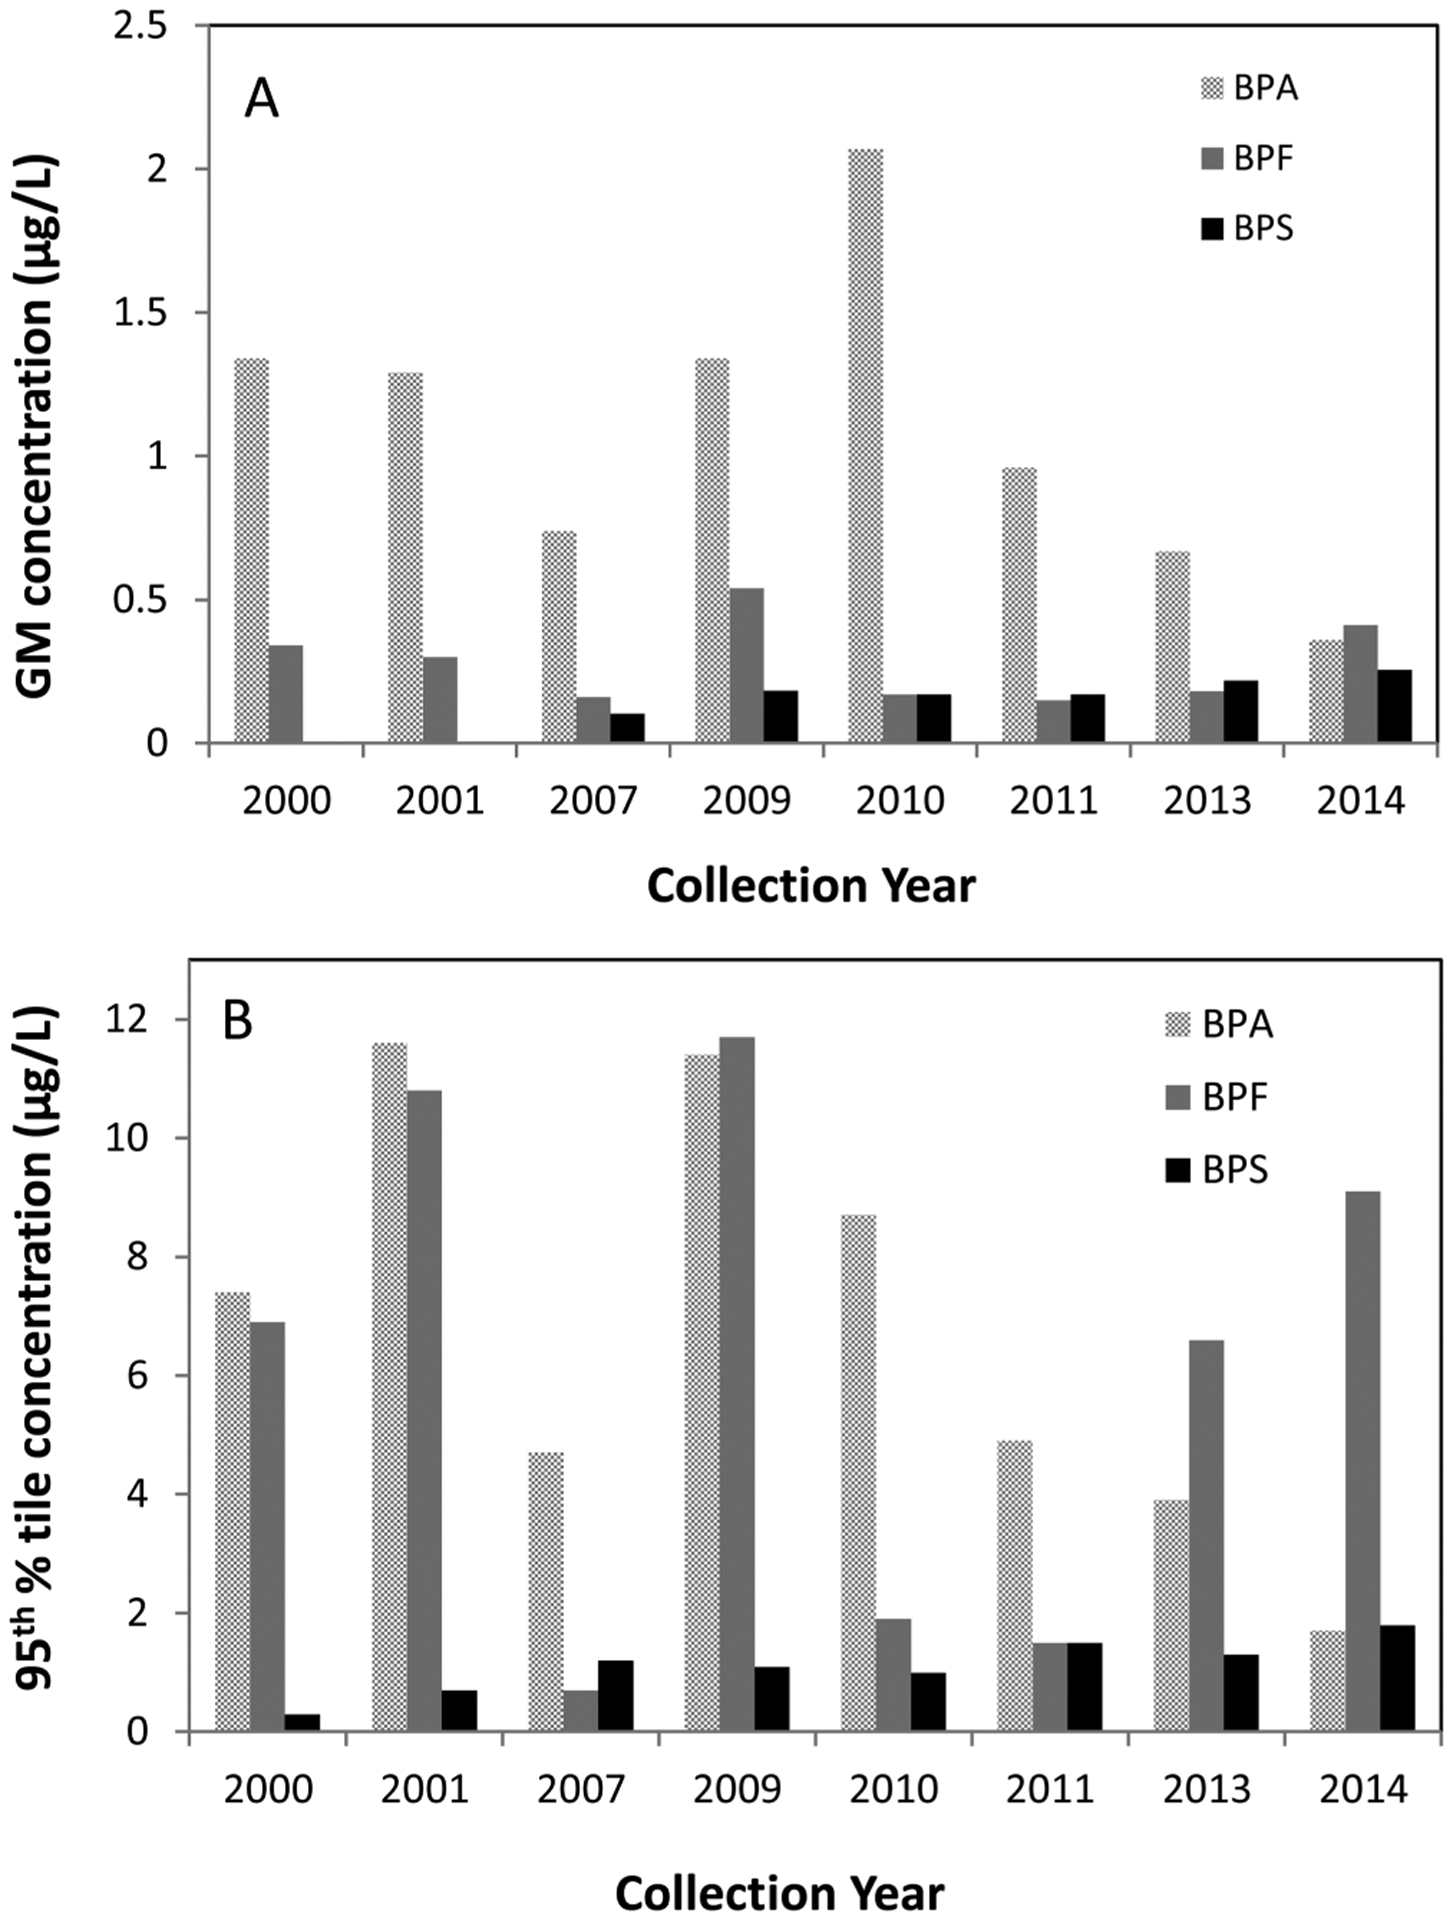
Urinary geometric mean (GM) (A) and 95th percentile (B) total concentrations of bisphenol A, bisphenol F, and bisphenol S (in μg/L) by collection year in convenience samples of American adults.
The detection frequency, GM, and the median total urinary concentrations of BPS were lower than those of BPA (Table 1). Interestingly, we observed a slight upward trend in GM concentration of BPS (p = 0.04, β coefficient = 0.15) in 2010–2014, using numerical readings for nondetected results, during the time when BPA concentrations in the same group of samples declined (Table 1, Figure 1A). This trend significance remained the same when nondetected results were imputed with the LOD divided by the square root of 2 instead of numerical readings (p = 0.017, β coefficient = 0.07). Furthermore, the detection frequency of BPS also increased from 25% in 2000 to 74% in 2014 (Table 1). The upward trend of GM concentration and detection frequency of BPS may reflect increased human exposure to this chemical in recent years. For example, due to concerns about the potential adverse health effects of BPA, a major manufacturer of thermal receipt papers in the United States reported replacing BPA with BPS starting in 2006.13 In a recent study, BPS was detected in all thermal receipt paper, and in other paper products, such as tickets, mailing envelopes, airline boarding passes, and luggage tags collected in the United States and several other countries.14 BPS was also detected in 97% of 31 urine samples from the United States, with a GM concentration at 0.299 μg/L;27 the urinary GM concentration of BPS from 2010 to 2011 in our study was 0.17 μg/L.
BPF has been used with BPA to make epoxy resins and coatings for various applications, such as lacquers, varnishes, liners, adhesives, plastics, water pipes, dental sealants, and food packaging.38 However, compared to data on BPA, human exposure data on BPF are scarce. BPF was detected in fewer than 30% of urine samples collected in June 2013 from residents living near a BPAF manufacturing plant in south China;28 with a similar LOD, we detected BPF more frequently (>50% except in 2010 and 2011) in the present study (Table 1). However, the urinary GM total concentrations of BPF, which varied from 0.15 μg/L to 0.54 μg/L (Table 1), were lower than those of BPA. Although the median and GM total concentrations of BPA were the highest among the bisphenols evaluated in the present study (Table 1, Figure 1B), the 95th percentile concentration of BPF was comparable or higher than that of BPA in most samples except those collected in 2007, 2010, and 2011 (Figure 1B). In contrast to BPA and BPS, we did not observe any specific trend for either the GM urinary total concentration or detection frequency of BPF from 2000 to 2014 (Table 1, Figure 1A).
Interestingly, despite the fact that BPAF has been detected in the environment and in food,16,17 we detected BPAF in fewer than 3% of the samples examined and at relatively low concentrations (<0.1 to 0.12 μg/L). These results suggest lower human exposure to BPAF than to the other bisphenols or that BPAF may not be a suitable biomarker of exposure to this chemical.
Because of the ubiquitous presence of BPA and its analogs in the environment, external contamination during sample collection, handling, and analysis could compromise the biomonitoring of these chemicals.39 To confirm the suitability of the archived specimens we used for this study, we also quantitated the free urinary concentrations of BPA, BPS, and BPF in the samples with total concentrations above the 95th percentile for each collection year. We calculated the concentration of conjugates from the total and free concentrations. In the 77 samples tested for free species, the mean conjugate percent (mean ratio of conjugated to total concentration) was 97% (BPA), 93% (BPS), and 92% (BPF). The fact that the conjugates, which could only form through metabolism, were the main species in these samples, suggest that the total concentrations measured in the current study reflect real exposures to BPA, BPS, and BPF, and not external contamination.39
In summary, we measured the urinary concentrations of BPA and three bisphenol alternatives (BPF, BPS, BPAF) in 616 archived urine samples collected from U.S. adults at eight time points between 2000 and 2014. Compared to the detection of BPA, we detected BPS and BPF less frequently and at lower GM total concentrations. The detection frequency of BPS increased from 2000 to 2014. Since 2010, we observed a downward trend of BPA GM total concentrations and a concomitant slight upward trend of BPS. NHANES data suggesting that BPA GM concentrations in 2011–2012 have decreased since they were first measured in 2003–200426 do support our findings, but our results should be interpreted with caution for the following reasons. First, we did not correct the concentrations for urinary dilution. However, concentration trends based on geometric means for most nonpersistent biomarkers, including BPA, do not change appreciable whether adjusted for urinary dilution or not.26 Second, although we analyzed a fairly large number of samples (∼600), the number of samples by collection year was relatively small, and the study participants were all from one specific U.S. location and collection site. Furthermore, the participants might have contributed multiple samples, thus further decreasing the number of participants in this exposure study. The overall investigation period spanned 14 years, but we only had samples for eight of the collection years. The anonymous nature of the collection and lack of participants’ demographic data (i.e., age, sex, and ethnicity) prevented the evaluation of determinants of exposure to these bisphenols. Last, the concentrations of the alternative bisphenols were rather low and, in several cases, close to the LOD. For the above reasons, the observed suggestive temporal trends only apply to the specific group of adults examined and may not apply to the general population. Nonetheless, despite these limitations, our study provided useful information on human exposure to alternative bisphenols. Concerns on the potential adverse health effects of bisphenols and other BPA alternatives warrant large-scale biomonitoring studies that can provide useful information for better understanding the general public’s exposure to these chemicals.
Supplementary Material
ACKNOWLEDGMENTS
This work was supported in part by the appointment of J.K. to the Research Participation Program at the Centers for Disease Control and Prevention (CDC), administered by the Oak Ridge Institute for Science and Education through an interagency agreement between the U.S. Department of Energy and the CDC. The findings and conclusions in this report are those of the authors and do not necessarily represent the official position of the CDC. The authors complied with all needed research requirements regarding human subjects.
ABBREVIATIONS:
- BPA
bisphenol A
- BPAF
bisphenol AF
- BPF
bisphenol F
- BPS
bisphenol S
- CDC
Centers for Disease Control and Prevention
- CI
confidence interval
- GM
geometric mean
- LOD
limit of detection
- NHANES
National Health and Nutrition Examination Survey
- Online SPE–HPLC–MS/MS
online solid-phase extraction high-performance liquid chromatography–tandem mass spectrometry
- QC
quality control
Footnotes
Supporting Information
The Supporting Information is available free of charge on the ACS Publications website at DOI: 10.1021/acs.est.5b02135.
Additional information on the analytical method for the preparation of stock solutions and quality control materials, the limits of detection, and method validation; tables showing accuracy obtained from spike recovery and precision obtained from 20 repeat measurements of quality control materials. (PDF)
The authors declare no competing financial interest.
REFERENCES
- (1).Vandenberg LN; Chahoud I; Heindel JJ; Padmanabhan V; Paumgartten FJR; Schoenfelder G Urinary, Circulating, and Tissue Biomonitoring Studies Indicate Widespread Exposure to Bisphenol A. Environ. Health Perspect 2010, 118, 1055–1070. [DOI] [PMC free article] [PubMed] [Google Scholar]
- (2).National Toxicology Program. NTP Brief on Bisphenol A [CAS NO. 80-05-07]. http://ntp.niehs.nih.gov/ntp/ohat/bisphenol/bisphenol.pdf (accessed March 2, 2015). [Google Scholar]
- (3).WHO. Joint WHO/FAO Expert Meeting to Review Toxicological and Health Aspects of Bisphenol A: Summary Report including Report of Stakeholder Meeting on Bisphenol A. http://apps.who.int/iris/bitstream/10665/44624/1/97892141564274_eng.pdf (accessed March 3, 2015).
- (4).European Food Safety Authority. EFSA Topic: Bisphenol A. http://www.efsa.europa.eu/en/topics/topic/bisphenol.htm (accessed March 11, 2015). [Google Scholar]
- (5).Health Canada. Health Canada’s Updated Assessment of Bisphenol A (BPA) Exposure from Food Sources. http://www.hc-sc.gc.ca/fn-an/securit/packag-emball/bpa/bpa_hra-ers-2012-09-eng.php#a3 (accessed March 2, 2015).
- (6).U.S. Food and Drug Administration. Bisphenol A (BPA): Use in Food Contact Application. http://www.fda.gov/food/ingredientspackaginglabeling/foodadditivesingredients/ucm064437.htm (accessed May 3, 2015).
- (7).U.S. Department of Agriculture. Proposed Bisphenol A ban in food packaging would impact U.S. exports to France. http://gain.fas.usda.gov/Recent%20GAIN%20Publications/Proposed%20Bisphenol%20A%20ban%20in%20food%20packaging%20would%20mean%20impacts%20on%20U.S_Paris_France_2-6-2012.pdf (accessed February 1, 2015).
- (8).Health Canada. Survey of bisphenol A in canned drink products. http://www.hc-sc.gc.ca/fn-an/securit/packag-emball/bpa/bpa_survey-enquete-can-eng.php (accessed September 12, 2012).
- (9).European Commission. Bisphenol A: EU ban on baby bottles to enter into force tomorrow. http://europa.eu/rapid/press-release_IP-11-664_en.htm (accessed May 31, 2011).
- (10).Bittner GD; Yang CZ; Stoner MA Estrogenic chemicals often leach from BPA-free plastic products that are replacements for BPA-containing polycarbonate products. Environ. Health 2014, 13, 41–54. [DOI] [PMC free article] [PubMed] [Google Scholar]
- (11).Simoneau C; Valzacchi S; Morkunas V; Van den Eede L Comparison of migration from polyethersulphone and polycarbonate baby bottles. Food Addit. Contam., Part A 2011, 28, 1763–1768. [DOI] [PubMed] [Google Scholar]
- (12).U.S. Environmental Protection Agency. Bisphenol A Alternatives In Thermal Paper. http://www2.epa.gov/saferchoice/partnership-evaluate-alternatives-bisphenol-thermal-paper (accessed February 15, 2015).
- (13).APPVION. Appleton-BPA-free-news-release. Available: http://www.appvion.com/en-us/Documents/Historical%20News/Appleton-BPA-free-news-release.pdf (accessed February 1, 2015).
- (14).Liao C; Liu F; Kannan K Bisphenol S., a New Bisphenol Analogue, in Paper Products and Currency Bills and Its Association with Bisphenol A Residues. Environ. Sci. Technol 2012, 46, 6515–6522. [DOI] [PubMed] [Google Scholar]
- (15).Vinas P; Campillo N; Martinez-Castillo N; Hernandez-Cordoba M Comparison of two derivatization-based methods for solid-phase microextraction-gas chromatography-mass spectrometric determination of bisphenol A, bisphenol S and biphenol migrated from food cans. Anal. Bioanal. Chem 2010, 397, 115–125. [DOI] [PubMed] [Google Scholar]
- (16).Liao CY; Liu F; Guo Y; Moon HB; Nakata H; Wu Q; Kannan K Occurrence of Eight Bisphenol Analogues in Indoor Dust from the United States and Several Asian Countries: Implications for Human Exposure. Environ. Sci. Technol 2012, 46, 9138–9145. [DOI] [PubMed] [Google Scholar]
- (17).Liao CY; Kannan K Concentrations and Profiles of Bisphenol A and Other Bisphenol Analogues in Foodstuffs from the United States and Their Implications for Human Exposure. J. Agric. Food Chem 2013, 61, 4655–4662. [DOI] [PubMed] [Google Scholar]
- (18).Grignard E; Lapenna S; Bremer S Weak estrogenic transcriptional activities of Bisphenol A and Bisphenol S. Toxicol. In Vitro 2012, 26, 727–731. [DOI] [PubMed] [Google Scholar]
- (19).Lee S; Liu X; Takeda S; Choi K Genotoxic potentials and related mechanisms of bisphenol A and other bisphenol compounds: A comparison study employing chicken DT40 cells. Chemosphere 2013, 93, 434–440. [DOI] [PubMed] [Google Scholar]
- (20).Vinas R; Watson CS Bisphenol S Disrupts Estradiol-Induced Nongenomic Signaling in a Rat Pituitary Cell Line: Effects on Cell Functions. Environ. Health Perspect 2013, 121, 352–358. [DOI] [PMC free article] [PubMed] [Google Scholar]
- (21).Mathew M; Sreedhanya S; Manoj P; Aravindakumar CT; Aravind UK Exploring the Interaction of Bisphenol-S with Serum Albumins: A Better or Worse Alternative for Bisphenol A? J. Phys. Chem. B 2014, 118, 3832–3843. [DOI] [PubMed] [Google Scholar]
- (22).Li M; Guo J; Gao WH; Yu JL; Han XY; Zhang J; Shao B Bisphenol AF-Induced Endogenous Transcription Is Mediated by ERα and ERK1/2 Activation in Human Breast Cancer Cells. PLoS One 2014, 9, e94725 10.1371/journal.pone.0094725 [DOI] [PMC free article] [PubMed] [Google Scholar]
- (23).National Toxicology Program. Chemical Information Profile for Bisphenol AF. http://ntp.niehs.nih.gov/ntp/htdocs/chem_background/exsumpdf/bisphenolaf_093008_508.pdf (accessed February 13, 2015). [Google Scholar]
- (24).Pisapia L; Del Pozzo G; Barba P; Caputo L; Mita L; Viggiano E; Russo GL; Nicolucci C; Rossi S; Bencivenga U; Mita DG; Diano N Effects of some endocrine disruptors on cell cycle progression and murine dendritic cell differentiation. Gen. Comp. Endocrinol 2012, 178, 54–63. [DOI] [PubMed] [Google Scholar]
- (25).Audebert M; Dolo L; Perdu E; Cravedi JP; Zalko D Use of the gamma H2AX assay for assessing the genotoxicity of bisphenol A and bisphenol F in human cell lines. Arch. Toxicol 2011, 85, 1463–1473. [DOI] [PubMed] [Google Scholar]
- (26).Centers for Disease Control and Prevention; National Center for Environmental Health; Division of Laboratory Sciences. Fourth National Report on Human Exposure to Environmental Chemicals (Updated Tables, February, 2015). http://www.cdc.gov/biomonitoring/pdf/FourthReport_UpdatedTables_Feb2015.pdf (accessed March 12, 2015).
- (27).Liao C; Liu F; Alomirah H; Loi VD; Mohd MA; Moon HB; Nakata H; Kannan K Bisphenol S in Urine from the United States and Seven Asian Countries: Occurrence and Human Exposures. Environ. Sci. Technol 2012, 46, 6860–6866. [DOI] [PubMed] [Google Scholar]
- (28).Yang YJ; Guan J; Yin J; Shao B; Li H Urinary levels of bisphenol analogues in residents living near a manufacturing plant in south China. Chemosphere 2014, 112, 481–486. [DOI] [PubMed] [Google Scholar]
- (29).Zhou XL; Kramer JP; Calafat AM; Ye XY Automated on-line column-switching high performance liquid chromatography isotope dilution tandem mass spectrometry method for the quantification of bisphenol A, bisphenol F, bisphenol S, and 11 other phenols in urine. J. Chromatogr. B: Anal. Technol. Biomed. Life Sci 2014, 944, 152–156. [DOI] [PubMed] [Google Scholar]
- (30).Taylor JK Quality Assurance of Chemical Measurements; Lewis Publishers: Chelsea, MI, 1987. [Google Scholar]
- (31).Caudill SP; Schleicher RL; Pirkle JL Multi-rule quality control for the age-related eye disease study. Stat. Med 2008, 27, 4094–4106. [DOI] [PubMed] [Google Scholar]
- (32).Hornung RW; Reed LD Estimation of average concentration in the presence of nondetectable values. Appl. Occup. Environ. Hyg 1990, 5, 46–51. [Google Scholar]
- (33).Succop PA; Clark S; Chen M; Galke W Imputation of data values that are less than a detection limit. J. Occup. Environ. Hyg 2004, 7, 436–441. [DOI] [PubMed] [Google Scholar]
- (34).Volkel W; Colnot T; Csanady GA; Filser JG; Dekant W Metabolism and kinetics of bisphenol A in humans at low doses following oral administration. Chem. Res. Toxicol 2002, 15, 1281–1287. [DOI] [PubMed] [Google Scholar]
- (35).Calafat AM; Weuve J; Ye XY; Jia LT; HU H; Ringer S; Huttner K; Hauser R Exposure to Bisphenol A and Other Phenols in Neonatal Intensive Care Unit Premature Infants. Environ. Health Perspect 2009, 117, 639–644. [DOI] [PMC free article] [PubMed] [Google Scholar]
- (36).Green Century Capital Management. Safer Packaging: Ranking Packaged Food Companies on BPA 2010. http://greencentury.staging.wpengine.com/wp-content/uploads/2013/05/bpareport2010.pdf (accessed February 1, 2015).
- (37).Konkel L Thermal Reaction: The Spread of Bisphenol S via Paper Products. Environ. Health Perspect 2013, 121, A76. [DOI] [PMC free article] [PubMed] [Google Scholar]
- (38).National Library of Medicine. Hazardous Substances Data Bank (HSDB). http://toxnet.nlm.nih.gov/cgi-bin/sis/htmlgen?HSDB (accessed February 6, 2015).
- (39).Koch HM; Kolossa-Gehring M; Schroter-Kermani C; Angerer J; Bruning T Bisphenol A in 24 h urine and plasma samples of the German Environmental Specimen Bank from 1995 to 2009: A retrospective exposure evaluation. J. Exposure Sci. Environ. Epidemiol 2012, 22, 610–616. [DOI] [PubMed] [Google Scholar]
Associated Data
This section collects any data citations, data availability statements, or supplementary materials included in this article.