

Abstract
Lower body negative pressure (LBNP) elicits central hypovolemia, and it has been used to simulate the cardiovascular and cerebrovascular responses to hemorrhage in humans. LBNP protocols commonly use progressive stepwise reductions in chamber pressure for specific time periods. However, continuous ramp LBNP protocols have also been utilized to simulate the continuous nature of most bleeding injuries. The aim of this study was to compare tolerance and hemodynamic responses between these two LBNP profiles. Healthy human subjects (N = 19; age, 27 ± 4 y; 7 female/12 male) completed a 1) step LBNP protocol (5-min steps) and 2) continuous ramp LBNP protocol (3 mmHg/min), both to presyncope. Heart rate (HR), mean arterial pressure (MAP), stroke volume (SV), middle and posterior cerebral artery velocity (MCAv and PCAv), cerebral oxygen saturation (ScO2), and end-tidal CO2 (etCO2) were measured. LBNP tolerance, via the cumulative stress index (CSI, summation of chamber pressure × time at each pressure), and hemodynamic responses were compared between the two protocols. The CSI (step: 911 ± 97 mmHg/min vs. ramp: 823 ± 83 mmHg/min; P = 0.12) and the magnitude of central hypovolemia (%Δ SV, step: −54.6% ± 2.6% vs. ramp: −52.1% ± 2.8%; P = 0.32) were similar between protocols. Although there were no differences between protocols for the maximal %Δ HR (P = 0.88), the %Δ MAP during the step protocol was attenuated (P = 0.05), and the reductions in MCAv, PCAv, ScO2, and etCO2 were greater (P ≤ 0.08) when compared with the ramp protocol at presyncope. These results indicate that when comparing cardiovascular responses to LBNP across different laboratories, the specific pressure profile must be considered as a potential confounding factor.
NEW & NOTEWORTHY Ramp lower body negative pressure (LBNP) protocols have been utilized to simulate the continuous nature of bleeding injuries. However, it unknown if tolerance or the physiological responses to ramp LBNP are similar to the more common stepwise LBNP protocol. We report similar tolerance between the two protocols, but the step protocol elicited a greater increase in cerebral oxygen extraction in the presence of reduced blood flow, presumably facilitating the matching of metabolic supply and demand.
Keywords: central hypovolemia, cerebral blood velocity, lower body negative pressure
INTRODUCTION
Lower body negative pressure (LBNP) is a common and reproducible experimental approach used to characterize cardiovascular reflex responses to simulated hemorrhage in humans (1–9). Application of negative pressure to the lower body (usually from the waist) redistributes blood from the upper body to the pelvis and legs, subsequently reducing venous return, cardiac output, and arterial pressure (2, 4, 10). The resulting central hypovolemia leads to sympathetically mediated compensatory increases in heart rate (HR) and systemic vascular resistance in an effort to maintain adequate arterial pressure and vital organ perfusion (10–12). Despite these compensatory reflex responses, continued decreases in chamber pressure will cause reductions in cerebral perfusion pressure, cerebral blood flow (or velocity), and cerebral tissue oxygen saturation that are associated with the onset of presyncopal symptoms (13–20). These primary cardiovascular and cerebrovascular responses to LBNP have recently been validated against actual blood loss protocols in both human and animal models (6, 21, 22), demonstrating the utility of LBNP as a noninvasive method to assess the reflex hemodynamic responses to acute blood loss. With the advantages of a controlled and reproducible central hypovolemic and hypotensive state, further clinical applications of the LBNP technique include assessment of autonomic function and baroreflex responsiveness, cerebral blood flow regulation, and cardiac function (23–25).
Most often, investigators have used LBNP protocols with progressive stepwise reductions in chamber pressure, with each step maintained for specific time intervals. End points include a predefined negative pressure limit of the chamber (physical limit) and/or the onset of presyncopal signs and symptoms (physiological limit). However, due to cardiovascular compensation and stabilization at each static pressure step, this type of LBNP protocol may not accurately represent bleeding injuries, often characterized by relatively constant blood loss, rather than intermittent compensation. To address this limitation, continuous application of LBNP (i.e., a “ramp” protocol) has been utilized in an attempt to simulate the continuous nature of most bleeding injuries (15, 26–31). Although not directly examined in the current study, ramp LBNP protocols may more accurately characterize the cardiovascular responses to blood loss, which may facilitate development or advancement of therapeutic interventions to improve survival from hemorrhage. We have recently reported that continuous ramp LBNP protocols are reproducible with regard to LBNP tolerance time and key cardiovascular and cerebrovascular responses in young, healthy human subjects (29).
As this is a relatively uncommon experimental approach, it is unknown if ramp LBNP elicits similar cardiovascular and cerebral hemodynamic responses to step LBNP. Therefore, the aim of this study was to compare LBNP tolerance and hemodynamic responses between a progressive step LBNP protocol and a continuous ramp LBNP protocol until the onset of presyncope in the same young healthy human subjects. We hypothesized that LBNP tolerance and hemodynamic responses to continuous LBNP applied at a rate of 3 mmHg/min would be similar to a traditional step LBNP protocol (5-min steps), including the responses at the onset of presyncope.
METHODS
Subjects
Nineteen young and healthy adults completed three study visits, including a familiarization/medical screening session, and two experimental sessions, conducted at the University of North Texas Health Science Center (UNTHSC, Fort Worth, TX). Data from these subjects have previously been reported in several prior publications focusing on independent research questions (15, 29, 30). The experimental protocol was reviewed and approved by the UNTHSC Institutional Review Board (IRB Protocol No. 2012-163), and subjects provided written informed consent before participation in the study. All subjects were nonsmokers and free from known cardiovascular, cerebrovascular, respiratory, metabolic, or inflammatory diseases. Additional exclusion criteria were body mass index (BMI) > 30 kg/m2, resting systolic arterial pressure (SAP) > 140 mmHg or diastolic arterial pressure (DAP) > 90 mmHg, use of prescription medications (except for oral contraceptives), presence of orthostatic hypotension, donation of blood within 60 days before testing, presence of bleeding disorders, and a history of abdominal hernias. All subjects attended a familiarization session, where a medical history, and blood pressure and ECG measurements (standing and seated) were obtained for physician approval before participation in the study. Female subjects underwent a urine pregnancy test and were excluded if pregnant. A urine pregnancy test was also repeated immediately before each experimental session. Subjects were given a verbal briefing and written description of all the measurements and risks associated with the protocol, and were familiarized to the laboratory, personnel, procedures, and monitoring equipment.
Due to the potential confounding effects on cardiovascular and autonomic regulation, all subjects were asked to arrive for testing having abstained from alcohol, stimulants (e.g., caffeine), prescription and nonprescription drugs, herbal medications, and exercise for the 24-h before each session. Subjects were also instructed to remain hydrated (ad libitum water consumption) and maintain normal sleep patterns before the familiarization and experimental sessions. All female subjects were tested within days 1–4 of menses, or if taking oral contraceptives, during the blank pill or no pill days; menstrual phase was self-reported. Additionally, all subjects were encouraged to empty their bladder before instrumentation to control for potential confounding effects of bladder distension on blood pressure regulation (32). Experimental sessions were performed at the same time of day (morning) for all subjects in a temperature-controlled laboratory (22–24°C).
Instrumentation
Subjects were positioned inside the LBNP chamber (VUV Analytics Inc., Austin, TX) in the supine posture, straddling a bicycle seat, with their waist (at the iliac crest) in line with the opening of the chamber. A durable plastic sleeve and neoprene waist band were wrapped around the subject’s lower abdomen to form an airtight seal with the LBNP chamber. All subjects were instrumented for continuous measurement of heart rate (HR) via a standard lead II ECG (shielded leads, cable, and amplifier, AD Instruments, Bella Vista, NSW, Australia), and beat-to-beat arterial pressure and stroke volume (SV) via finger photoplethysmography (Finometer, Finapres Medical Systems, Amsterdam, the Netherlands). A mask was placed over the nose and mouth, and respiration rate and end tidal CO2 (etCO2) were measured on a breath-by-breath basis via capnography (ML206 Gas Analyzer; AD Instruments). For the majority of subjects, cerebral blood velocity was recorded from the right middle cerebral artery (MCA) and the left posterior cerebral artery (PCA) with transcranial Doppler ultrasound probes (2-MHz probes; ST3; Spencer Technologies, Seattle, WA) held in place over the temporal windows with a cushioned and adjustable headframe (Marc 600; Spencer Technologies, Seattle, WA). Oxyhemoglobin, deoxyhemoglobin, total hemoglobin concentration (THC; oxyhemoglobin + deoxyhemoglobin), and cerebral tissue oxygen saturation [ScO2; (oxy-hemoglobin/THC) × 100)] were measured or calculated from the frontal cortex via near infrared spectroscopy (OxiplexTS, ISS, Champaign-Urbana, IL). Both middle cerebral artery velocity (MCAv) and cerebral oxygenation measurements were recorded from the same side of the head in most subjects. Muscle tissue oxygen saturation (SmO2) was obtained from the flexor carpi ulnaris muscle of the forearm via near infrared spectroscopy (CareGuide™; Reflectance Medical Inc., Westborough, MA) as an index of peripheral ischemia.
Protocol
Each subject completed two LBNP tests, a ramp protocol, and a step protocol (Fig. 1) with at least 4 wk between protocols. The order of the protocols was not randomized, with the ramp protocol always completed first. The ramp protocol began with a 5-min baseline, and then LBNP was applied at a constant decompression rate of −3 mmHg/min to a maximum of −100 mmHg, or until the onset of presyncope (29). Similarly, the step protocol consisted of a 5-min baseline followed by application of progressively decreasing LBNP every 5-min to −15, −30, −45, −60, −70, −80, −90, and −100 mmHg, or until the onset of presyncope (19). The protocol was terminated when subjects reached one or more of the following termination criteria: 1) instantaneous SAP below 80 mmHg, 2) sudden relative bradycardia, and/or 3) voluntary subject termination due to subjective presyncopal symptoms such as gray-out, nausea, sweating, dizziness, blurred vision, or general discomfort (15, 30). The chamber pressure was released immediately at the onset of presyncope, or upon reaching the end of 5-min at −100 mmHg LBNP for the step protocol, or 1-min at −100 mmHg for the ramp protocol. Subjects remained in the LBNP chamber for a 10-min recovery period.
Figure 1.
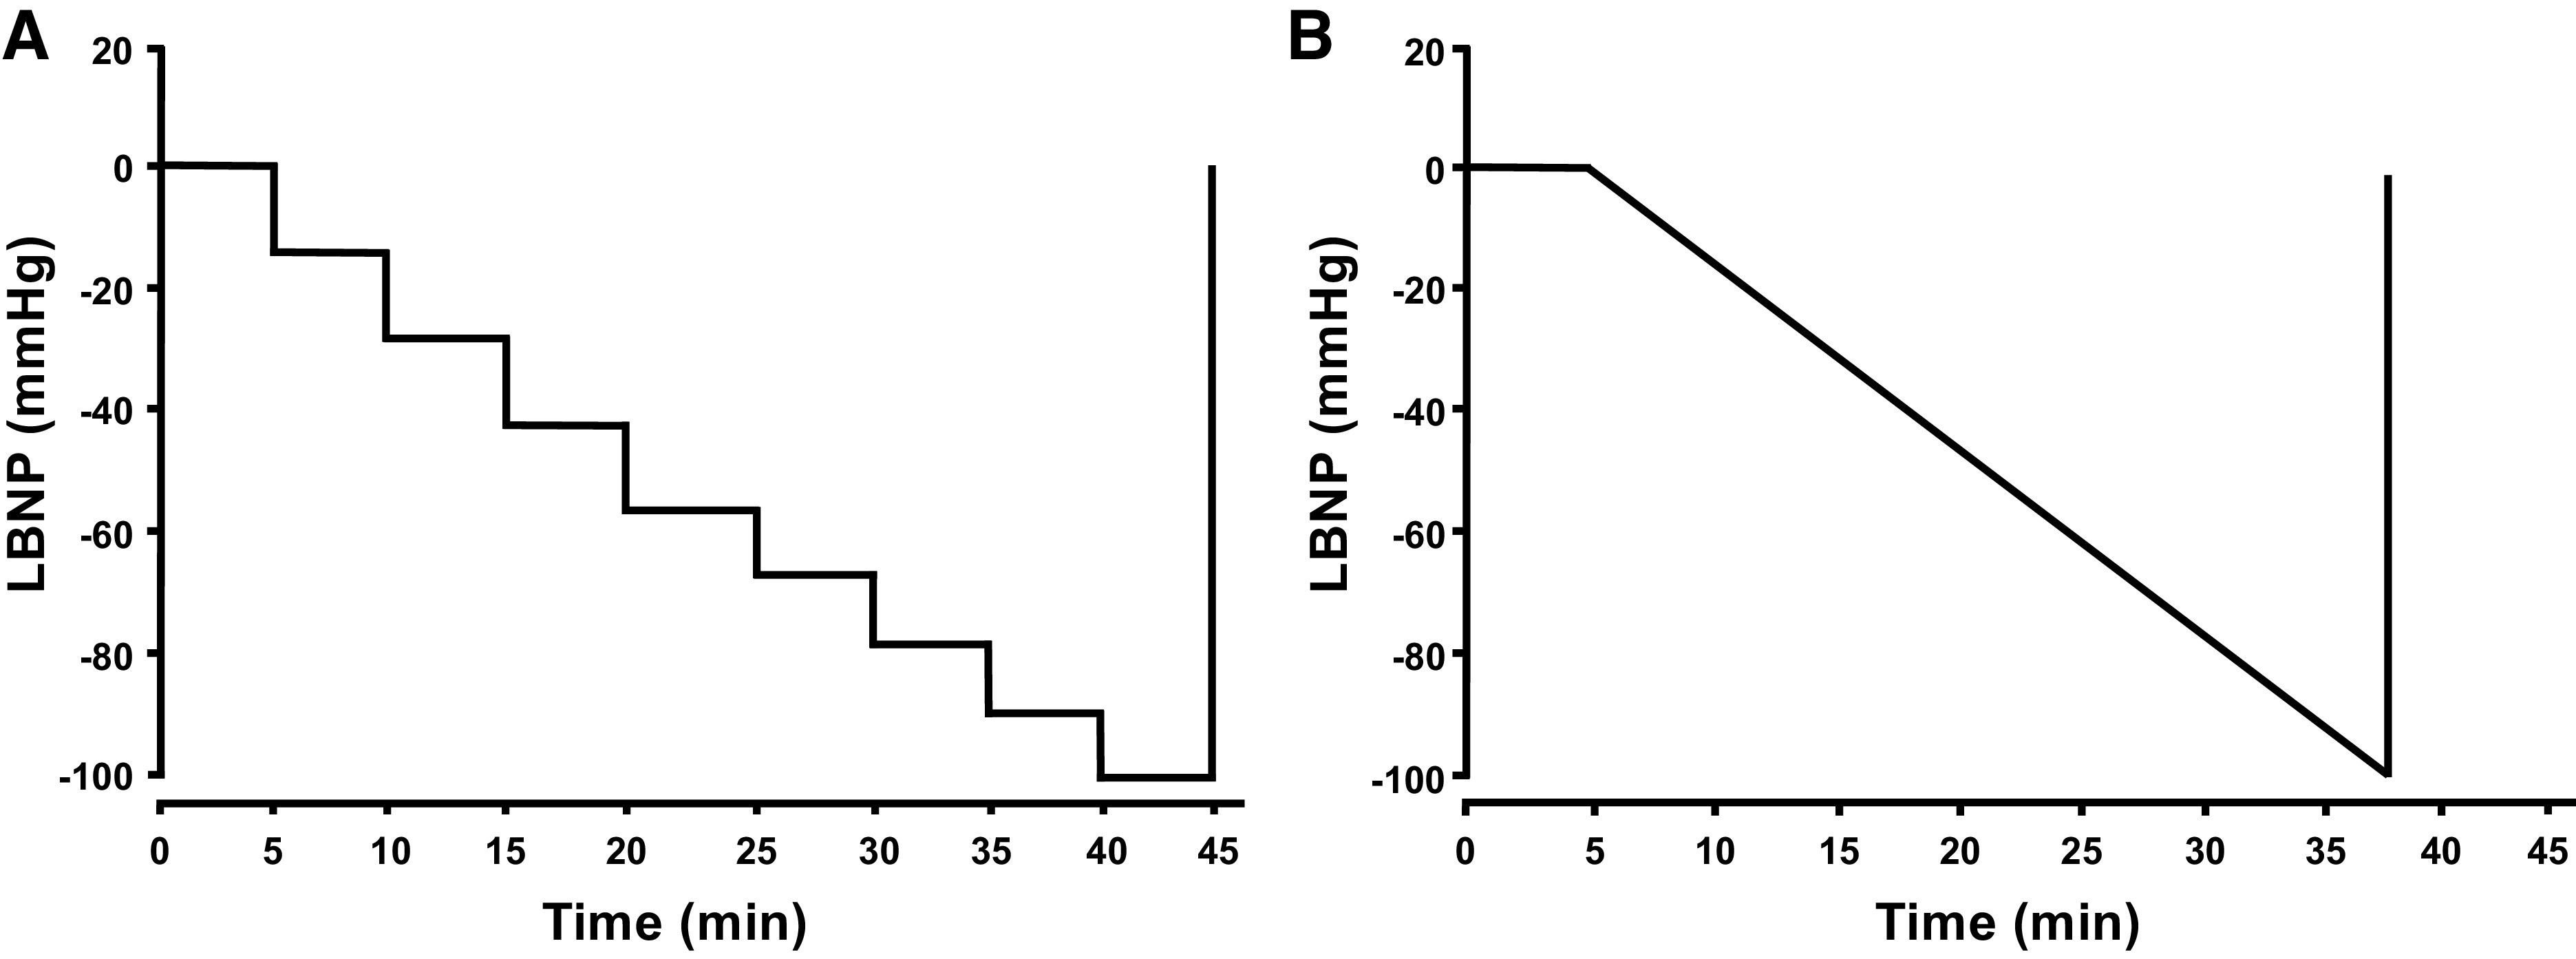
The step (A) and ramp (B) lower body negative pressure (LBNP) protocols. After a 5-min baseline, pressure in the LBNP chamber was decreased every 5-min to −15, −30, −45, −60, −70, −80, −90, and −100 mmHg (step; A), or at a decompression rate of 3 mmHg/min (ramp; B), both until presyncope.
Data Analysis
Tolerance to LBNP was assessed by the total time to presyncope (in seconds), and the cumulative stress index (CSI, summation of chamber pressure × time at each pressure in mmHg·min) (33). All continuous waveform data [e.g., ECG, arterial pressure, SV, MCAv, posterior cerebral artery velocity (PCAv), ScO2, THC, and etCO2] were collected at 1,000 Hz (LabChart; AD Instruments) and analyzed offline via specialized software (WinCPRS; Absolute Aliens, Turku, Finland). R-waves from the ECG signal were detected to determine the time intervals of each cardiac cycle. Beat-to-beat SAP and diastolic arterial pressures (DAP) were then detected from the continuous arterial pressure tracings. Systolic and diastolic cerebral blood velocities were also detected and marked from the continuous MCAv and PCAv tracings. Mean arterial pressure (MAP), mean MCAv, and mean PCAv were automatically calculated as the area under the arterial pressure and cerebral blood velocity waveforms via the WinCPRS software. Cardiac output was calculated as the product of SV and HR; systemic vascular resistance (SVR) was calculated as MAP divided by cardiac output. Muscle NIRS spectra were recorded every 30 s onto the stand-alone acquisition system, and then analyzed offline.
Statistical Analysis
Physiological responses were compared between step and ramp protocols every 5-min up to LBNP of −60 mmHg, as this was the last common level of LBNP for the majority of subjects. LBNP protocols (step and ramp) were divided into 5-min intervals, and then all variables were calculated from the final 1-min of each 5-min interval. In addition, to compare physiological responses between step and ramp protocols at presyncope, the final 1-min (PS-1) immediately before presyncope was assessed. Absolute and percent change from baseline values are reported for the key variables of interest. Differences between protocols at baseline, and at presyncope, were assessed using separate paired t tests. Our primary outcome variables were assessed using a two-factor (protocol, LBNP time) linear mixed-model analysis with repeated measures from baseline to −60 mmHg LBNP, followed by Holm-corrected multiple comparisons (JMP Pro 12; SAS Institute, Cary, NC). Unless otherwise stated, all data are presented as means ± standard error (SE), and exact P values are reported for all comparisons (except where P < 0.0001). The actual P values are reported instead of selecting an arbitrary threshold in an effort to address and remove the dichotomous use of the term “significant,” and to allow the reader to make their own judgments about the interpretation of the results (34, 35).
RESULTS
Nineteen subjects (12 males, 7 females; age, 27 ± 4 yr; height, 171 ± 8 cm; weight, 75 ± 15 kg; BMI, 25.6 ± 3.9 kg/m2; means ± SD) completed both the ramp and step LBNP protocols.
LBNP Tolerance—Time to Presyncope and CSI
In all but 2 of the 38 experiments, subjects reached objective presyncopal endpoints (defined as mean SAP ≤ 100 mmHg for the 1 min before presyncope and/or minimum instantaneous SAP ≤ 90 mmHg within the 1 min before presyncope) as we have previously reported (15, 30), in addition to expressing subjective symptoms (i.e., blurred vision, sweating, nausea, dizziness, and lightheadedness). In the remaining two experiments, the subjects reached objective presyncopal endpoints without experiencing subjective symptoms. The average time between the ramp and step LBNP experimental sessions was 62 ± 7 days, with a range of 26–144 days. As hypothesized, there was no difference in time to presyncope or in the CSI between ramp and step LBNP (P ≥ 0.12; Table 1 and Fig. 2A). The average maximal LBNP at presyncope was 66.9 ± 3.5 mmHg for the ramp protocol and 65.8 ± 3.0 mmHg for the step protocol (P = 0.60). No subjects reached the physical limit of either LBNP protocol (i.e., −100 mmHg LBNP).
Table 1.
Demographics for ramp and step LBNP protocols at baseline and presyncope
| Ramp | Step | P value | |
|---|---|---|---|
| LBNP tolerance time, s | 1679 ± 72 | 1612 ± 85 | 0.17 |
| Baseline HR, beats/min | 59.9 ± 1.5 | 62.4 ± 1.8 | 0.02 |
| Baseline MAP, mmHg | 95.4 ± 1.6 | 92.8 ± 1.6 | 0.07 |
| Baseline SV, mL | 99.3 ± 4.2 | 98.6 ± 3.6 | 0.77 |
| Baseline cardiac output, L/min | 5.9 ± 0.2 | 6.1 ± 0.2 | 0.13 |
| Baseline mean MCAv, cm/s (n = 18) | 64.4 ± 3.1 | 64.2 ± 3.4 | 0.94 |
| Baseline mean PCAv, cm/s (n = 11) | 40.4 ± 2.0 | 41.2 ± 1.8 | 0.54 |
| Presyncopal HR, beats/min | 107.2 ± 5.4 | 111.0 ± 4.7 | 0.31 |
| Presyncopal MAP, mmHg | 76.1 ± 1.3 | 76.4 ± 1.3 | 0.81 |
| Presyncopal SV, mL | 47.4 ± 3.2 | 45.1 ± 3.4 | 0.32 |
| Presyncopal cardiac output, l/min | 4.8 ± 0.2 | 4.8 ± 0.3 | 0.91 |
| Presyncopal mean MCAv, cm/s | 45.7 ± 2.4 | 42.8 ± 2.2 | 0.09 |
| Presyncopal mean PCAv, cm/s (n = 8) | 33.3 ± 1.7 | 30.5 ± 2.0 | 0.10 |
Values are shown as means ± SE for all data. n = number of subjects. HR, heart rate; MAP, mean arterial pressure; MCAv, Middle cerebral artery velocity; PCAv, posterior cerebral artery velocity; SV, stroke volume. Presyncopal time points refer to the 1 min prior to maximal LBNP tolerance.
Figure 2.

A: the cumulative stress index (CSI) to a progressive stepwise lower body negative pressure (LBNP) protocol (white bar) and to a continuous ramp LBNP protocol (gray bar). Mean (bars) and individual subject data (circles) are presented. A paired t test was used for analysis. B: percent change from baseline for stroke volume (SV) decreased similarly in both step LBNP (dashed line, open circle) and ramp LBNP (solid line, closed circle). Over the 1 min before presyncope (PS-1), the percent change in SV was not different between step LBNP (open triangle) versus ramp LBNP (closed triangle). Values are shown as means ± SE. A two-factor (protocol, time) linear mixed-model analysis with Holm-corrected multiple comparisons (within and between protocols up to −60 mmHg LBNP) and paired t tests (between protocols at PS-1) were used for analysis. *Difference from baseline within protocol, P ≤ 0.07.
Hemodynamic Responses to Ramp and Step LBNP
At baseline, heart rate was slightly elevated, and MAP was ∼3 mmHg lower in the step versus ramp LBNP protocols (P ≤ 0.07), with no differences in SV or cardiac output (P ≥ 0.13; Table 1). During both LBNP protocols, there were progressive decreases in MAP, SV, and cardiac output until the point of presyncope (LBNP effect, P < 0.0001; Table 2, Figs. 2B and 3B). Of these responses, only MAP exhibited a difference between protocols at presyncope, but only in the relative response (ramp: −20% ± 2% vs. step: −17% ± 2%; P = 0.05; Fig. 3B).
Table 2.
Hemodynamic responses during a progressive ramp and step lower body negative pressure (LBNP) protocols to presyncope
| LBNP stage (mmHg) |
P values |
|||||||||
|---|---|---|---|---|---|---|---|---|---|---|
| 0 | 15 | 30 | 45 | 60 | LBNP | Protocol | Interaction | PS 1-min | P Value | |
| SAP, mmHg | ||||||||||
| Ramp | 128.5 ± 1.9 | 127.5 ± 2.6 | 122.8 ± 1.6* | 116.8 ± 1.8* | 111.7 ± 3.3* | <0.0001 | 0.01 | 0.95 | 95.7 ± 1.4 | 0.51 |
| Step | 125.4 ± 1.8 | 124.8 ± 1.8 | 119.2 ± 2.1* | 115.6 ± 1.9* | 109.2 ± 2.1* | 94.9 ± 1.3 | ||||
| SAP, %Δ | ||||||||||
| Ramp | – | −0.8 ± 1.2 | −4.3 ± 1.0* | −9.8 ± 1.2* | −13.2 ± 2.2* | <0.0001 | 0.50 | 0.79 | −25.2 ± 1.6 | 0.31 |
| Step | – | −0.4 ± 1.1 | −4.9 ± 1.4* | −8.0 ± 1.7* | −12.7 ± 1.8* | −24.0 ± 1.7 | ||||
| DAP, mmHg | ||||||||||
| Ramp | 73.8 ± 1.3 | 73.7 ± 1.5 | 75.1 ± 1.5 | 74.2 ± 1.7 | 75.3 ± 2.7 | 0.66 | 0.06 | 0.58 | 65.0 ± 1.4 | 0.56 |
| Step | 71.8 ± 1.3 | 72.7 ± 1.3 | 72.8 ± 1.5 | 74.6 ± 1.1 | 74.8 ± 1.5 | 65.7 ± 1.4 | ||||
| DAP, %Δ | ||||||||||
| Ramp | – | −0.1 ± 1.0 | 1.8 ± 1.1 | −0.5 ± 1.2† | 1.4 ± 2.1 | 0.30 | 0.04 | 0.16 | −11.7 ± 1.6 | 0.06 |
| Step | – | 1.3 ± 0.9 | 1.4 ± 1.3 | 3.2 ± 1.4 | 2.4 ± 1.7 | −8.2 ± 2.2 | ||||
| HR, beats/min | ||||||||||
| Ramp | 59.9 ± 1.5 | 61.5 ± 1.7 | 69.1 ± 2.1* | 79.0 ± 2.4* | 86.6 ± 3.0* | <0.0001 | <0.0001 | 0.95 | 107.2 ± 5.4 | 0.31 |
| Step | 62.4 ± 1.8 | 65.6 ± 2.2 | 73.5 ± 2.8* | 83.4 ± 3.5* | 91.3 ± 3.1* | 111.0 ± 4.7 | ||||
| MAP, mmHg | ||||||||||
| Ramp | 95.4 ± 1.6 | 94.7 ± 1.8 | 93.5 ± 1.5 | 90.5 ± 1.7* | 89.4 ± 2.9* | <0.0001 | 0.02 | 0.77 | 76.1 ± 1.3 | 0.81 |
| Step | 92.8 ± 1.6 | 92.9 ± 1.6 | 90.9 ± 1.8 | 90.4 ± 1.3 | 87.9 ± 1.5* | 76.4 ± 1.3 | ||||
| SV, mL | ||||||||||
| Ramp | 99.3 ± 4.2 | 93.3 ± 3.8 | 79.8 ± 3.0* | 66.0 ± 2.8* | 55.3 ± 2.9* | <0.0001 | 0.15 | 0.98 | 47.4 ± 3.2 | 0.32 |
| Step | 98.6 ± 3.6 | 90.7 ± 3.3* | 78.0 ± 3.4* | 65.0 ± 3.4* | 53.2 ± 3.4* | 45.1 ± 3.4 | ||||
| Cardiac output, L/min | ||||||||||
| Ramp | 5.9 ± 0.2 | 5.7 ± 0.2 | 5.5 ± 0.2* | 5.2 ± 0.2* | 4.8 ± 0.3* | <0.0001 | 0.01 | 0.96 | 4.8 ± 0.2 | 0.91 |
| Step | 6.1 ± 0.2 | 5.9 ± 0.2 | 5.7 ± 0.2* | 5.3 ± 0.3* | 4.8 ± 0.3* | 4.8 ± 0.3 | ||||
| Cardiac output, %Δ | ||||||||||
| Ramp | – | −3.3 ± 1.3 | −6.8 ± 1.5* | −10.0 ± 2.1* | −16.9 ± 2.8* | <0.0001 | 0.22 | 0.88 | −17.8 ± 2.3 | 0.17 |
| Step | – | −3.5 ± 1.2 | −7.5 ± 1.8* | −12.1 ± 2.4* | −19.2 ± 2.1* | −21.4 ± 2.7 | ||||
| SVR, (mmHg/L*min−1) | ||||||||||
| Ramp | 16.8 ± 0.9† | 17.2 ± 0.8 | 17.6 ± 0.8 | 18.0 ± 0.8 | 19.3 ± 1.1* | <0.0001 | 0.0004 | 0.71 | 16.4 ± 0.8 | 0.70 |
| Step | 15.8 ± 0.6 | 16.2 ± 0.7 | 16.6 ± 0.8 | 17.5 ± 0.9* | 18.9 ± 1.2* | 16.6 ± 0.8 | ||||
| SVR, %Δ | ||||||||||
| Ramp | – | 2.9 ± 1.3 | 5.7 ± 1.8 | 5.1 ± 2.5 | 13.0 ± 3.8* | <0.0001 | 0.03 | 0.38 | −1.4 ± 2.9 | 0.03 |
| Step | – | 4.0 ± 1.5 | 6.7 ± 2.3* | 10.9 ± 2.3* | 16.7 ± 3.2* | 6.9 ± 3.5 | ||||
| SmO2, % (n = 11) | ||||||||||
| Ramp | 75.0 ± 1.6 | 74.5 ± 1.7 | 72.4 ± 2.1 | 71.2 ± 2.6 | 71.3 ± 1.3 | 0.002 | 0.06 | 0.86 | 68.5 ± 2.3 | 0.75 |
| Step | 76.9 ± 1.5 | 74.8 ± 2.0 | 73.3 ± 2.1 | 73.3 ± 1.4 | 74.5 ± 1.4 | 69.4 ± 1.9 | ||||
| SmO2, %Δ (n = 11) | ||||||||||
| Ramp | – | −0.7 ± 0.6 | −3.5 ± 1.2* | −4.8 ± 1.5* | −5.6 ± 1.2* | <0.0001 | 0.04 | 0.64 | −8.9 ± 1.7 | 0.65 |
| Step | – | −3.0 ± 1.0* | −5.0 ± 1.1* | −6.2 ± 0.8* | −6.3 ± 1.4* | −9.9 ± 1.3 | ||||
| Mean MCAv, cm/s | ||||||||||
| Ramp | 64.4 ± 3.1 | 64.3 ± 3.4 | 61.8 ± 3.7 | 58.3 ± 3.6* | 56.2 ± 3.0* | <0.0001 | 0.05 | 0.90 | 45.7 ± 2.4 | 0.09 |
| Step | 64.2 ± 3.4 | 62.4 ± 3.4 | 59.7 ± 3.5 | 56.5 ± 3.2* | 52.9 ± 3.3* | 42.8 ± 2.2 | ||||
| Mean PCAv, cm/s (n = 11) | ||||||||||
| Ramp | 40.4 ± 2.0 | 40.3 ± 2.1 | 38.8 ± 2.3 | 37.9 ± 2.8 | 39.6 ± 1.6* | <0.0001 | 0.41 | 0.81 | 33.3 ± 1.7 | 0.10 |
| Step | 41.2 ± 1.8 | 39.3 ± 2.2 | 38.4 ± 2.8 | 37.5 ± 3.4* | 37.5 ± 2.2* | 30.5 ± 2.0 | ||||
| ScO2, % | ||||||||||
| Ramp | 67.7 ± 1.4 | 66.8 ± 1.5 | 66.2 ± 1.5 | 65.6 ± 1.7 | 66.1 ± 1.8 | <0.0001 | 0.003 | 0.50 | 63.0 ± 1.5 | 0.16 |
| Step | 67.5 ± 1.6 | 66.1 ± 1.8 | 64.9 ± 1.7* | 63.6 ± 2.0* | 63.7 ± 2.5* | 60.3 ± 2.4 | ||||
| Oxyhemoglobin, µM | ||||||||||
| Ramp | 34.3 ± 2.4 | 33.4 ± 2.4 | 32.9 ± 2.4 | 33.0 ± 2.7 | 34.4 ± 4.0 | 0.02 | 0.34 | 0.76 | 30.8 ± 2.3 | 0.49 |
| Step | 34.8 ± 3.0 | 33.5 ± 3.0 | 32.4 ± 2.9 | 31.9 ± 3.1 | 32.7 ± 4.4* | 29.8 ± 2.8 | ||||
| Deoxyhemoglobin, µM | ||||||||||
| Ramp | 16.0 ± 1.1 | 16.3 ± 1.1 | 16.5 ± 1.1 | 16.9 ± 1.2 | 17.1 ± 1.8 | 0.01 | 0.09 | 0.91 | 17.7 ± 1.1 | 0.36 |
| Step | 16.2 ± 1.5 | 16.5 ± 1.5 | 16.9 ± 1.5 | 17.6 ± 1.7 | 17.6 ± 2.6 | 18.2 ± 1.6 | ||||
| Respiratory rate, breaths/min | ||||||||||
| Ramp | 13 ± 1 | 12 ± 1 | 12 ± 1 | 12 ± 1 | 12 ± 1 | 0.96 | 0.19 | 0.38 | 14 ± 2 | 0.62 |
| Step | 12 ± 1 | 12 ± 1 | 12 ± 1 | 11 ± 1 | 12 ± 1 | 15 ± 2 | ||||
| etCO2, mmHg | ||||||||||
| Ramp | 41.8 ± 1.1 | 40.9 ± 1.1 | 39.2 ± 1.2 | 37.6 ± 1.6* | 38.1 ± 1.8* | <0.0001 | 0.27 | 0.46 | 30.0 ± 1.9 | 0.22 |
| Step | 42.6 ± 1.0 | 40.9 ± 1.1 | 39.1 ± 1.4 | 36.7 ± 1.9* | 34.9 ± 2.1* | 28.3 ± 1.6 | ||||
| etCO2, %Δ | ||||||||||
| Ramp | – | −2.3 ± 0.9 | −6.2 ± 1.5* | −10.0 ± 2.6* | −12.1 ± 2.6* | <0.0001 | 0.006 | 0.45 | −28.3 ± 4.0 | 0.03 |
| Step | – | −4.0 ± 1.2 | −8.6 ± 1.8* | −13.5 ± 3.3* | −18.2 ± 4.2* | −33.7 ± 3.4 | ||||
Data are presented as absolute and relative means ± SE. *P ≤ 0.09 compared with baseline within a group. †P ≤ 0.05 differences between protocols. n = number of subjects. SAP, systolic arterial pressure; DAP, diastolic arterial pressure; etCO2, end tidal carbon dioxide; MAP, mean arterial pressure; MCAv, middle cerebral artery velocity; ScO2, cerebral oxygen saturation; SmO2, muscle oxygen saturation; SV, stroke volume; SVR, systemic vascular resistance. PS-1 time point refers to the 1 min prior to presyncope.
Figure 3.

Heart rate (HR) (A) increased and mean arterial pressure (MAP; B) decreased during both step (dashed line, open circle) and ramp (solid line, closed circle) lower body negative pressure (LBNP) protocols. Over the 1 min before presyncope (PS-1), HR was similar and MAP was different between protocols. Values are shown as means ± SE. A two-factor (protocol, time) linear mixed-model analysis with Holm-corrected multiple comparisons (within and between protocols up to −60 mmHg LBNP) and paired t tests (between protocols at PS-1) were used for analysis. *Difference from baseline within protocol, P ≤ 0.07.
In response to these reductions in central blood volume, heart rate increased during both protocols (LBNP effect, P < 0.0001 for absolute and relative responses), with no differences between protocols in the relative response (protocol effect, P = 0.34, Fig. 3A), including at PS-1 (ramp: 80% ± 10% vs. step: 79% ± 8%; P = 0.88). Similarly, SVR increased with LBNP in both protocols (LBNP effect, P < 0.001 for absolute and relative responses), but there was a greater relative increase overall during the step protocol (protocol effect, P = 0.03). Interestingly, SVR decreased from −60 mmHg to PS-1, with a relative decrease below baseline for the ramp protocol (ramp: −1.4% ± 2.9% vs. step: 6.9% ± 3.5%; P = 0.03; Table 2). Forearm muscle tissue oxygen saturation decreased with LBNP in both protocols (LBNP effect, P = 0.002), with no difference between protocols at presyncope (ramp: 68.5% ± 2.3% vs. step: 69.4% ± 1.9%; P = 0.75; Table 2).
Cerebral Hemodynamic and Oxygenation Responses to LBNP
MCAv data were analyzed with 18 subjects, due to loss of the signal during data collection in one subject. PCAv data were analyzed with only 11 subjects, due to the inability to obtain and/or maintain high-quality PCAv signals in the remaining subjects during the experiments. Mean MCAv decreased below baseline during both step and ramp LBNP (LBNP effect P < 0.0001 for absolute and relative responses), with an overall difference in responses between LBNP protocols (protocol effect P < 0.05 for absolute and relative responses; Table 2 and Fig. 4A), including at PS-1, where the relative reduction in MCAv was attenuated with ramp LBNP (ramp: −28.6% ± 2.6% vs. step: −32.3% ± 2.7%; P = 0.08; Fig. 4A). Similarly, although mean PCAv decreased from baseline in both LBNP protocols (LBNP effect P < 0.0001), this decrease was attenuated in the ramp LBNP protocol in the relative response (protocol effect, P = 0.02; Fig. 4B), including at presyncope (ramp: −21.9% ± 3.1% vs. step: −27.8% ± 3.3%; P = 0.007).
Figure 4.

Middle cerebral artery velocity (MCAv; A) and posterior cerebral artery velocity (PCAv; B) decreased in both step (dashed line, open circle) and ramp (solid line, closed circle) lower body negative pressure (LBNP) protocols. Over the 1 min before presyncope (PS-1), the percent change in MCAv and PCAv was greater with step LBNP (open triangle) versus ramp LBNP (closed triangle). Values are shown as means ± SE. A two-factor (protocol, time) linear mixed-model analysis with Holm-corrected multiple comparisons (within and between protocols up to −60 mmHg LBNP) and paired t tests (between protocols at PS-1) were used for analysis. *Difference from baseline within protocol, P ≤ 0.06.
Overall, the step LBNP protocol-induced greater relative reductions in ScO2, and oxyhemoglobin, and increases in deoxyhemoglobin (protocol effects, P values ranged from <0.001 to 0.08; Fig. 5). At presyncope, the reduction in ScO2 was greater during the step protocol than during the ramp protocol in the relative response (ramp: −7.0% ± 0.9% vs. step: −11.1% ± 2.2%; P = 0.06; Fig. 5A). These responses in ScO2 were driven by a greater reduction in oxyhemoglobin during the step protocol as shown in Fig. 5B.
Figure 5.

Percent change from baseline for cerebral oxygen saturation (ScO2; A), oxygenated hemoglobin (oxyhemoglobin; B) and deoxygenated hemoglobin (deoxyhemoglobin; C) for step (dashed line, open circle) and ramp (solid line, closed circle) lower body negative pressure (LBNP) protocols. The reduction in ScO2 was greater during step LBNP versus ramp LBNP, and for the final 1 min before presyncope (PS-1), represented by open (step) and closed (ramp) triangles. Oxyhemoglobin decreased from −15 mmHg LBNP in the step LBNP protocol and was lower versus ramp LBNP at −45 and −60 mmHg LBNP and at the PS-1 time point. Deoxyhemoglobin progressively increased during both step LBNP and ramp LBNP, with no differences at any time point. Values are shown as means ± SE. A two-factor (protocol, time) linear mixed-model analysis with Holm-corrected multiple comparisons (within and between protocols up to −60 mmHg LBNP) and paired t tests (between protocols at PS-1) were used for analysis. *Difference from baseline within protocol, P ≤ 0.08. †Differences between protocols, P ≤ 0.04.
Although there was no effect of protocol (P = 0.19) or LBNP time (P = 0.96) on respiration rate (Table 2), etCO2 decreased from baseline in both protocols (LBNP effect P < 0.0001 for absolute and relative responses), with a greater percent change in etCO2 in the step protocol versus ramp protocol (protocol effect P = 0.006; Table 2), including at PS-1 (ramp: −28.3% ± 4.0% vs. step: −33.7% ± 3.4%; P = 0.03; Table 2).
DISCUSSION
We compared LBNP tolerance and key hemodynamic responses between a traditional stepwise LBNP protocol and a continuous ramp LBNP protocol until the onset of presyncope in young healthy human subjects. In support of our hypothesis, tolerance to LBNP (assessed via time to presyncope and CSI) was not different between the step and continuous ramp protocols. Additionally, the magnitude of central hypovolemia and compensatory increases in HR were similar between the LBNP protocols. However, at presyncope, the ramp LBNP protocol elicited greater reductions in arterial pressure, whereas cerebral blood flow (indexed via mean MCAv and mean PCAv) and cerebral tissue oxygen saturation were lower during the step protocol. These data suggest that compensatory increases in cerebral oxygen extraction occur in response to the greater reductions in cerebral blood flow induced via central hypovolemia by stepwise LBNP. These differences in physiological compensation to central hypovolemia and cerebral tissue hypoperfusion, however, did not affect LBNP tolerance to the two LBNP profiles. Our findings do indicate the importance of considering the specific pressure profile as a potential confounding factor when comparing cerebral and cardiovascular responses to LBNP across different laboratories.
The majority of published LBNP studies have utilized step protocols, with variations in the magnitude and timing of each step. As our laboratory, and others (6, 10, 36), are interested in using LBNP as a method of simulating blood loss, we have also started to use ramp LBNP profiles that may better reflect the continuous nature of most bleeding injuries. Prior studies have used continuous ramp LBNP protocols until the onset of presyncope (26, 31), or to a fixed predetermined chamber pressure (e.g., −50 or −60 mmHg) (27, 28). To the best of our knowledge, this is the first study to evaluate LBNP tolerance and hemodynamic responses between step and ramp LBNP protocols. It is important to note that tolerance to LBNP is highly individualized, with no single baseline physical or physiological factor that can reliably predict an individual’s LBNP tolerance, or their ensuing physiological responses (37, 38). Absolute tolerance times (i.e., time to presyncope) are also difficult to compare across laboratories due to differences in LBNP protocols, particularly in regards to the magnitude and rate of chamber decompression. To address the issue, several indices have been developed that account for the chamber pressure and the time at each pressure, including the CSI (8, 33, 39). Interestingly, however, we report similar LBNP tolerance between the ramp and step LBNP protocols, assessed either as duration to presyncope or as CSI.
Prior studies have examined the hemodynamic responses to continuous ramp LBNP with a wide range of decompression rates from ∼1 mmHg/min (28) to 20 mmHg/min (26). These differences in the LBNP profile can affect the capacity to compensate for reductions in arterial pressure; for example, large and rapid changes in LBNP will result in earlier hypotension and cardiovascular decompensation, thereby reducing overall LBNP tolerance times (10). For example, Poh et al. (31), report LBNP tolerance times that are approximately half of that observed in the current study, most likely due to the initial starting pressure of −30 mmHg LBNP for 15-min, and then a higher decompression rate of 5 mmHg/min (compared with 3 mmHg/min) until the onset of presyncope. Regardless of the decompression rate, however, central hemodynamic responses to ramp LBNP profiles in the current study are similar to those mentioned in previous studies, with comparable reductions in SV (27) and arterial pressure (26, 27, 31), and compensatory increases in HR (26–28, 31).
Central hypovolemia induced by LBNP will elicit reflex cardiovascular responses to maintain arterial pressure and cerebral perfusion (4). The combined hypotension and hypocapnia induced by LBNP, however, eventually leads to a decrease in cerebral blood flow and oxygen delivery, and the onset of presyncope (18). In studies that have assessed the cerebral blood flow responses (indexed via mean MCAv) to a presyncopal-limited ramp LBNP protocol, they report 30%–50% reductions from baseline (26, 31), which is in agreement with the current study, and is also similar to the responses reported with traditional step LBNP (19, 30). Importantly, as cerebral blood flow decreases with central hypovolemia, there is a compensatory increase in cerebral tissue oxygen extraction to meet metabolic demand (15, 17, 40). It is important to recognize that cerebral NIRS measures a mixed sample volume of blood (∼75% venous, 20% capillary, and 5% arterial) (41, 42), so we interpret decreases in oxyhemoglobin and increases in deoxyhemoglobin as an increase in extraction of oxygen from the cerebral circulation (18). Our results demonstrate that during both LBNP protocols, there is a progressive increase in oxygen extraction in response to the decrease in cerebral blood flow (indexed by MCAv and PCAv), evidenced by both decreases in oxyhemoglobin and increases in deoxyhemoglobin. Throughout the step LBNP protocol and at presyncope, there were greater decreases in ScO2, which coincided with greater reductions in MCAv and PCAv, suggesting greater cerebral oxygen extraction. It is not clear from the data collected in this study, however, if there were differences in cerebral metabolic rate of oxygen between LBNP protocols, which could also account for the apparent differences in cerebral tissue oxygen extraction.
Methodological Considerations
The order of the two experimental sessions was not randomized (the ramp protocol was always first), as the data were collected as part of a larger research study, where this particular question was not the focus (15, 29, 30). As such, there may be an order effect in the observed physiological responses. However, if there was an order effect it would be expected that LBNP tolerance to the second profile (i.e., the step LBNP protocol) would be higher due to subject familiarity with the protocol and reduced anxiety; this was not the case. Additionally, as there was a minimum of 26 days between trials, it is very unlikely that subjects experienced any cardiovascular conditioning from the first LBNP exposure; indeed Lightfoot et al. (43) suggest a minimum of just 2 days between repeated LBNP exposures to avoid the risk of cardiovascular conditioning.
Interpretation of transcranial Doppler ultrasound measurements of cerebral blood velocity as indices of blood flow is limited by the assumption that the insonated cerebral vessel diameter remains constant. Recent evidence suggests caution regarding this assumption under conditions that may alter arterial PCO2 due to the vasoactive effects of CO2 on the major intracranial arteries (44, 45). Although progressive maximal LBNP elicited hypocapnia in both protocols, it is possible that the observed differences in cerebral blood velocity at presyncope may not be truly representative of actual reductions in cerebral blood flow. End-tidal CO2 decreased by a greater magnitude in the step protocol compared with in the ramp protocol. These responses are in alignment with our cerebral blood velocity findings, where MCAv and PCAv also decreased by a greater magnitude at pre-syncope in the step protocol, which may be due to greater hypocapnia-induced vasoconstriction. Accordingly, it is possible that we would observe an even great reduction in actual cerebral blood flow in the step LBNP protocol compared with the ramp LBNP protocol. Additional testing is necessary with measurements of blood flow through the extracranial vessels, or via alternative imaging approaches (e.g., MRI) to fully elucidate the cerebral vascular responses between these two LBNP protocols.
Conclusions
The findings from this study indicate that LBNP tolerance to a continuous ramp LBNP protocol (applied at a rate of 3 mmHg/min) is similar to a traditional step LBNP protocol (progressively decreasing 5-min steps). Although the magnitude of central hypovolemia and the subsequent compensatory hemodynamic responses were similar between the ramp and step LBNP protocols, the cerebral blood velocity and oxygenation responses differed. The step LBNP protocol elicited a greater increase in cerebral oxygen extraction in the presence of reduced cerebral blood flow, presumably facilitating the matching of metabolic supply and demand, and ultimately resulting in similar LBNP tolerance between the ramp and step protocols. These results highlight that when comparing cardiovascular responses to LBNP across different laboratories, the specific pressure profiles must be considered as a potential confounding factor. Although the continuous decompression profile of ramp LBNP may more accurately simulate blood loss, direct comparison of responses to actual hemorrhage is required to adequately address this hypothesis.
GRANTS
This work was supported , in part, by the US Army MRMC Combat Casualty Care Research Program (Grant No. W81XWH-11-2-0137; C.A.R.); training fellowships awarded to G.K.A. through a National Institutes of Health-supported Neurobiology of Aging Training Grant (T32 AG020494, Principal Investigator: N. Sumien); an American Heart Association Predoctoral Fellowship (20PRE35210249), to A.J.R. through a Ruth L. Kirchstein NRSA F32 Postdoctoral Fellowship (1F32 HL144082-01A1); and a National Institutes of Health-supported Neurobiology of Aging Training Grant (T32 AG020494, Principal Investigator: S. Singh) and a Ruth L. Kirchstein NRSA F31 Predoctoral Fellowship (1 F31 HL134242-01A1) to J.D.S.
DISCLAIMER
The content is solely the responsibility of the authors and does not necessarily represent the official views of the US Department of Defense.
DISCLOSURES
No conflicts of interest, financial or otherwise, are declared by the authors.
AUTHOR CONTRIBUTIONS
C.A.R. conceived and designed research; V.L.K., J.D.S., and C.A.R. performed experiments; A.J.R. analyzed data; A.J.R., G.K.A., and C.A.R. interpreted results of experiments; A.J.R. and G.K.A. prepared figures; A.J.R. drafted manuscript; A.J.R., G.K.A., and C.A.R. edited and revised manuscript; A.J.R., V.L.K., G.K.A., J.D.S., and C.A.R. approved final version of manuscript.
ACKNOWLEDGMENTS
The authors thank the subjects for time and cooperation, Hannah Colby for assistance with data collection on this project, and Drs. Albert Yurvati, Levi Rice, and Sibi Thomas for assistance with subject medical examinations.
Footnotes
Primary subject area: Human/environmental and exercise physiology
Secondary subject area: Cardiovascular control
REFERENCES
- 1.Brown E, Goei JS, Greenfield AD, Plassaras GC. Circulatory responses to simulated gravitational shifts of blood in man induced by exposure of the body below the iliac crests to sub-atmospheric pressure. J Physiol 183: 607–627, 1966. doi: 10.1113/jphysiol.1966.sp007887. [DOI] [PMC free article] [PubMed] [Google Scholar]
- 2.Convertino VA. Lower body negative pressure as a tool for research in aerospace physiology and military medicine. J Gravit Physiol 8: 1–14, 2001. [PubMed] [Google Scholar]
- 3.Crystal GJ, Salem MR. Lower body negative pressure: historical perspective, research findings, and clinical applications. J Anesth Hist 1: 49–54, 2015. doi: 10.1016/j.janh.2015.02.005. [DOI] [PubMed] [Google Scholar]
- 4.Goswami N, Blaber AP, Hinghofer-Szalkay H, Convertino VA. Lower body negative pressure: physiological effects, applications, and implementation. Physiol Rev 99: 807–851, 2019. doi: 10.1152/physrev.00006.2018. [DOI] [PubMed] [Google Scholar]
- 5.Howden R, Tranfield PA, Lightfoot JT, Brown SJ, Swaine IL. The reproducibility of tolerance to lower-body negative pressure and its quantification. Eur J Appl Physiol 84: 462–468, 2001. doi: 10.1007/s004210100398. [DOI] [PubMed] [Google Scholar]
- 6.Johnson BD, van Helmond N, Curry TB, van Buskirk CM, Convertino VA, Joyner MJ. Reductions in central venous pressure by lower body negative pressure or blood loss elicit similar hemodynamic responses. J Appl Physiol 117: 131–141, 2014. doi: 10.1152/japplphysiol.00070.2014. [DOI] [PMC free article] [PubMed] [Google Scholar]
- 7.Lee K, Buchanan DB, Flatau AB, Franke WD. Reproducibility of the heart rate variability responses to graded lower body negative pressure. Eur J Appl Physiol 92: 106–113, 2004. doi: 10.1007/s00421-004-1068-7. [DOI] [PubMed] [Google Scholar]
- 8.Lightfoot JT, Hilton F, Jr, Fortney SM. Repeatability and protocol comparability of presyncopal symptom limited lower body negative pressure exposures. Aviat Space Environ Med 62: 19–25, 1991. [PubMed] [Google Scholar]
- 9.Stevens PM, Lamb LE. Effects of lower body negative pressure on the cardiovascular system. Am J Cardiol 16: 506–515, 1965. doi: 10.1016/0002-9149(65)90027-5. [DOI] [PubMed] [Google Scholar]
- 10.Cooke WH, Ryan KL, Convertino VA. Lower body negative pressure as a model to study progression to acute hemorrhagic shock in humans. J Appl Physiol 96: 1249–1261, 2004. doi: 10.1152/japplphysiol.01155.2003. [DOI] [PubMed] [Google Scholar]
- 11.Convertino VA, Ludwig DA, Cooke WH. Stroke volume and sympathetic responses to lower-body negative pressure reveal new insight into circulatory shock in humans. Auton Neurosci 111: 127–134, 2004. doi: 10.1016/j.autneu.2004.02.007. [DOI] [PubMed] [Google Scholar]
- 12.Wolthuis RA, Bergman SA, Nicogossian AE. Physiological effects of locally applied reduced pressure in man. Physiol Rev 54: 566–595, 1974. doi: 10.1152/physrev.1974.54.3.566. [DOI] [PubMed] [Google Scholar]
- 13.Giller CA, Levine BD, Meyer Y, Buckey JC, Lane LD, Borchers DJ. The cerebral hemodynamics of normotensive hypovolemia during lower-body negative pressure. J Neurosurg 76: 961–966, 1992. doi: 10.3171/jns.1992.76.6.0961. [DOI] [PubMed] [Google Scholar]
- 14.Glaister DH, Miller NL. Cerebral tissue oxygen status and psychomotor performance during lower body negative pressure (LBNP). Aviat Space Environ Med 61: 99–105, 1990. [PubMed] [Google Scholar]
- 15.Kay VL, Rickards CA. The role of cerebral oxygenation and regional cerebral blood flow on tolerance to central hypovolemia. Am J Physiol Regul Integr Comp Physiol 310: R375–383, 2016. doi: 10.1152/ajpregu.00367.2015. [DOI] [PubMed] [Google Scholar]
- 16.Levine BD, Giller CA, Lane LD, Buckey JC, Blomqvist CG. Cerebral versus systemic hemodynamics during graded orthostatic stress in humans. Circulation 90: 298–306, 1994. doi: 10.1161/01.CIR.90.1.298. [DOI] [PubMed] [Google Scholar]
- 17.Lewis NC, Bain AR, MacLeod DB, Wildfong KW, Smith KJ, Willie CK, Sanders ML, Numan T, Morrison SA, Foster GE, Stewart JM, Ainslie PN. Impact of hypocapnia and cerebral perfusion on orthostatic tolerance. J Physiol 592: 5203–5219, 2014. doi: 10.1113/jphysiol.2014.280586. [DOI] [PMC free article] [PubMed] [Google Scholar]
- 18.Rickards CA. Cerebral blood-flow regulation during hemorrhage. Compr Physiol 5: 1585–1621, 2015. [DOI] [PubMed] [Google Scholar]
- 19.Rickards CA, Ryan KL, Cooke WH, Convertino VA. Tolerance to central hypovolemia: the influence of oscillations in arterial pressure and cerebral blood velocity. J Appl Physiol 111: 1048–1058, 2011. doi: 10.1152/japplphysiol.00231.2011. [DOI] [PubMed] [Google Scholar]
- 20.Torella F, Cowley RD, Thorniley MS, McCollum CN. Regional tissue oxygenation during hemorrhage: can near infrared spectroscopy be used to monitor blood loss? Shock 18: 440–444, 2002. doi: 10.1097/00024382-200211000-00009. [DOI] [PubMed] [Google Scholar]
- 21.Hinojosa-Laborde C, Shade RE, Muniz GW, Bauer C, Goei KA, Pidcoke HF, Chung KK, Cap AP, Convertino VA. Validation of lower body negative pressure as an experimental model of hemorrhage. J Appl Physiol 116: 406–415, 2014. doi: 10.1152/japplphysiol.00640.2013. [DOI] [PMC free article] [PubMed] [Google Scholar]
- 22.Rickards CA, Johnson BD, Harvey RE, Convertino VA, Joyner MJ, Barnes JN. Cerebral blood velocity regulation during progressive blood loss compared with lower body negative pressure in humans. J Appl Physiol 119: 677–685, 2015. doi: 10.1152/japplphysiol.00127.2015. [DOI] [PMC free article] [PubMed] [Google Scholar]
- 23.Neumann S, Burchell AE, Rodrigues JCL, Lawton CB, Burden D, Underhill M, Kobetic MD, Adams ZH, Brooks JCW, Nightingale AK, Paton JFR, Hamilton MCK, Hart EC. Cerebral blood flow response to simulated hypovolemia in essential hypertension: a magnetic resonance imaging study. Hypertension 74: 1391–1398, 2019. doi: 10.1161/HYPERTENSIONAHA.119.13229. [DOI] [PMC free article] [PubMed] [Google Scholar]
- 24.Patel AR, Engstrom JE, Tusing LD, McNeeley KJ, Chelimsky TC. Lower body negative pressure: a test of cardiovascular autonomic function. Muscle Nerve 24: 481–487, 2001. doi: 10.1002/mus.1030. [DOI] [PubMed] [Google Scholar]
- 25.Potanin C, Sinclair-Smith B. Patterns of cardiac output response to acute reduction of ventricular preload and afterload pressures. Am J Cardiol 25: 662–669, 1970. doi: 10.1016/0002-9149(70)90616-8. [DOI] [PubMed] [Google Scholar]
- 26.Balldin UI, Krock LP, Hopper NL, Squires WG. Cerebral artery blood flow velocity changes following rapid release of lower body negative pressure. Aviat Space Environ Med 67: 19–22, 1996. [PubMed] [Google Scholar]
- 27.Cooke WH, Moralez G, Barrera CR, Cox P. Digital infrared thermographic imaging for remote assessment of traumatic injury. J Appl Physiol 111: 1813–1818, 2011. doi: 10.1152/japplphysiol.00726.2011. [DOI] [PubMed] [Google Scholar]
- 28.Johnson JM, Rowell LB, Niederberger M, Eisman MM. Human splanchnic and forearm vasoconstrictor responses to reductions of right atrial and aortic pressures. Circ Res 34: 515–524, 1974. doi: 10.1161/01.RES.34.4.515. [DOI] [PubMed] [Google Scholar]
- 29.Kay VL, Rickards CA. Reproducibility of a continuous ramp lower body negative pressure protocol for simulating hemorrhage. Physiol Rep 3: e12640, 2015. doi: 10.14814/phy2.12640. [DOI] [PMC free article] [PubMed] [Google Scholar]
- 30.Kay VL, Sprick JD, Rickards CA. Cerebral oxygenation and regional cerebral perfusion responses with resistance breathing during central hypovolemia. Am J Physiol Regul Integr Comp Physiol 313: R132–R139, 2017. doi: 10.1152/ajpregu.00385.2016. [DOI] [PubMed] [Google Scholar]
- 31.Poh PY, Gagnon D, Romero SA, Convertino VA, Adams-Huet B, Crandall CG. Hemodynamic stability to surface warming and cooling during sustained and continuous simulated hemorrhage in humans. Shock 46: 42–49, 2016. doi: 10.1097/SHK.0000000000000661. [DOI] [PMC free article] [PubMed] [Google Scholar]
- 32.Fagius J, Karhuvaara S. Sympathetic activity and blood pressure increases with bladder distension in humans. Hypertension 14: 511–517, 1989. doi: 10.1161/01.HYP.14.5.511. [DOI] [PubMed] [Google Scholar]
- 33.Levine BD, Lane LD, Buckey JC, Friedman DB, Blomqvist CG. Left ventricular pressure-volume and Frank-Starling relations in endurance athletes. Implications for orthostatic tolerance and exercise performance. Circulation 84: 1016–1023, 1991. doi: 10.1161/01.CIR.84.3.1016. [DOI] [PubMed] [Google Scholar]
- 34.Curran-Everett D. Evolution in statistics: P values, statistical significance, kayaks, and walking trees. Adv Physiol Educ 44: 221–224, 2020. doi: 10.1152/advan.00054.2020. [DOI] [PubMed] [Google Scholar]
- 35.Curran-Everett D, Benos DJ. Guidelines for reporting statistics in journals published by the American Physiological Society. Am J Physiol Regul Integr Comp Physiol 287: R247–249, 2004. doi: 10.1152/ajpregu.00346.2004. [DOI] [PubMed] [Google Scholar]
- 36.Huang M, Brothers RM, Ganio MS, Lucas RAI, Cramer MN, Moralez G, Convertino VA, Crandall CG. Tolerance to a haemorrhagic challenge during heat stress is improved with inspiratory resistance breathing. Exp Physiol 103: 1243–1250, 2018. doi: 10.1113/EP087102. [DOI] [PMC free article] [PubMed] [Google Scholar]
- 37.Hinojosa-Laborde C, Aden JK, Goei KA, Convertino VA. Evidence for a higher risk of hypovolemia-induced hemodynamic instability in females: implications for decision support during prehospital triage. Mil Med 180: 19–23, 2015. doi: 10.7205/MILMED-D-14-00394. [DOI] [PubMed] [Google Scholar]
- 38.Hinojosa-Laborde C, Ryan KL, Rickards CA, Convertino VA. Resting sympathetic baroreflex sensitivity in subjects with low and high tolerance to central hypovolemia induced by lower body negative pressure. Front Physiol 5: 241, 2014. doi: 10.3389/fphys.2014.00241. [DOI] [PMC free article] [PubMed] [Google Scholar]
- 39.Lightfoot JT, Tsintgiras KM. Quantification of tolerance to lower body negative pressure in a healthy population. Med Sci Sport Exer 27: 697–706, 1995. [PubMed] [Google Scholar]
- 40.Powers WJ. Cerebral hemodynamics in ischemic cerebrovascular disease. Ann Neurol 29: 231–240, 1991. doi: 10.1002/ana.410290302. [DOI] [PubMed] [Google Scholar]
- 41.Pollard V, Prough DS, DeMelo AE, Deyo DJ, Uchida T, Stoddart HF. Validation in volunteers of a near-infrared spectroscope for monitoring brain oxygenation in vivo. Anesth Analg 82: 269–277, 1996. doi: 10.1097/00000539-199602000-00010. [DOI] [PubMed] [Google Scholar]
- 42.Subudhi AW, Olin JT, Dimmen AC, Polaner DM, Kayser B, Roach RC. Does cerebral oxygen delivery limit incremental exercise performance? J Appl Physiol 111: 1727–1734, 2011. doi: 10.1152/japplphysiol.00569.2011. [DOI] [PMC free article] [PubMed] [Google Scholar]
- 43.Lightfoot JT, Febles S, Fortney SM. Adaptation to repeated presyncopal lower body negative pressure exposures. Aviat Space Environ Med 60: 17–22, 1989. [PubMed] [Google Scholar]
- 44.Al-Khazraji BK, Shoemaker LN, Gati JS, Szekeres T, Shoemaker JK. Reactivity of larger intracranial arteries using 7 T MRI in young adults. J Cereb Blood Flow Metab 39: 1204–1214, 2019. doi: 10.1177/0271678X18762880. [DOI] [PMC free article] [PubMed] [Google Scholar]
- 45.Coverdale NS, Gati JS, Opalevych O, Perrotta A, Shoemaker JK. Cerebral blood flow velocity underestimates cerebral blood flow during modest hypercapnia and hypocapnia. J Appl Physiol 117: 1090–1096, 2014. doi: 10.1152/japplphysiol.00285.2014. [DOI] [PubMed] [Google Scholar]