


Keywords: achalasia, eosinophilic esophagitis, gastroesophageal reflux disease, peristaltic work, scleroderma
Abstract
The goal of this study was to conceptualize and compute measures of “mechanical work” done by the esophagus using data generated during functional lumen imaging probe (FLIP) panometry and compare work done during secondary peristalsis among patients and controls. Eighty-five individuals were evaluated with a 16-cm FLIP during sedated endoscopy, including asymptomatic controls (n = 14) and those with achalasia subtypes I, II, and III (n = 15, each); gastroesophageal reflux disease (GERD; n = 13); eosinophilic esophagitis (EoE; n = 9); and systemic sclerosis (SSc; n = 5). The FLIP catheter was positioned to have its distal segment straddling the esophagogastric junction (EGJ) during stepwise distension. Two metrics of work were assessed: “active work” (during bag volumes ≤ 40 mL where contractility generates substantial changes in lumen area) and “work capacity” (for bag volumes ≥ 60 mL when contractility cannot substantially alter the lumen area). Controls showed median [interquartile range (IQR)] of 7.3 (3.6–9.2) mJ of active work and 268.6 (225.2–332.3) mJ of work capacity. Patients with all achalasia subtypes, GERD, and SSc showed lower active work done than controls (P ≤ 0.003). Patients with achalasia subtypes I and II, GERD, and SSc had lower work capacity compared with controls (P < 0.001, 0.004, 0.04, and 0.001, respectively). Work capacity was similar between controls and patients with achalasia type III and EoE. Mechanical work of the esophagus differs between healthy controls and patient groups with achalasia, EoE, SSc, and GERD. Further studies are needed to fully explore the utility of this approach, but these work metrics would be valuable for device design (artificial esophagus), to measure the efficacy of peristalsis, to gauge the physiological state of the esophagus, and to comment on its pumping effectiveness.
NEW & NOTEWORTHY Functional lumen imaging probe (FLIP) panometry assesses esophageal response to distension and provides a simultaneous assessment of pressure and dimension during contractility. This enables an objective assessment of “mechanical work” done by the esophagus. Eighty-five individuals were evaluated, and two work metrics were computed for each subject. Controls showed greater values of work compared with individuals with achalasia, gastroesophageal reflux disease (GERD), and systemic sclerosis (SSc). These values can quantify the mechanical behavior of the distal esophagus and assist in the estimation of muscular integrity.
INTRODUCTION
The esophagus is a tubular organ that functions as a conduit between the pharynx and the stomach. In the absence of gravitational effects, esophageal peristalsis is key to moving fluid along the tube (1). Under certain conditions relating to degradation of nerves or muscle layers in the esophageal wall (achalasia or scleroderma), peristalsis is ineffective, and bolus transport is adversely affected (2, 3). In addition to ineffective motility, the neural/muscular degradation can also manifest as an outflow obstruction (OO) at the esophagogastric junction (EGJ). In this scenario, the lower esophageal sphincter (LES) remains closed, and food is stuck in the esophagus. Common practice for identifying these disorders involves using high-resolution manometry (HRM) to record pressures observed during swallowing. With the help of the Chicago Classification (4), achalasia-related disorders can then be classified based on pressurization patterns observed during HRM, and appropriate treatment paths can be prescribed. Although this approach successfully assesses primary peristalsis, there are some limitations with HRM. By design, contraction pressure is measured by direct contact of the esophageal wall with the sensors. This leads to reported pressure readings significantly greater than the actual intrabolus pressure (5, 6). Additionally, since the only reliable pressure that is measured is tactile in nature, the walls can lose contact with the sensors during luminal opening (7). Consequently, the magnitude of relaxation cannot be reliably captured with the pressure readings (8). Finally, the HRM catheter and standard test protocol assess primary peristalsis but not secondary peristalsis, which can also impact both dysphagia and gastroesophageal reflux disease (GERD) (9–11).
The functional lumen imaging probe (FLIP) panometry technique was developed to visualize peristaltic activity in response to distension and measure associated pressure changes (9, 12). The FLIP consists of a 16-cm-long polyurethane bag mounted at the distal end of a catheter. Saline is used to fill the bag to achieve lumen dilation. Housed on the catheter and within the bag are several planimetry sensors and a pressure sensor that facilitate visualization of the cross-sectional area (CSA) of the bag within the esophagus and measure the pressure within it. Figure 1 shows the location of the planimetry and pressure sensor on the catheter and the bag that surrounds them. Also shown is the most common configuration of the device when placed within the esophagus.
Figure 1.

FLIP catheter details and the most common device placement configuration within the esophagus. Close-up of the FLIP probe/bag and internal details of the sensors (A); FLIP bag placed across the EGJ and pressure sensor is in the stomach (B; note that external data storage and computer display system is not shown). EGJ, esophagogastric junction; FLIP, functional lumen imaging probe.
An advantage of the FLIP probe is that fluid pressure changes are associated with changes in the lumen’s CSA as the peristaltic wave travels over the span of the imaging segment. Because saline cannot leave the bag, no fluid transport takes place. To assess the effectiveness of peristaltic activity, current approaches qualitatively assess FLIP topography plots (9, 13) and note if the EGJ is able to fully open. To augment this examination, we propose a quantitative approach for motility analysis that utilizes the abundant pressure and area data generated by the device to compute “mechanical work” done by a contractile wave. With the help of this concept, we can describe the vigor of a contractile wave by a set of work metrics. Furthermore, we aimed to compare these parameters of contractile work between healthy controls and clinical cohorts of esophageal disorders: achalasia, GERD, eosinophilic esophagitis (EoE), and systemic sclerosis (SSc).
METHODS
Subjects
The study protocol was approved by the Northwestern University Institutional Review Board. Adult patients presenting to the Esophageal Center of Northwestern for evaluation of esophageal symptoms between November 2012 and October 2018 who completed FLIP in conjunction with endoscopy were prospectively evaluated, and data were incorporated into a motility registry. The motility registry was retrospectively interrogated to identify specific patient cohorts for inclusion. Completion of HRM was required for inclusion of patients with achalasia, GERD, and systemic sclerosis but not for patients with EoE. Patients with achalasia were identified and subtyped (type I, II, or III) based on HRM interpreted according to the Chicago Classification v. 3.0 (4). Patients with “GERD” were identified by history of presence of erosive esophagitis (Los Angeles Grade A or B) on endoscopy or a positive ambulatory esophageal pH-metry performed off of proton pump inhibitor therapy (percent time pH < 4 greater than 6%) but excluding patients with GERD with hiatal hernia. Patients with EoE not being actively treated with topical steroid or elimination diet (proton pump inhibitor, PPI use was accepted) were identified based on eosinophilia on esophageal biopsies and endoscopic findings of rings and/or furrows. Patients with SSc were identified based on a clinical-rheumatologic diagnosis. A cohort of healthy volunteers without esophageal symptoms (“controls”) were also included. In addition, two other patients diagnosed with EoE underwent FLIP panometry with a device prototype that had two pressure sensors that measured both distal and proximal pressure. Informed written consent was obtained from all subjects, and control subjects were paid for their participation. There is overlap between these patients and previously described cohorts (13, 14).
Study Protocol
Esophageal motility evaluations were completed after a minimum 6-h fast. Endoscopy performed in the left-lateral decubitus position was generally performed using conscious sedation with midazolam and fentanyl. All of the controls were studied using conscious sedation. Other medications, e.g., propofol, were also used with monitored anesthesia care at the discretion of the performing endoscopist in some patient cases. Although these medications used for endoscopic sedation can alter esophageal motility, the patterns of motility during the FLIP protocol are reproducible and have been shown to predict motility patterns during standard manometry performed without these medications (13–16). The 16-cm FLIP (EndoFLIP EF-322N; Medtronic, Shoreview, MN) was calibrated to atmospheric pressure before trans-oral probe placement. With the endoscope withdrawn, the FLIP was positioned within the esophagus such that one to three impedance sensors were observed beyond the EGJ, with this positioning maintained throughout the FLIP study (Fig. 1). Stepwise 10-ml balloon distension beginning with 20 mL and increasing to target volume of 70 mL was performed; each stepwise distension volume was maintained for 30–60 s. Contractility on FLIP was identified as transient decreases in the luminal diameter within the esophageal body in three or more adjacent impedance planimetry channels, i.e., 2 cm in axial length. A pattern of repetitive antegrade contractions (RACs) was identified when six or more consecutive antegrade contractions of ≥ 6-cm axial length occurred at a regular rate of 6 ± 3 contractions per minute (17). High-resolution manometry (HRM) studies consisting of ten 5-mL, liquid swallows in supine position were completed using a solid-state assembly with 36 circumferential pressure sensors at 1-cm intervals (Medtronic) and interpreted according to the Chicago Classification v. 3.0 (4). Ambulatory reflux monitoring was performed after withholding PPI therapy for at least 7 days with either wireless pH capsule (Bravo, Medtronic) or 24-h ambulatory impedance-pH study with a catheter containing two antimony pH electrodes positioned at 5 cm above the EGJ and 10 cm below the EGJ (Sandhill Scientific, Highlands Ranch, CO).
Analysis Work Done During Occluding Contractions: Active Work
In this and the following subsections, we develop the concept of work and the method of computing work to quantify peristaltic pumping effort. Work is a transfer of useful energy; it is defined as the product of force and its associated displacement. In the context of the esophagus, muscles do work to generate pressure, move the bolus, and eventually transfer it into the stomach. Similarly, during peristaltic activity in the FLIP at moderate bag volumes (≤40 mL), the esophagus contracts and causes the pressure to rise in the bag. But the key difference is that unlike normal bolus transport, the polyurethane bag prevents any saline from emptying into the stomach. At the site of contraction, the lumen area decreases. To accommodate the fluid that has been forced out of the contraction site, the remainder of the bag (and the esophageal segment) expands. For heuristic purposes, we can equate these pressure changes to changes in force, and changes in lumen area as equivalent to displacement of the esophageal wall. Thus, the combination of pressure and changes in lumen area can be defined as “work.” The specific details of this combination and the mathematical model of the FLIP along with the derivation of the various types of work can be found in (18, 19). In this work, we will focus on understanding the combined esophageal wall and bag dynamics during peristalsis.
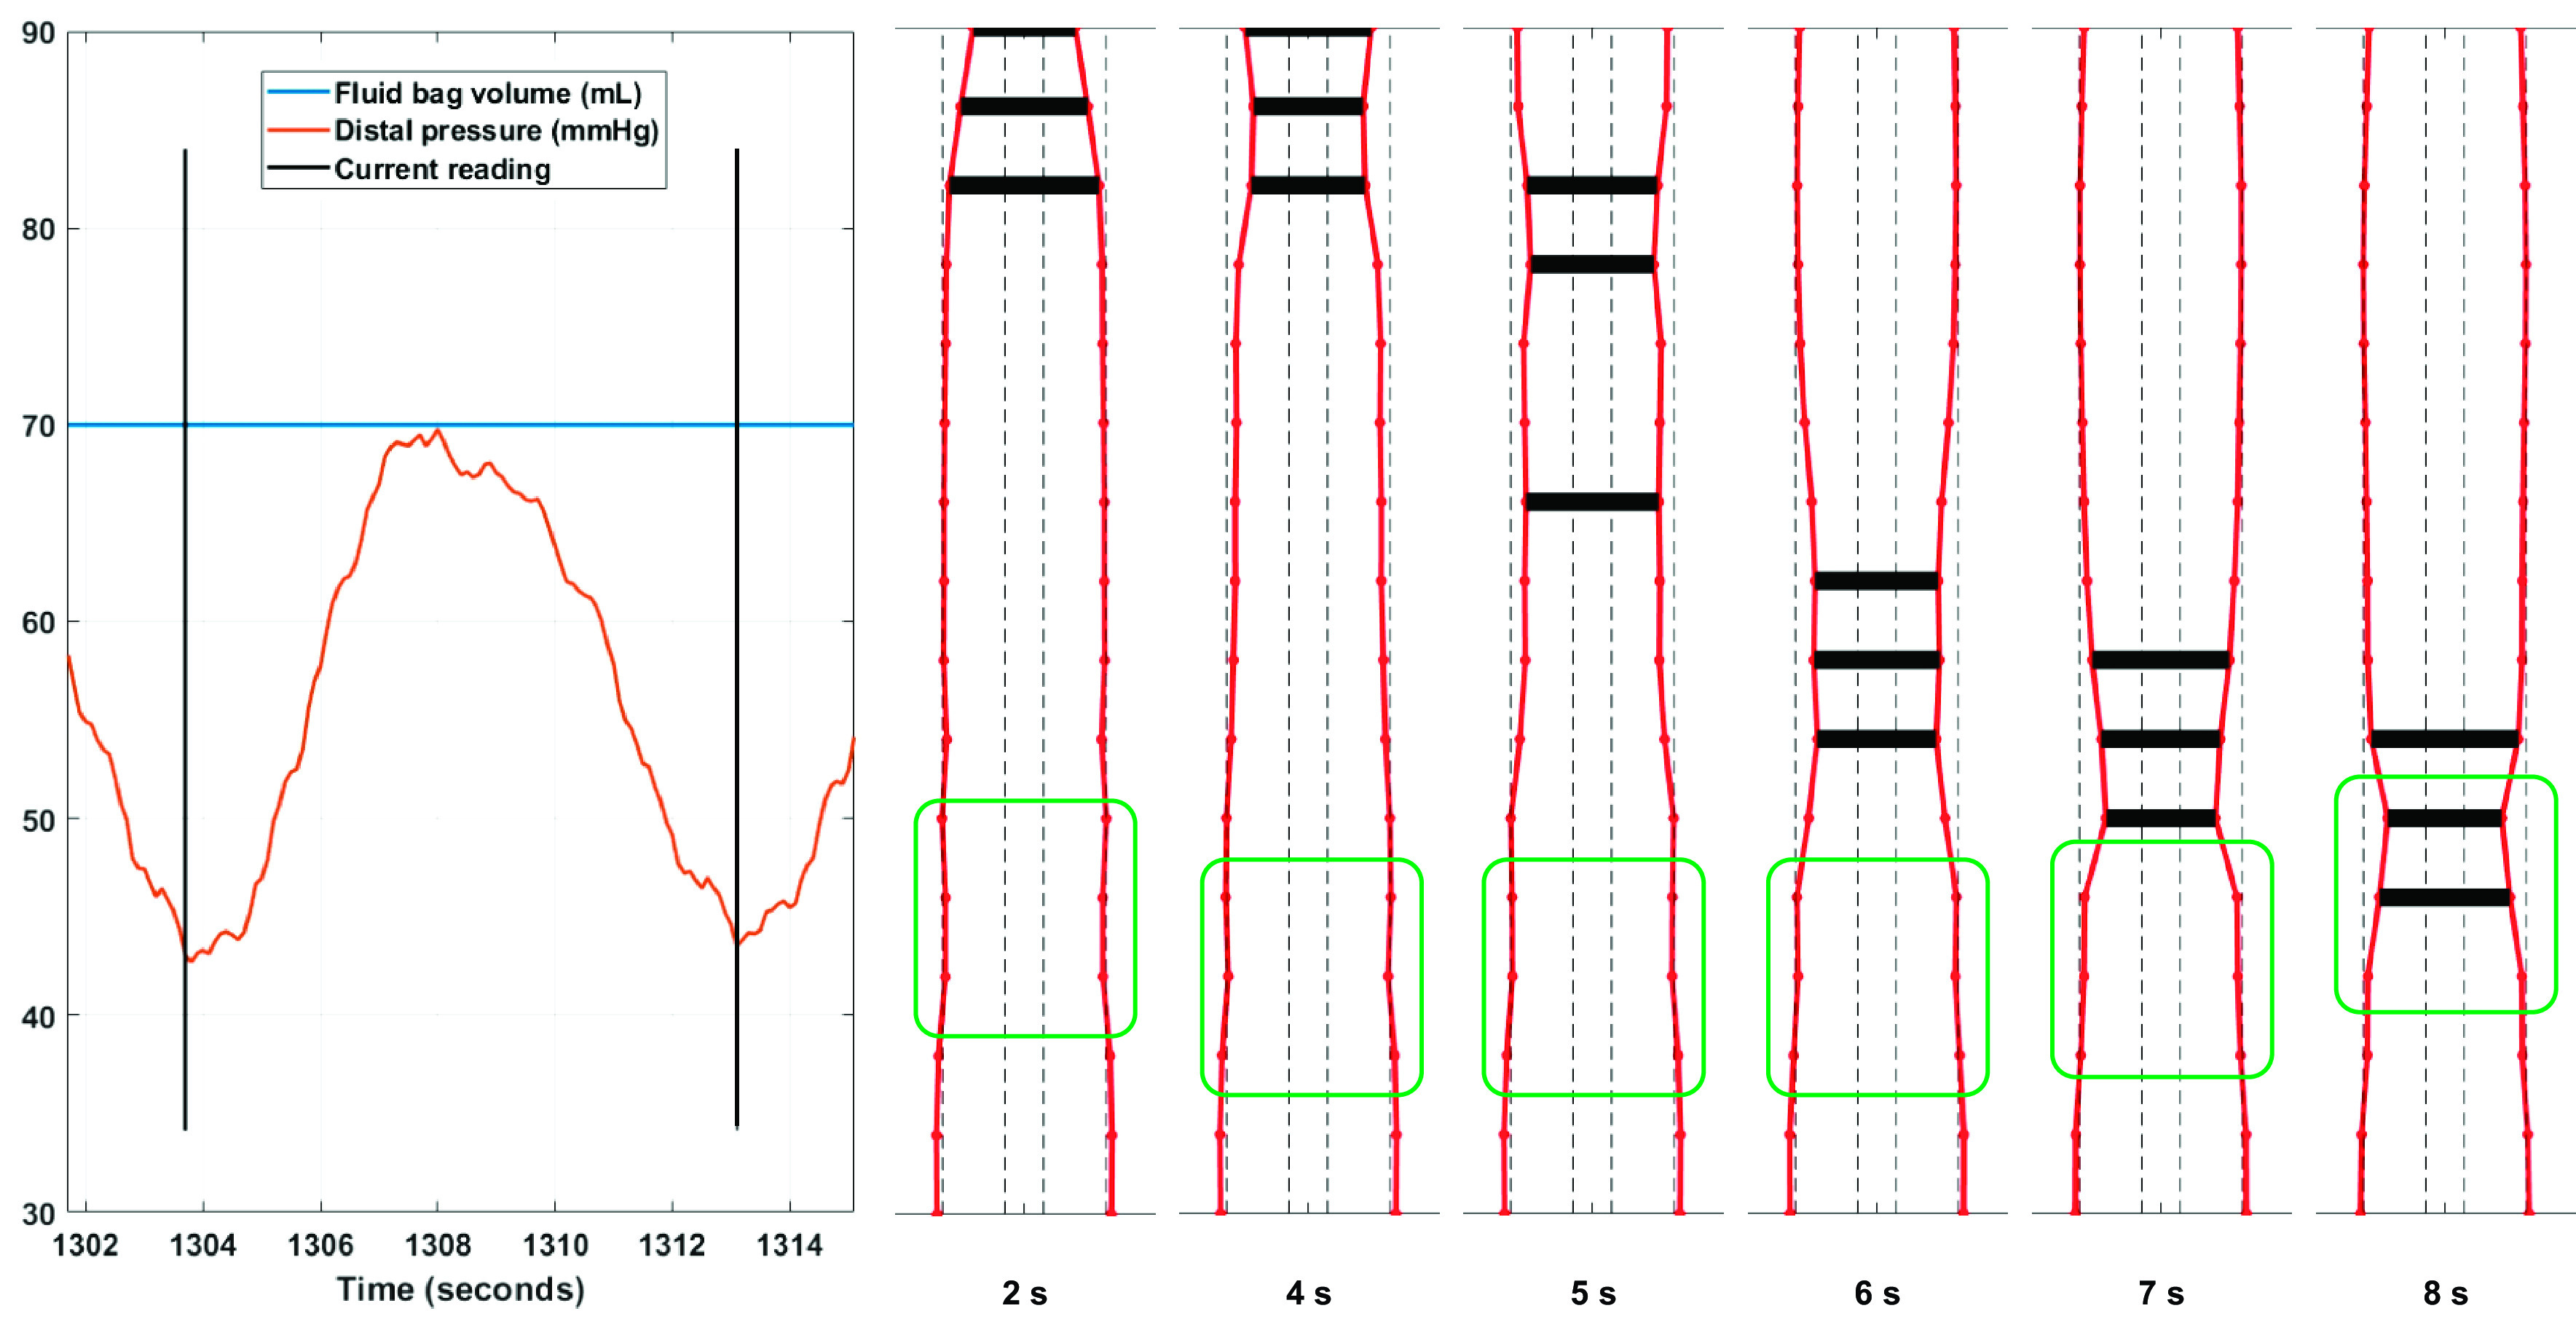
A complete sequence of events is depicted in Fig. 2, in which we plot the esophageal lumen profile as detected by the planimetry sensors during a single peristaltic wave. The first frame shows the esophagus before the contraction begins. The EGJ is closed, and this is visible by three horizontal black lines depicting the smallest diameter at each instant. The onset of the peristaltic wave is visible in the second frame. As the wave travels, fluid is pushed into the distal part of the bag, which results in the dilatation of the esophagus in this region. Dilatation of this segment continues to increase as the wave travels distally. Once the bag reaches the infinite compliance limit (ICL), i.e., the diameter at which the FLIP bag’s mechanical properties are engaged and resist further increase in luminal CSA (20), it cannot dilate much further. Fluid now begins to flow back through the contraction zone, and at this point, the contraction is essentially driving fluid out of the distal segment. This is evidenced by the dilatation of the proximal segment of the bag behind the contraction zone. Eventually, peristalsis is complete, and the esophagus returns to its resting state with the EGJ regaining its resting tone. From this analysis, we see that the peristaltic wave is the reason for dilatation of the esophagus outside of the contraction zone. Along with the infinite compliance limit, it is also the reason for backward flow through the contraction.
Figure 2.

Image sequence showing a typical peristaltic wave traveling over the FLIP bag in a control subject (bag volume: 40 mL). Dilatation of the proximal segment of the bag is observed when fluid from the distal segment rushes back through the contraction zone. Solid black lines highlight the contraction. Dotted lines show the limits of accurate diameter measurement. Green boxes highlight sensors that span the EGJ. The bag ends cannot be plotted, as the imaging length is shorter than the length of the bag. EGJ, esophagogastric junction; FLIP, functional lumen imaging probe.
It is clear that the contraction does work to move the fluid in the bag and to stretch the walls of the esophagus. The motion of a fluid is accompanied by a pressure drop due to viscous losses. So, at any given time during peristalsis, some energy is stored in the walls of the esophagus as they are stretched. Some work is done when the kinetic energy of the fluid changes, and the rest is lost due to frictional forces in the fluid (viscosity). The sum of this energy is henceforth referred to as “active work.” The equation below summarizes this balance:
| (1) |
As the shape of the esophagus returns to its original state at the termination of the contraction, the amount of energy stored in the stretched walls, i.e., the “passive work,” returns to its base value (which can be set to zero as a reference). From our theoretical analysis, we found that the fluid kinetic energy changes are almost negligible. That indicates that at the end of the contraction, the active work done is equal to the amount of energy lost due to viscosity as a result of the backward flow of saline through the contraction. It is this value that we compute and compare for each individual in our study for moderate operating volumes of the FLIP. The variation of each of the terms in Eq. 1 during a contraction will be further explained in the context of results obtained from an asymptomatic control in the following section (an example is given in Fig. 3).
Figure 3.

Left: work curves for a typical secondary peristaltic contraction in an asymptomatic control. The active work curve is the sum of the viscous, kinetic energy (KE) and passive work curves. Its sign simply indicates that it is on the left-hand side of Eq. 1. Right: corresponding shape of the distal esophagus plotted at different times to visualize the variation of lumen geometry and wall dilation during peristalsis.
Approach for Computation of Active Work
For each individual, antegrade contractions occurring at or around 40-mL bag volume were analyzed. In subjects with irregular or absent motility, a window of readings spanning 10 s was chosen to reflect the approximate duration of a normal contraction. The fluid mechanics program reads in the planimetry and pressure data to compute the active work done during the selected window of readings. By default, the FLIP system provides the pressure signal at a single point (located distally as shown in Fig. 1), and CSA is measured at 16 locations along the imaging length at a frequency of 10 Hz. To estimate the various work terms, it is vital to obtain the fluid pressure at all locations along the imaging length. Additionally, the velocity of the fluid in the bag is required to compute the associated viscous losses. These unknown quantities are computed using the aforementioned fluid-mechanics-based FLIP model (18).
Work Capacity at Higher Operating Volumes
For high FLIP bag volumes (≥60 mL), the polyurethane bag is close to fully taut at all times, and the entire bag is close to the ICL. Hence, the contraction does not appreciably change the CSA. As such, there is very little fluid motion inside the bag. Peristalsis appears to be ineffective but is still capable of significantly increasing the fluid pressure. We hypothesize that this pressurization could indicate the maximum “work capacity” of the esophagus. To compute the peristaltic effort in this setting, we propose a simple metric that is the product of the bag volume with the maximum change in pressure brought on by the contraction. This definition is motivated by the concept of “shaft work” commonly applied to devices such as pumps and turbines, which have a constant rate of flow through them. A similar definition was also used to compute detrusor work and the energy needed to empty the urinary bladder (21). For contractions occurring at high bag volumes, as shown in Fig. 4, the first step was to find the difference between the pressure at the beginning of the contraction and the peak pressure value achieved for the duration of wave travel. The product of this quantity with the current bag volume is reported as the work capacity.
Figure 4.
Variation of lumen profile for secondary peristalsis occurring at high bag volumes. This figure illustrates the lack of significant changes in the lumen diameter due to high volume of saline in the bag. Observe how the lumen profile is close to or at the outer dotted lines indicative of the infinite compliance limit. If information about bag volume and pressure were unknown, observing lumen area variations alone might lead one to conclude that peristalsis was ineffective.
It is important to note the physiological and device-related factors that can affect the computed value of peristaltic work. Active work is primarily influenced by the strength and speed of the contraction. From an operating standpoint, the viscosity of the fluid in the bag has a significant effect on the work done (greater fluid viscosity would lead to greater values of active work done). The effect of the bag on active work is small; however, the diameter of the catheter can have some effect on the computed value of work. If the catheter diameter were greater, the contraction would generate higher pressure differences (as it would be able to form a better “grip” around the catheter), leading to greater values of active work. Passive work almost exclusively depends on the stiffness of the distal esophageal wall. If the stiffness were greater due to inadequate distension-induced relaxation or some fibrosis, the value of passive work would be greater than normal. Work capacity depends on the strength of the contraction alone, and contraction speed has little effect on the bag pressure for this region of operation.
Statistical Analysis
All the computed mechanical work values have the units of millijoules (mJ) unless otherwise noted. These values are expressed as the median along with interquartile ranges (IQR). Different groups were compared using the Kruskal–Wallis test, and pair-wise comparisons were conducted using the Wilcoxon–Mann–Whitney rank sum test. A P value of 5% or lower was assumed to be sufficient to indicate statistical significance. The MATLAB Statistics toolbox was used to compare mechanical work values between controls and disease groups.
RESULTS
Cohort Characteristics
The demographic and esophageal motility characteristics among the six patient cohorts are displayed in Table 1. All of the controls had a RAC pattern of distension-induced contractility on FLIP. None of the patients with achalasia had a normal RAC pattern, though two of 15 (13%) patients with achalasia type I, nine of 15 (60%) patients with achalasia type II, and 15 of 15 patients with achalasia type III had other contractility observed. An RAC pattern was observed in two of 14 (14%) patients with GERD, one of eight (12%) patients with EoE, and zero patient with SSc, whereas contractility not in an RAC pattern was observed in 13 of 14 (93%) patients with GERD, eight of eight patients with EoE, and three of five (60%) patients with SSc.
Table 1.
Summary of cohort information
| Type I | Type II | Type III | GERD | EoE | SSc | Control | |
|---|---|---|---|---|---|---|---|
| n | 15 | 15 | 15 | 13 | 8 | 5 | 14 |
| Age, years, median (IQR) | 48 (43–59) | 43 (31–59) | 59 (55–65) | 48 (28–58) | 40.5 (31–46) | 59 (37–65) | 27 (23–31) |
| Female, n | 9 | 7 | 4 | 7 | 1 | 3 | 13 |
| HRM classification, n (%) | na | 2—no HRM | |||||
| Type I achalasia | 15 (100) | ||||||
| Type II achalasia | 15 (100) | ||||||
| Type III achalasia | 15 (100) | ||||||
| Absent contractility | 3 (60) | ||||||
| IEM | 2 (15) | 1 (20) | |||||
| Normal motility | 11 (77) | 10 (77) | |||||
| EGJOO | 1 (8)* | 1 (20)† | 1 (8)* | ||||
| IRP, mmHg, median (IQR) | 28 (17–39) | 35 (24–46) | 23 (18–40) | 12 (7–13) | na | 12 (3–14) | 12 (8–13) |
| Basal EGJ pressure, mmHg, median (IQR) | 25 (15–39) | 27 (20–36) | 36 (13–39) | 13 (8–24) | 18 (5–25) | 16 (11–24) |
In addition to median integrated relaxation pressure (IRP) 15 mmHg yielding classification of EGJOO, *patients had normal peristalsis and †patient had ineffective peristalsis. EoE, eosinophilic esophagitis; EGJOO, esophagogastric outflow obstruction; GERD, gastroesophageal reflux disease; HRM, high-resolution manometry; IEM, ineffective esophageal motility; IQR, interquartile range; na, not available; SSc, systemic sclerosis.
Predicting Pressure Variations in the Bag During Contractility
Using planimetry data along with pressure readings from the distal end, the FLIP mechanical model predicts the fluid velocity and pressure at all points along the imaging length for each instant of the contraction. In Fig. 5, we compare the proximal pressure predicted by our model to pressures measured at the proximal location by a FLIP prototype that was constructed with two pressure sensors (one at each end) instead of just one at the distal end. The figures show experimentally captured distal and proximal pressure signals in two subjects with EoE (with some observed contractility) during an antegrade contraction. In each of the three contractions, the proximal pressure sensor shows two peaks occurring in the span of a single contraction. The first peak occurs as the peristaltic wave passes over the proximal pressure sensor. As this wave carries fluid away from the proximal segment, we notice the pressure in this region drops. But once the distal part of the bag reaches its ICL, fluid begins to rush back into the proximal segment. At this time, the proximal pressure begins to increase. This “inversion” behavior is also captured by our FLIP model, and we observe the estimated proximal pressure curve to have two peaks as well. It must be noted that although the first peak is captured well by our model, there is some discrepancy in the timing and magnitude of the second peak. This is primarily because fluid flow through the contraction is a complex phenomenon. Because of high speed, the flow can be turbulent and the geometry of the channel in the region of contraction is extremely irregular. This irregularity is due to the folds in the polyurethane bag and due to significant nonuniform contact between the bag and the catheter. As these effects cannot be captured in a reasonably detailed model, the exact prediction of the second peak’s timing and magnitude is not possible at this moment. However, qualitatively speaking, capturing the dip in the proximal pressure and the emergence of the second peak gives us a satisfactory estimation of the work done by the enclosed fluid. It can be mathematically shown that assuming a constant pressure distribution along the tube length leads to the pressure work to be zero. Thus, using the model to estimate the proximal pressure is vital to generate sensible predictions from FLIP data. This key result also shows that pressure in the bag is not uniform at each instant. Aside from pressure differences created between the distal and proximal segments of the bag due to a tightly closed EGJ, peristalsis itself can lead to significant variations in pressure due to the greater pressurization of the distal segment and the associated flow through the contraction. Thus, it would be necessary to house two pressure sensors within the FLIP (one each at the proximal and distal ends) instead of a single distal sensor to obtain a better understanding of the pressure difference created due to EGJ closure or during peristaltic contractions.
Figure 5.
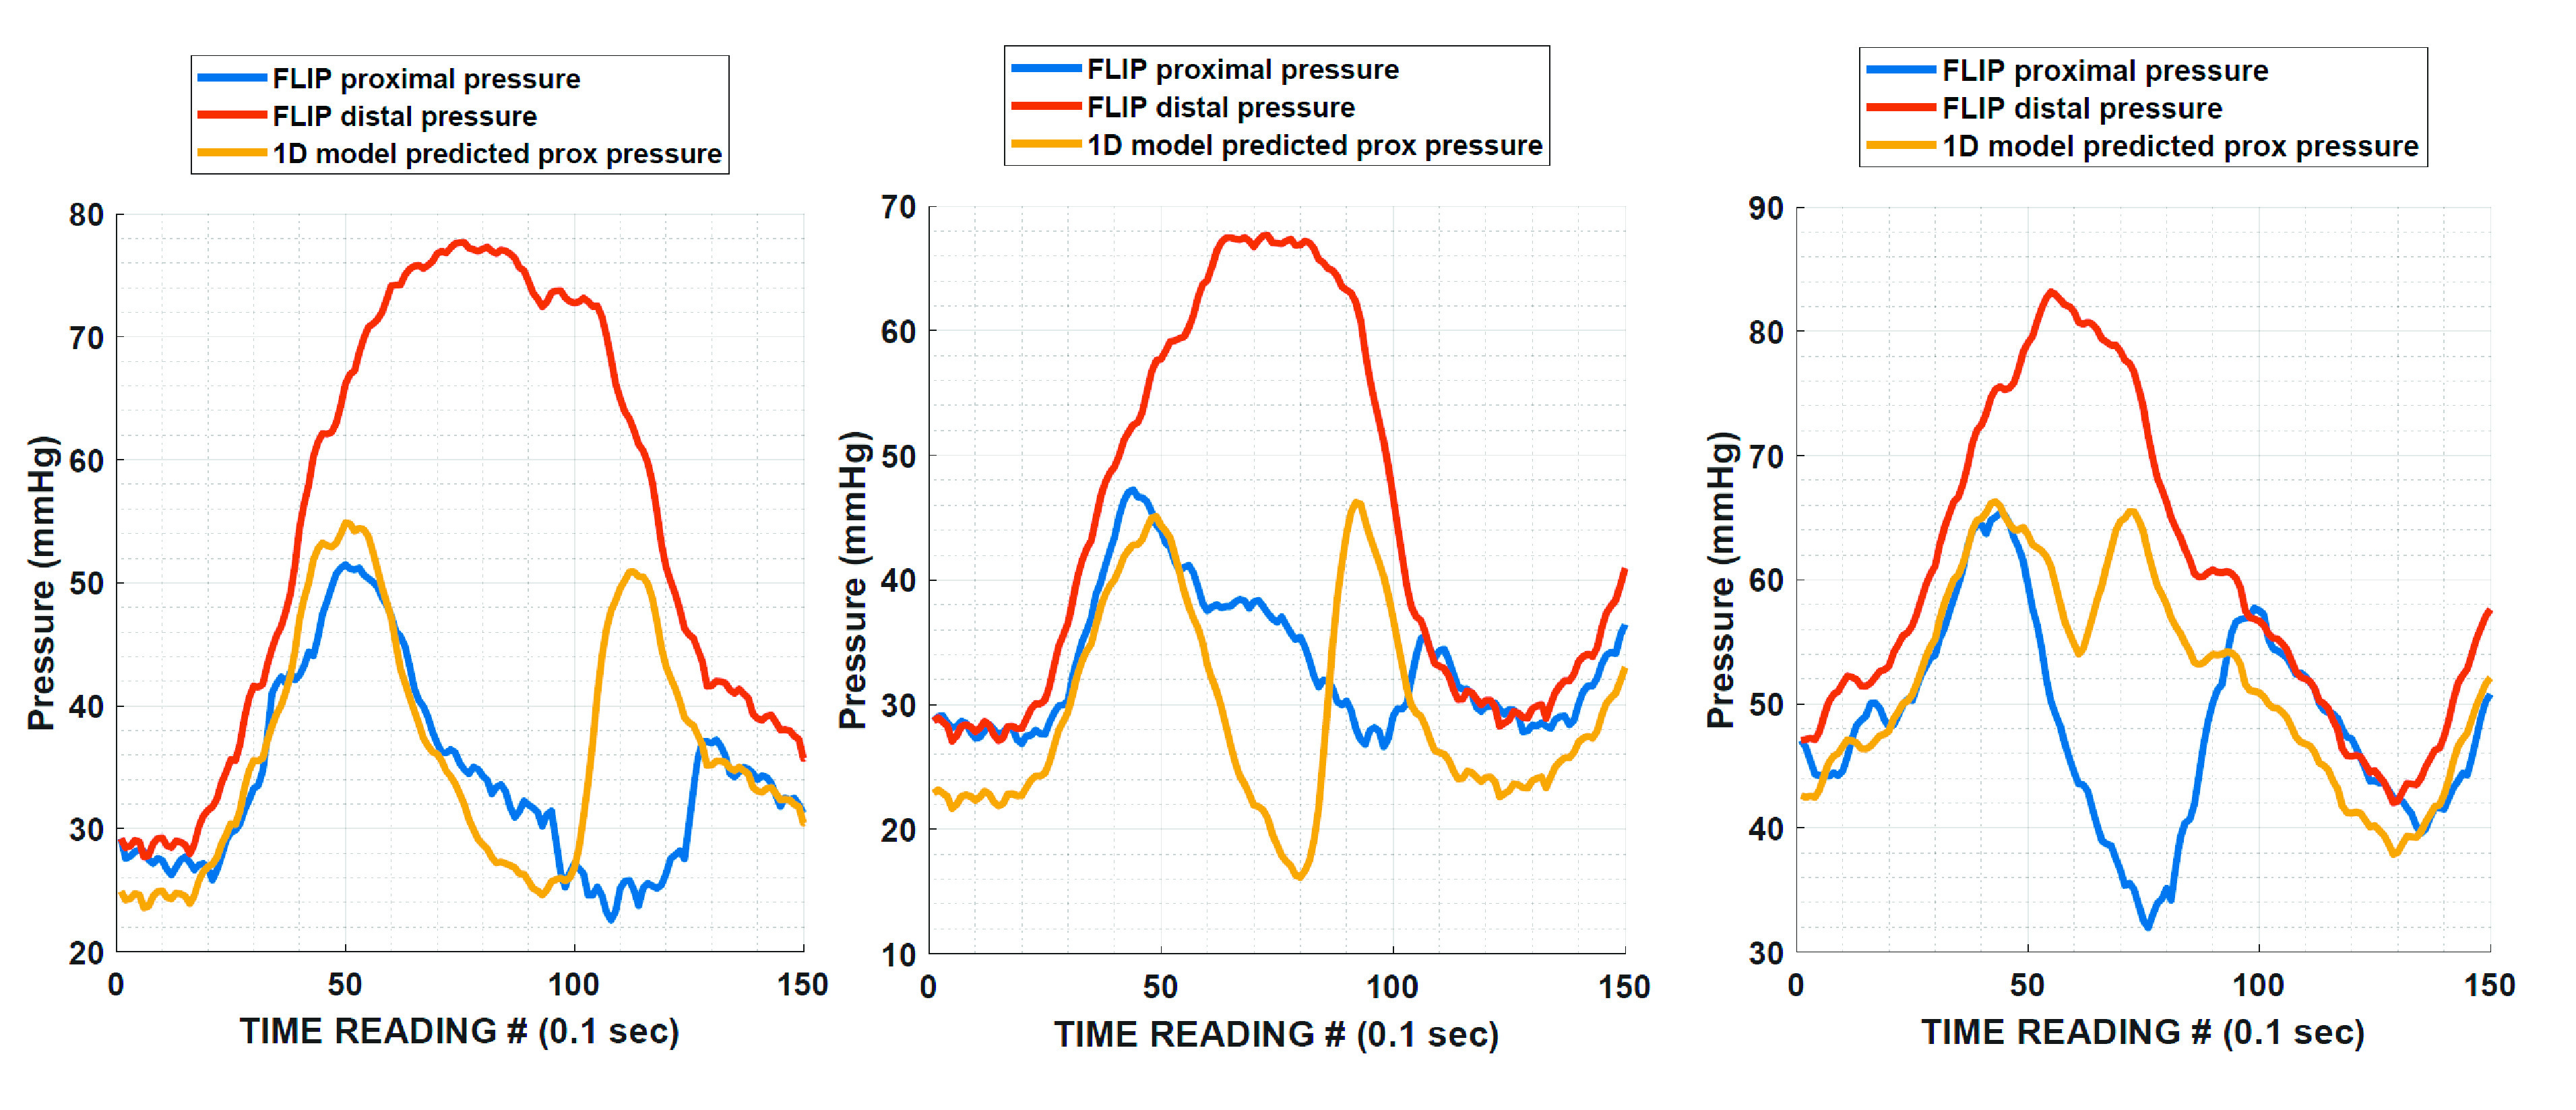
Comparing measured proximal pressure to the proximal pressure estimated from the 1 D fluid-mechanics model of the FLIP. Each example covers 15 s of time. Duration of each contraction is 10 s on average. Note the presence of two peaks in the proximal pressure signal in both the observed and estimated pressure readings. Measurements from the prototype and predictions from the FLIP 1 D mathematical model both indicate that the pressure in the bag during contractility is nonuniform. FLIP, functional lumen imaging probe.
Variation of the Work Curves for a Typical Contraction
In Fig. 3, we plotted the variation of each of the computed work terms for a typical peristaltic event in a control subject. At the beginning of the contraction, the total active work done is zero and the esophagus is in its undeformed rest state. As the contraction begins, it drives fluid into the distal segment of the esophagus causing the walls to stretch and store energy. The passive work curve shows this increase in stored energy as the wave advances. As the walls stretch, the infinite compliance limit of the bag is reached, and further expansion is not possible, and the passive work curve plateaus. The restriction of further dilatation causes fluid to flow back through the narrow contraction and into the proximal segment of the bag. This is when the viscous work sharply increases. Eventually, the peristaltic event finishes traveling over the bag, the stretched part of the esophagus returns to its original shape, and the stored energy, i.e., the passive work value falls back to zero. In the end, the magnitude of active work is equal to the energy loss due to viscous effects. At any given instant, the values given by the curves sum to zero indicating that Eq. 1 is satisfied.
Active Work Observed in Each Group
Active work done in controls had a median (IQR) value of 7.3 (3.6–9.2) mJ. These values were greater than active work values computed for all three achalasia subtypes (P < 0.0001). Three patients in the type III group had contractions that were fully lumen occluding. The work values computed for these individuals were substantially greater than the rest of the group and are depicted as outliers in the plot. However, considered as a whole, this group also showed significantly less work done compared with controls. Patients with GERD showed median (IQR) of 2.6 (0.99–3.6) mJ of active work done and was less than controls (P < 0.003). When subjects with GERD with normal motility (n = 11) were compared with controls, they also showed significantly less work done (P < 0.04). Patients with EoE showed a median (IQR) value of 1.35 (0.7–7.65) mJ of active work done, which trended less than in controls (P < 0.11). Given the absence of contractile activity in the SSc group, the active work values ranged from 0.06 to 0.8 mJ. These values were found to be significantly less than controls (P < 0.0002), patients with GERD (P < 0.02), and patients with EoE (P < 0.046). A summary of the values of active work observed in each group is given in Fig. 6.
Figure 6.

Active work done by the esophagus for fully occluding contractions. Units of the quantity shown on the y-axis is millijoules of energy. Data were computed from the FLIP fluid-mechanics code for contractions occurring at 40-mL bag volume. Outliers are marked with red plus (+) signs. EoE, eosinophilic esophagitis; FLIP, functional lumen imaging probe; GERD, gastroesophageal reflux disease; SSc, systemic sclerosis.
Work Capacity Observed in Each Group
Compared with controls, patients with achalasia subtypes I and II showed significantly lower capacity for work (P < 0.001 and P < 0.004, respectively). Subjects with GERD as a whole also showed reduced work capacity compared with controls (P < 0.04). However, when subjects with GERD with normal motility (n = 11) were compared with controls, no significant differences between work capacity could be inferred (P < 0.2). In addition to this, no difference in work capacity was found between controls, type III, and EoE groups (P < 0.36). At higher bag volumes, some patients with achalasia subtypes I and II generated greater pressurization. These individuals are depicted as outliers in Fig. 7 that summarizes the work capacity calculated for each group. Numerical values observed for active work and work capacity have been summarized in Table 2.
Figure 7.

Peristaltic pumping pressurization work, i.e., the work capacity computed for secondary peristaltic contractions occurring at high bag volumes. Units of the quantity shown on the y-axis are millijoules of energy. Outliers are marked with red plus (+) signs.
Table 2.
Summary of work values computed per group
| Active Work, mJ | Work Capacity, mJ | |
|---|---|---|
| Controls | 7.26 (3.6–9.2) | 268.5 (225.2–332.3) |
| Type I | 0.45 (0.15–1.38) | 60.2 (42.4–82.1) |
| Type II | 0.9 (0.13–1.68) | 87.8 (38.7–158.3) |
| Type III | 1.31 (0.67–1.6) | 293.1 (158.9–401.3) |
| GERD | 2.6 (0.99–3.6) | 209.6 (140.3–247.4) |
| EoE | 1.35 (0.7–7.65) | 340.5 (254.4–385.1) |
| SSc | 0.55 (0.3–0.7) | 96.1 (41.4–109.9) |
The median is given along with the interquartile ranges for each group of subjects. EoE, eosinophilic esophagitis; GERD, gastroesophageal reflux disease; SSc, systemic sclerosis.
DISCUSSION
This study applied measures of esophageal contractile work in response to esophageal distension (active work and work capacity) and demonstrated differences between asymptomatic controls and clinical cohorts with achalasia, GERD, EoE, and SSc. In doing so, lower amounts of work were observed among esophageal disorders characterized by impaired peristaltic function: achalasia and SSc. Among clinical conditions with more heterogeneous peristaltic function such as GERD and EoE and to some degree, type III achalasia, we observed a broader range of work parameters.
The esophagus can be thought of as a peristaltic pump that transports fluid or semisolid content along its length. The performance of a pump is often expressed in specifications that include horsepower and/or volumetric flow rate. Given that the FLIP assembly does not allow for emptying or a net flow rate, we turn to “work done” to report the performance of the esophagus in its capacity as a fluid pump. As the distension protocol covers a wide range of operating bag volumes, we propose two work metrics, at moderate and high bag volumes, respectively, that account for the device's response for the entire range of operation. It must be noted that at low bag volumes, the FLIP does not always elicit a contractile response. Thus, we cannot compute any meaningful measures of work done for this range of operation if there is no contraction.
The first work metric, i.e., active work done (or equivalently, viscous losses incurred over the duration of a single contraction) is plotted in Fig. 6. As expected, because of their complete lumen-occluding contractions, the control group exhibited the greatest amount of work done compared with the other groups. The GERD group displayed less work done compared with controls, as 30% of the group displayed irregular motility, with extremely low values for viscous work. When GERD subjects with normal secondary peristaltic contractions were compared with controls, the difference between the two groups was still significant as well but to a lesser degree. No significant difference was found between controls and the EoE group. As mentioned earlier, 50% of subjects with EoE showed regular motility and greater work done due to the generation of significant pressures within the bag. As such, the active work metric alone is not sufficient to distinguish between controls and patients with EoE.
The variation of work capacity across groups is shown in Fig. 7. Here, we observe that compared with controls, there are no significant differences between achalasia subtype III and the EoE groups, indicating that the maximum pressurization is comparable among these three groups implying a similar level of circular muscle contractility. The GERD group exhibited less work capacity compared with controls, and individuals with achalasia type I and II exhibited less work capacity compared with GERD. However, 20% of each of these patients had substantial pressurization observed at higher bag volumes, suggesting that the esophagus tended to contract with greater degrees of distension.
Based on the trends observed among the three achalasia subtypes and their medians, type III seems to have the greatest work capacity (293 mJ) followed by type II (87.8 mJ) and type I (60.2 mJ). This suggests that type III is relatively similar to the control group (274.5 mJ), and type I has the greatest loss of contractile function, with type II being intermediate. The EoE group exhibited a trend toward greater work capacity (310 mJ), possibly attributable to the fibrosis-induced stiffness of the esophageal wall causing greater degree of pressurization during peristalsis.
It is instructive to use earlier studies that measured esophageal traction force to compute what the work done might be if the force was applied over the length of the esophagus. Pouderoux et al. (22) conducted experiments to quantify propulsive force in healthy controls reporting that the traction force ranged from 11.1 to 110 g (equivalently, 0.11 N to 1.08 N). If one were to apply this force over the length of 12 cm (the average length of the smooth muscle segment of the esophagus), the estimated work done ranges from 13.2 mJ to 129.6 mJ. On the lesser end, the estimated active work values computed for controls agrees with these estimates and on the greater end, their order of magnitude matches well with the values we compute using our work capacity metric. As such, it is encouraging to see this level of agreement because it indicates that the propulsive force generated by the esophagus is capable of doing similar amount of work as secondary peristaltic contractions predicted by our approach using the FLIP.
It should be noted that our approach for calculating the active work done has some inherent limitations. Flow through the contraction depends on the catheter diameter and the folding of the bag as it comes in contact with the catheter. The computation simplifies this complex geometry as a circular cross section potentially leading to an underestimation of viscous losses. Additionally, the smallest measurable lumen diameter is larger than the catheter diameter, adding further uncertainty to the flow geometry on full contact. However, given that the magnitudes of observed and predicted pressure drops were comparable, the overall magnitude of error is assumed to be small. Another limitation of our approach is the inability to account for hysteresis within the esophageal wall as it stretches and returns to its base state. However, accounting for this mode of energy loss requires knowledge of the viscoelastic material properties of the esophagus, which is beyond the scope of this study.
Gregersen et al. (23–25) estimated the work output of the esophagus by measuring the variation of pressure and area at specific locations along its length during muscle contraction cycles. These contractions were generated due to distension of the esophagus. The information from each cycle was used to generate a pressure-CSA loop, the area of which was reported as the work output. They reported that patients with SSc had a stiffer wall compared with controls. Similarly, they found that the work done by patients with SSc was less than controls due to the inability of the musculature to generate comparable force. Based on their methodology, the greatest observed work output in controls was ∼25 mJ. Although this value is comparable with our maximum reported values for active work done in controls (18 mJ), it is important to note that the two numbers represent different phenomena for work expenditure. The area of the loop as measured by Gregersen is equivalent to the energy lost within the esophageal wall due to hysteresis (24, 26) because the esophagus behaves differently as it stretches compared with when it relaxes and returns to its base state (27). This is different than energy spent moving a fluid bolus. The energy loss reported in our work is a consequence of fluid flow generated by secondary peristalsis within the FLIP bag, which was also much longer than the bag used by Gregersen et al. (16 cm vs. 4 cm). As such the value of active work reflects the viscous resistance overcome to achieve bolus flow. The availability of both of these values greatly improves the estimate for the total amount of energy expended by the esophagus during a contraction. Now, estimates are available for both modes of energy loss, i.e., energy needed to overcome viscous resistance to flow and energy lost due to hysteresis in the viscoelastic walls of the esophagus.
In conclusion, we present an alternative approach to quantify the efficacy of esophageal secondary peristalsis based on the concept of mechanical work. Changes in lumenal CSA and pressure were treated as displacement and force, respectively, to compute energy spent during secondary peristalsis. The approach to calculate work for each contraction is explained, and the dynamics of the combined esophagus-FLIP system was explored by studying the variation of work during a typical contraction. A detailed breakdown of the energy spent by a single peristaltic contraction was also presented. The amount of work done was calculated for groups of controls and patients, and on average, the control subjects showed a greater amount of work done. In addition to providing insight into the mechanical profile of the esophagus, the computation of work can also be used to quantify the effectiveness of peristalsis in subjects with abnormal motility.
GRANTS
This work was supported by National Institute of Diabetes and Digestive and Kidney Diseases Grants R01-DK079902 and P01-DK117824 (to J. E. Pandolfino) and by the National Science Foundation Grants OAC 1450374 and OAC 1931372 (to N. A. Patankar).
DISCLOSURES
D. A. Carlson, P. J. Kahrilas, and J. E. Pandolfino hold shared intellectual property rights and ownership surrounding functional lumen imaging probe panometry systems, methods, and apparatus with Medtronic Inc. D. A. Carlson: Medtronic (Speaking, Consulting). W. Kou: Crospon, Inc. (Consulting). P. J. Kahrilas: Ironwood (Consulting). J. E. Pandolfino: Crospon, Inc (stock options), Given Imaging (Consultant, Grant, Speaking), Sandhill Scientific (Consulting, Speaking), Takeda (Speaking), Astra Zeneca (Speaking), Medtronic (Speaking, Consulting), Torax (Speaking, Consulting), Ironwood (Consulting), Impleo (Grant). S. Acharya, S. Halder, N. A. Patankar: None.
AUTHOR CONTRIBUTIONS
S.A., D.A.C., P.J.K., J.E.P., and N.A.P. conceived and designed research; D.A.C. performed experiments; S.A., S.H., D.A.C., and W.K. analyzed data; S.A., D.A.C., P.J.K., J.E.P., and N.A.P. interpreted results of experiments; S.A. and D.A.C. prepared figures; S.A. drafted manuscript; S.A., D.A.C., P.J.K., J.E.P., and N.A.P. edited and revised manuscript; S.A., S.H., D.A.C., W.K., P.J.K., J.E.P., and N.A.P. approved final version of manuscript.
REFERENCES
- 1.Goyal RK, Chaudhury A. Physiology of normal esophageal motility. J Clin Gastroenterol 42: 610–619, 2008. doi: 10.1097/MCG.0b013e31816b444d. [DOI] [PMC free article] [PubMed] [Google Scholar]
- 2.Ebert EC. Esophageal disease in scleroderma. J Clin Gastroenterol 40: 769–775, 2006. doi: 10.1097/01.mcg.0000225549.19127.90. [DOI] [PubMed] [Google Scholar]
- 3.Kahrilas PJ, Boeckxstaens G. The spectrum of achalasia: lessons from studies of pathophysiology and high-resolution manometry. Gastroenterology 145: 954–965, 2013. doi: 10.1053/j.gastro.2013.08.038. [DOI] [PMC free article] [PubMed] [Google Scholar]
- 4.Kahrilas PJ, Bredenoord AJ, Fox M, Gyawali CP, Roman S, Smout AJ, Pandolfino JE; International High Resolution Manometry Working Group. The Chicago Classification of esophageal motility disorders, v. 3.0. Neurogastroenterol Motil 27: 160–174, 2015. doi: 10.1111/nmo.12477. [DOI] [PMC free article] [PubMed] [Google Scholar]
- 5.Brasseur JG, Dodds WJ. Interpretation of intraluminal manometric measurements in terms of swallowing mechanics. Dysphagia 6: 100–119, 1991. doi: 10.1007/BF02493487. [DOI] [PubMed] [Google Scholar]
- 6.Kim TH, Patel N, Ledgerwood-Lee M, Mittal RK. Esophageal contractions in type 3 achalasia esophagus: simultaneous or peristaltic? Am J Physiol Gastrointest Liver Physiol 310: G689–G695, 2016. doi: 10.1152/ajpgi.00459.2015. [DOI] [PMC free article] [PubMed] [Google Scholar]
- 7.Mittal RK, Padda B, Bhalla V, Bhargava V, Liu J. Synchrony between circular and longitudinal muscle contractions during peristalsis in normal subjects. Am J Physiol Gastrointest Liver Physiol 290: G431–G438, 2006. doi: 10.1152/ajpgi.00237.2005. [DOI] [PubMed] [Google Scholar]
- 8.Katz PO, Richter JE, Cowan R, Castell DO. Apparent complete lower esophageal sphincter relaxation in achalasia. Gastroenterology 90: 978–983, 1986. doi: 10.1016/0016-5085(86)90876-0. [DOI] [PubMed] [Google Scholar]
- 9.Carlson DA, Lin Z, Rogers MC, Lin CY, Kahrilas PJ, Pandolfino JE. Utilizing functional lumen imaging probe topography to evaluate esophageal contractility during volumetric distention: a pilot study. Neurogastroenterol Motil 27: 981–989, 2015. doi: 10.1111/nmo.12572. [DOI] [PMC free article] [PubMed] [Google Scholar]
- 10.Schoeman MN, Holloway RH. Secondary oesophageal peristalsis in patients with non-obstructive dysphagia. Gut 35: 1523–1528, 1994. doi: 10.1136/gut.35.11.1523. [DOI] [PMC free article] [PubMed] [Google Scholar]
- 11.Schoeman MN, Holloway RH. Integrity and characteristics of secondary oesophageal peristalsis in patients with gastro-oesophageal reflux disease. Gut 36: 499–504, 1995. doi: 10.1136/gut.36.4.499. [DOI] [PMC free article] [PubMed] [Google Scholar]
- 12.Lin Z, Kahrilas PJ, Xiao Y, Nicodème F, Gonsalves N, Hirano I, Pandolfino JE. Functional luminal imaging probe topography: an improved method for characterizing esophageal distensibility in eosinophilic esophagitis. Therap Adv Gastroenterol 6: 97–107, 2013. doi: 10.1177/1756283X12470017. [DOI] [PMC free article] [PubMed] [Google Scholar]
- 13.Carlson DA, Kahrilas PJ, Lin Z, Hirano I, Gonsalves N, Listernick Z, Ritter K, Tye M, Ponds FA, Wong I, Pandolfino JE. Evaluation of esophageal motility utilizing the functional lumen imaging probe. Am J Gastroenterol 111: 1726–1735, 2016. doi: 10.1038/ajg.2016.454. [DOI] [PMC free article] [PubMed] [Google Scholar]
- 14.Carlson DA, Kou W, Lin Z, Hinchcliff M, Thakrar A, Falmagne S, Prescott J, Dorian E, Kahrilas PJ, Pandolfino JE. Normal values of esophageal distensibility and distension-induced contractility measured by functional luminal imaging probe panometry. Clin Gastroenterol Hepatol 17: 674–681.e1, 2019. doi: 10.1016/j.cgh.2018.07.042. [DOI] [PMC free article] [PubMed] [Google Scholar]
- 15.Kraichely RE, Arora AS, Murray JA. Opiate-induced oesophageal dysmotility. Aliment Pharmacol Ther 31: 601–606, 2010. doi: 10.1111/j.1365-2036.2009.04212.x. [DOI] [PMC free article] [PubMed] [Google Scholar]
- 16.Mittal RK, Frank EB, Lange RC, McCallum RW. Effects of morphine and naloxone on esophageal motility and gastric emptying in man. Digest Dis Sci 31: 936–942, 1986. doi: 10.1007/BF01303214. [DOI] [PubMed] [Google Scholar]
- 17.Carlson DA, Kou W, Pandolfino JE. The rhythm and rate of distension‐induced esophageal contractility: a physiomarker of esophageal function. Neurogastroenterol Motil 32: e13794, 2020. doi: 10.1111/nmo.13794. [DOI] [PMC free article] [PubMed] [Google Scholar]
- 18.Acharya S, Kou W, Halder S, Carlson DA, Kahrilas PJ, Pandolfino JE, Patankar NA. Pumping patterns and work done during peristalsis in finite-length elastic tubes. 2021. http://arxiv.org/abs/1911.09286. [DOI] [PMC free article] [PubMed]
- 19.Halder S, Acharya S, Kou W, Kahrilas PJ, Pandolfino JE, Patankar NA. Mechanics informed fluoroscopy of esophageal transport. Biomech Model Mechanobiol (2021). doi: 10.1007/s10237-021-01420-0. [DOI] [PMC free article] [PubMed]
- 20.Lin Z, Nicodème F, Boris L, Lin C-Y, Kahrilas PJ, Pandolfino JE. Regional variation in distal esophagus distensibility assessed using the functional luminal imaging probe (FLIP). Neurogastroenterol Motil 25: e765–e771, 2013. doi: 10.1111/nmo.12205. [DOI] [PMC free article] [PubMed] [Google Scholar]
- 21.Lecamwasam HS, Sullivan MP, Cravalho EG, Yalla SV. Detrusor internal and external work in relation to passive urethral resistance in a canine model of the lower urinary tract. Neurourol Urodyn 15: 529–544, 1996. doi:. [DOI] [PubMed] [Google Scholar]
- 22.Pouderoux P, Lin S, Kahrilas P. Timing, propagation, coordination, and effect of esophageal shortening during peristalsis. Gastroenterology 112: 1147–1154, 1997. doi: 10.1016/S0016-5085(97)70125-2. [DOI] [PubMed] [Google Scholar]
- 23.Gregersen H, Villadsen GE, Liao D. Mechanical characteristics of distension-evoked peristaltic contractions in the esophagus of systemic sclerosis patients. Dig Dis Sci 56: 3559–3568, 2011. doi: 10.1007/s10620-011-1777-9. [DOI] [PubMed] [Google Scholar]
- 24.Liao D, Krarup AL, Lundager FH, Drewes AM, Gregersen H. Quantitative differences between primary and secondary peristaltic contractions of the esophagus. Dig Dis Sci 59: 1810–1816, 2014. doi: 10.1007/s10620-014-3070-1. [DOI] [PubMed] [Google Scholar]
- 25.Liao D, Villadsen GE, Gregersen H. Distension-evoked motility analysis in human esophagus. Neurogastroenterol Motil 25: 407–e297, 2013. doi: 10.1111/nmo.12081. [DOI] [PubMed] [Google Scholar]
- 26.Collinsworth AM, Zhang S, Kraus WE, Truskey GA. Apparent elastic modulus and hysteresis of skeletal muscle cells throughout differentiation. Am J Physiol Cell Physiol 283: C1219–C1227, 2002. doi: 10.1152/ajpcell.00502.2001. [DOI] [PubMed] [Google Scholar]
- 27.Gregersen H, Kassab G. Biomechanics of the gastrointestinal tract. Neurogastroenterol Motil 8: 277–297, 1996. doi: 10.1111/j.1365-2982.1996.tb00267.x. [DOI] [PubMed] [Google Scholar]