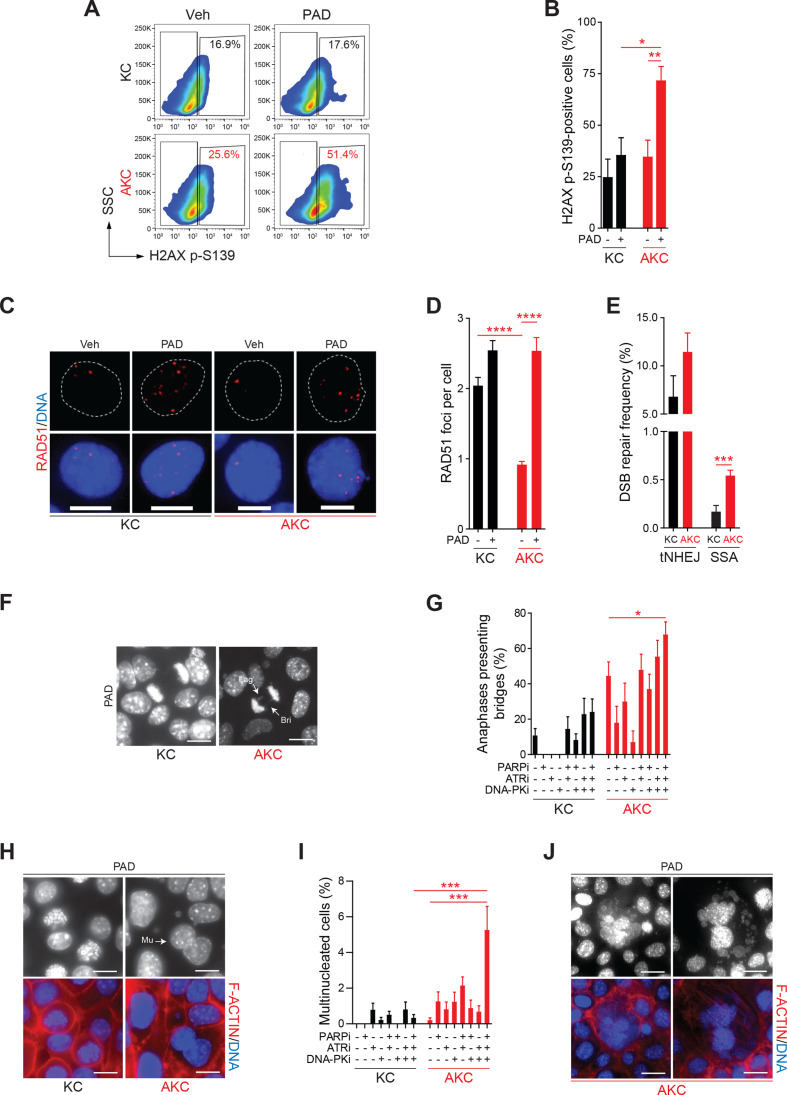
Figure 3.
HR-deficient ATM-deleted PDAC cells accumulate DNA damage and mitosis defects on PAD treatment. (A) Representative flow cytometry analysis of H2AX p-S139-positive Atm+/+; LSL-KrasG12D/+; Ptf1aCre/+ (KC) and Atmfl/fl; LSL-KrasG12D/+; Ptf1aCre/+ (AKC) cells treated or not with olaparib (PARPi, 1 µM), VE-822 (ATRi, 20 nM) and CC-115 (DNA-PKi, 30 nM) in combination for 48 hours (PAD, PARPi/ATRi/DNA-PKi), and (B) graphic representation showing results of flow cytometry analyses of H2AX p-S139-positive KC and AKC cells treated or not as in (A). (C) Immunofluorescence staining for RAD51 (red) and (D) quantification of RAD51 foci in KC and AKC cells treated or not with olaparib, VE-822 and, CC-115 in combination (PAD) for 48 hours (as in A). Cells were counterstained with DAPI (blue). Scale bars represent 10 µm.(E) Analysis of double-strand break (DSB) repair pathway usage in KC and AKC cells transfected with DSB repair substrates for total non-homologous end joining (tNHEJ) or single-strand annealing (SSA) plus with ISceI-endonuclease expression plasmid for cleavage of the substrates followed by cultivation for 24 hours, and treated as in (A). DSB repair frequencies are shown as percentage of transfected and living cells. (F) Direct fluorescence staining of DNA by DAPI (white) and quantification of (G) anaphase bridges in KC and AKC cells treated or not with olaparib, VE-822 and CC-115 as single agents or in combination for 48 hours (as in A). White arrows show laggards (Lag) and anaphase bridges (Bri) (F). Scale bars represent 10 µm. (H) Direct fluorescence staining of DNA by DAPI (white on upper panels and blue on lower panels) and of cortical actin by phalloidin-Atto565 (red on lower panels) and (I) quantification of multinucleated cells in KC and AKC cells treated or not with olaparib, VE-822 and CC-115 as single agents or in combination for 48 hours (as in A). White arrows show multinucleated cells (Mu). Scale bars represent 10 µm. (J) Direct fluorescence staining of DNA by DAPI (white on upper panels and blue on lower panels) and of cortical actin by phalloidin-Atto565 (red on lower panels) in KC and AKC cells treated or not with olaparib, VE-822 and CC-115 as single agents or in combination for 48 hours (as in A) showing typical mitotic catastrophe event. Scale bars represent 10 µm. SSC, sidewards scatter. *, p<0.05; **, p<0.01; ***, p<0.001; ****, p<0.0001.

