

Abstract

A Schiff base, namely, 4-[(2-hydroxy-3-methoxybenzylidene) amino] benzoic acid (L1), has been synthesized by the condensation reaction. It has been characterized by Fourier transform infrared spectroscopy , UV–vis spectroscopy, single-crystal X-ray diffraction, and DFT/B3LYP calculations. Single-crystal X-ray crystallographic analysis revealed that L1 exists in the zwitterionic (N–H···...O) form. The supramolecular interactions were investigated by Hirshfeld surface analysis. In addition, third-order nonlinear optical (NLO) properties of L1 were also investigated. The nonlinear refractive index (n2), nonlinear absorption coefficient (β), and the third-order NLO susceptibility (χ(3)) have been estimated at different concentrations and at different laser powers using close and openaperture Z-scan data. The values of the parameters were found to be varying almost linearly with concentration and power. The present study revealed the utility of the material for various optoelectronic devices such as optical switches, optical data storage devices, and optical sensors. The optical limiting study reveals that this material can also be exploited as an instrument protector from unwanted laser illumination. Furthermore, the NLO behavior of L1 has also been studied by B3LYP/6-311++G(d,p) results.
1. Introduction
Over the last few years, the organic materials for third-order nonlinear optical (NLO) response have occupied a pivotal place due to their potential uses in the fabrication of photonic devices such as self-focusing, high-speed information processing, power limiters, optical switches, and optical data storage.1−4 Several organic, inorganic, and semiorganic materials having NLO properties have been successfully designed and developed.5−8 The NLO crystals having a low dielectric constant and high optical band gap are in great demand for spectroscopy, imaging, storage devices, optical communication systems, and so forth.9,10 Over the wide range of organic crystals, particularly, molecules based on the Schiff base hold special interest toward the development of photonic and optoelectronic devices. This is due to the presence of π-conjugated bonds and the azomethine bridge of the −C=N– bond that boost the nonlinearity response.11−14
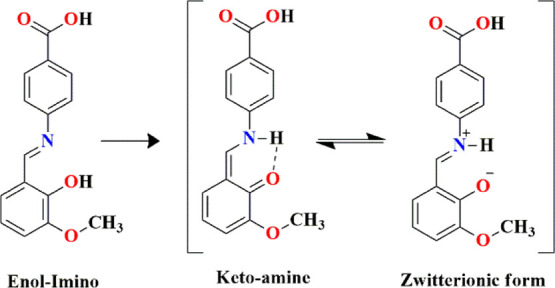
In general, o-hydroxy Schiff bases exist in the enol–imine (OH) and the keto–amine (NH) tautomeric forms with two possible types of intramolecular H-bonding interactions: O–H···N in enol–imine and N–H···O in keto–amine tautomers.15 However, an additional form of intramolecular H-bonding is also observed as N+–H···O–, which is called the zwitterionic form.16 Based on literature survey, it is known to us that various organic single crystals such as chalcone derivative,17 potassium dichromate,18,19 and Schiff base molecules20 are reported for third-order NLO response. The above mentioned characteristics of materials excited us to design a simple and new Schiff base molecule (Scheme 1), which could exhibit enhanced third-order NLO response. It is also noteworthy that there is no report available on the present molecule for a NLO study. We also explored the experimental measured values of the nonlinear refractive index (n2), nonlinear absorption coefficient (β), and third-order optical susceptibility, χ(3), using the Z-scan technique with a CW diode laser. Moreover, experimental results obtained were also theoretically corroborated. The density functional theory (DFT) plays an important role in describing the NLO potential of the molecules. The high value of the first- and second-order hyperpolarizabilities reveals high NLO potential because of intramolecular charge transfer (ICT) mediated through the π-conjugated framework. Therefore, the NLO parameters (static and dynamic) have been computed in the solution phase to study the NLO behavior of L1.
Scheme 1. Existence of Tautomeric Equilibrium of L1.
2. Results and Discussion
2.1. UV–Vis Spectroscopic Study of the Schiff Base Molecule
Electronic absorption spectrum of L1 shows a broad band at 310 nm, which indicates the involvement of π → π* transitions (Figure 1).21 It may have appeared due to the presence of aromatic rings and the (−C=N-) bond in L1. There is another broad and unresolved absorption band at 470 nm that corresponds to n → π* transitions. The concentration-dependent spectra have also been recorded, which show the stability of L1. A slight red shift of absorption bands could be attributed to the proton transfer occurring in L1 (Figure S1).22
Figure 1.

UV–vis spectrum of L1 in ethanol under dilute conditions.
2.2. Crystal Structure Description
L1 crystallizes in the orthorhombic system (P212121), and its asymmetric unit contains a Schiff base unit in the zwitterionic form and a methanol in the lattice. Interestingly, the hydroxyl group of methoxybenzaldehyde is deprotonated to the imine group, forming an intramolecular (imine) N–H···O (methoxybenzaldehyde) H-bonding network with graph-set notation S(6). Moreover, herringbone fashion of packing is seen along the b-axis, and the most obvious H-bonding chain pattern involved in crystal packing is formed by methanol, connecting each Schiff base. The chain extends along the c-axis and is designated by the graph set C22(16). On the other hand, lattice methanol also interacts with the deprotonated hydroxyl group of L1, forming a ring pattern of R12(5) with the O–H···O bond. Furthermore, each Schiff base unit is connected to the adjacent unit via C–H···O and C–H···π interactions, and the ring patterns involved are shown in Figure 1c. Ring patterns and chains involving intricate arrays of noncovalent interactions result in 3D supramolecular architecture (Figure 2a–c).
Figure 2.

Representation of (a) crystal packing view along the b-axis, (b) cross section of the 1D chain pattern C22(16) view along the crystallographic b-axis, and (c) graph-set ring patterns created by methanol and L1 via H-bonded chain view along the crystallographic a-axis.
Furthermore, we employed the graph-theory approach23 to understand the role of all intermolecular contacts in molecular packing. Therefore, in L1, both the Schiff base and methanol molecules can be considered as a building unit of the crystal. However, simplification shows each Schiff base molecule touches 12 other Schiff base molecules and 6 methanol molecules, while each methanol molecule touches 8 other Schiff base molecules and only 2 methanol molecules, resulting in the 3D framework structure (Figure 3).
Figure 3.

Packing diagram of L1. Brown and light-blue spheres correspond to the Schiff base and methanol molecular centroids, respectively.
2.3. Hirshfeld Surface Analysis
Hirshfeld surface analysis gives both qualitative and quantitative molecular interactions.24−28 The Hirshfeld surface of L1 is mapped over dnorm, curvedness, and shape index. The Hirshfeld surface mapped over a dnorm(normalize contact distance) in the range of −0.751 to 1.207 is shown in Figure S2. The deep-red spots indicate classical hydrogen bonding and other short contacts of the neighboring molecule. Hirshfeld surface analysis mapped over curvedness in the color range of −4.0 to 0.40. The curvedness plot of L1 shows the flat green surface on the front and back side of the molecule, which evidences the presence of π-interactions. At the edges, blue color shows the positive curvedness on the surface of L1 (Figure S3).
Furthermore, Hirshfeld surface analysis of L1 is mapped over the shape index in the color range −1.0 to 1.0. The shape index quantifies the shape of the molecule in terms of principal curvatures κ1and κ2. The shape index clearly shows the triangular red and blue regions, which are characteristics of π···π and C–H···π interactions (Figure S4).
The two-dimensional fingerprint plots are given in Figure 4a–g; it is evident from the Hirshfeld surface analysis that hydrogen–hydrogen contacts predominate, contributing 42.3% of overall interactions (Figure 4b). Interestingly, O–H/H–O interactions contributing 31.1% attribute to O–H···O and C–H···O contact that appeared as two sharp symmetrical spikes in Figure 4c of the fingerprint plot. It is followed by C–H/H–C interactions with 15.2% corresponding to C–H···π contacts showing two broad symmetrical wings (Figure 4d). Moreover, C–C interactions with 7.1% correspond to the π···π interactions that appeared in the middle of the fingerprint plot (Figure 4e). Other minor interactions contributing 4.1% of the total Hirshfeld surface interactions correspond to C–N/N–C (2.2%), C–O/O–C (1.7%), and so forth (Figure 4f–g).
Figure 4.

Two-dimensional fingerprint plots for L1. dnorm surfaces for each plot, indicating the specific patches corresponding to the percentage of specific contacts, which are shown on the right side- (a) all interactions, (b) H···H, (c) O–H/H–O, (d) C–H/H–C, (e) C···C, (f) C–N/N–C, and (g) C–O/O–C.
2.4. Third-Order Nonlinear Optical Measurements
The nonlinear refraction and absorption of L1 have been estimated by recording the closed aperture (CA) and open aperture (OA) Z-scan data, keeping laser power fixed at 42 mW for different concentrations (2.5–10 mM) as well as for various laser power (30–50 mW) at a fixed concentration of 7.5 mM. The intensity-dependent nonlinear refraction and absorption are related to the following equations.29,30
| 1 |
| 2 |
where α is the linear absorption coefficient, n0 is the linear refractive index, and βeff and n2 are the nonlinear absorption coefficient and refractive index respectively. I is the intensity of the input laser beam.
The nonlinear refractive index (n2) is related to the following relation
| 3 |
where |ΔΦ0| is the on-axis phase shift and it is expressed as
| 4 |
The quantity ΔTP-V is measurable and is defined as the difference in the peak valley-normalized transmittance,31,32 and k = 2π/λ is the wave number with laser wavelength (λ); Leff = 1 – exp(−αL)/α defines the effective thickness of the sample, α is linear absorption coefficient, L is the actual thickness of the sample, and S is the linear aperture transmittance. I0 is the on-axis irradiance at the focus with I0 = 2P/πω02.
We can obtain the nonlinear refractive index (n2) by fitting the normalized transmittance curve with the following equation.31
| 5 |
where ρ = ΔΨ/ΔΦ0; ΔΦ0 and ΔΨ are the phase shift due to nonlinear refraction and nonlinear absorption, respectively, and ΔΨ = βI0Leff/2 and x = Z/ZR are related to the diffraction length of the beam (ZR) and position of the sample (Z). The third-order NLO susceptibility of the materials is described as
| 6 |
Real (χR(3)) and imaginary parts (χI) of third-order susceptibility (χ(3)) are related to the nonlinear refraction (n2) and nonlinear absorption (β), respectively, which are expressed as
| 7 |
| 8 |
where ε0 is the permittivity of free space, c is the speed of light in vacuum, and n0 is linear refractive index of the sample. The absolute value of third-order susceptibility is calculated as
| 9 |
Figures 5a,b and 6a,b show, respectively, the closed aperture (CA) and open aperture (OA) normalized transmittance with the sample position for different concentrations and different powers at 520 nm. The dots represent experimental Z-scan data, whereas the solid lines represent the least square fitting (theoretical fitting). The CA normalized transmittance of L1 shows a peak-valley configuration and is induced due to the self-defocusing nature of the sample, which is an indication of the negative nonlinear refractive index (n2 < 0).33 This self-defocusing characteristic may be the effect of thermal nonlinearity of the sample which occurs due to the heat released, resulting from the absorption of laser radiation, and consequently, the temperature-dependent refractive index is produced in the sample and it behaves like a thermal lens. However, the OA normalized transmittance reveals the symmetric peak near the focus, suggesting the saturable absorption (SA) nature of the sample,32 which is the signature of negative nonlinear absorption, (β < 0), in the crystal. It is also observed in Figure 6a,b that there is a slight dip on either side of the peak, indicating the involvement of reverse saturable absorption (RSA), but saturable absorption (SA) dominates, and earlier, it was also reported by several researchers.34,35 These SA and RSA behaviors can be explained by the five energy level model of the molecules,36 where SA and RSA may be attributed to the two photon absorption (TPA) and the excited-state absorption (ESA), respectively. Hence, the nonlinear absorption of L1 confirms the multiphoton absorption with ESA and TPA. The calculated NLO parameters (n2, β, and χ(3)) are given in Tables 1 and 2 for different concentrations and different powers, respectively. The values of these parameters for L1 are found to be comparable with those of the earlier reported Schiff base molecules,20,37,38 as listed in Table 3. The comparative analysis evidences the good NLO performance of L1 over other reported molecules.
Figure 5.

Close aperture Z-scan-normalized transmittance curves of L1 at a fixed (a) laser power of 42 mW and (b) concentration of 7.5 mM.
Figure 6.

Open aperture Z-scan-normalized transmittance curves of L1 at a fixed (a) laser power of 42 mW and (b) concentration of 7.5 mM.
Table 1. Concentration Dependent Third-Order NLO Parameters of L1 at a Laser Power of 42 mW.
| concentration [mM] | n2 × 10–8 [cm2/W] | β × 10–4 [cm/W] | χ(3) × 10–6 [esu] |
|---|---|---|---|
| 2.5 | –6.68 | –3.60 | 3.13 |
| 5.0 | –18.90 | –9.59 | 8.85 |
| 7.5 | –27.51 | –12.90 | 12.89 |
| 10.0 | –47.02 | –23.70 | 22.03 |
Table 2. Power Dependent Third-Order NLO Parameters of L1 at a Fixed Concentration of 7.5 mM.
| laser power [mW] | n2 × 10–8 [cm2/W] | β × 10–4 [cm/W] | χ(3) ×10–6 [esu] |
|---|---|---|---|
| 30 | –9.56 | –3.77 | 4.48 |
| 35 | –18.08 | –6.97 | 8.47 |
| 40 | –22.96 | –9.45 | 10.75 |
| 45 | –26.66 | –10.70 | 12.49 |
| 50 | –31.30 | –11.60 | 14.66 |
Table 3. Comparison of NLO Parameters of L1 with Other Reported Molecules.
| Schiff base molecules | n2 [cm2/W] | β [cm/W] | χ(3) [esu] | references |
|---|---|---|---|---|
| L1 | –4.70 × 10⁻⁷ | –2.37 × 10⁻³ | 2.20 × 10⁻⁵ | this work |
| heterocyclic azomethine compound | –1.91 × 10⁻⁸ | 12.2 × 10⁻⁴ | 12.2 × 10⁻⁴ | (20) |
| hydrazinecarboxamide (BDMHC) | 1.00 × 10⁻⁹ | 3.84 × 10⁻⁵ | 1.24 × 10⁻⁶ | (37) |
| stilbazolium derivative (4MSTB) | 3.96 × 10⁻⁸ | 6.62 × 10⁻² | 9.45 × 10⁻⁴ | (38) |
The variation in n2 and β with concentration and power has been shown in Figure 7a,b. These figures reveal that the absolute values of n2 and β increase linearly with concentration and laser power. This implies that as the concentration increases, the number of molecules increases to participate in laser interaction. Hence, the number of molecules gets thermally agitated, and consequently, the thermal nonlinearity increases. Also, as the laser power increases, the thermal nonlinearity of the sample gets enhanced with laser power.
Figure 7.

Variation of the nonlinear refractive index (n2) and nonlinear absorption coefficient (β) of L1 with (a) concentration and (b) laser power.
The optical limiting behavior of the present crystal represented in Figure 8a shows the variation of transmitted power as a function of input power at various concentrations. This demonstrates that for lower input power up to limiting threshold power, the transmitted power linearly increases, and at higher input power, it becomes saturated. After a further increase in input power, the transmitted power decreases, which is the characteristic nature of the good optical limiter. The optical limiting behavior in the crystal may be produced through several mechanisms such as RSA, multiphoton absorption, ESA, free carrier absorption, nonlinear scattering, photorefraction, and so forth.17 The measured optical limiting parameters of L1 are given in Table 4. The limiting threshold power and the saturated transmitted power decrease with concentration, as shown in Figure 8b. This implies that at higher concentration, the limiting threshold becomes low due to high nonlinear absorption of the sample results for high optical nonlinearity.
Figure 8.

Optical limiting behavior of L1: (a) transmitted power as a function of input power and (b) variation of limiting parameters with concentration.
Table 4. Concentration Dependent Optical Limiting Parameters of L1.
| concentration [mM] | limiting threshold power [mW] | saturated transmitted power [mW] |
|---|---|---|
| 5.0 | 33.6 | 56.9 |
| 7.5 | 30.1 | 44.9 |
| 10 | 27.8 | 40.5 |
2.5. DFT Calculation Results
2.5.1. Optimized Geometry and IR Spectrum
The optimized geometry was obtained with a self-consistent field energy of −586,932.8369 kcal/mol at B3LYP/6-311++G(d,p) level of theory. Some important theoretical geometrical parameters (bond length, bond angle, and dihedral angle) are compared with the X-ray diffraction (XRD) data (Table S1), and the optimized structure is shown in Figure S5. The optimized structural parameters have reproduced the XRD data very well. The dihedral angles reveal that for both rings, their linkage C–NH–C and COOH are in the same plane. Both XRD and optimized geometries have been also compared globally by atom-by-atom superimposition, and the root-mean-square deviation is found to be 0.1946 Å (Figure 9). The discrepancies derived may be due to different phases and limitation of model calculations.
Figure 9.

Superimposition of the XRD and optimized geometries of L1.
The simulated and experimental IR spectra were well corroborated. Some important IR bands have been assigned with great accuracy by visualization of atom displacements, as shown in Figure S7. The wavenumber of bands appearing in the FTIR are found in good agreement with the corresponding theoretically scaled wavenumbers. The frequencies of corresponding vibrations are also in accordance with those reported in the literature.39
2.5.2. Electronic Spectra and Highest Occupied Molecular Orbital–Lowest Unoccupied Molecular Orbital Analysis
The UV–Vis absorption of L1 is analyzed at the TD-B3LYP/6-311++G level of theory. The experimental spectrum shows one band at 310 nm with high absorbance, while another broad peak at 470 nm with very low absorbance. These bands could be attributed to the electronic transitions from π → π* and n → π*, respectively. The electronic spectra simulated in gaseous and solvent phases are found in good agreement with the experimental one (Figure S7). The theoretical UV–Vis bands have shown a red shift from the experimental one. The characteristic UV–Vis bands have been assigned using molecular orbital compositions (in %). The bands appearing in lower- and higher-wavelength regions are assigned to HOMO – 1 → LUMO and HOMO → LUMO transitions, respectively. As per TD-B3LYP/6-311++G(d,p) results, the HOMO → LUMO excitation corresponds to 2.53 eV. Spatial plots of HOMO – 1, HOMO, LUMO, and LUMO + 1 along with energy eigen values and highest occupied molecular orbital (HOMO)–lowest unoccupied molecular orbital (LUMO) energy gap related to L1 are illustrated in Figure 10. The HOMO–LUMO energy gap is found to be 2.88 eV. The molecule with a less HOMO–LUMO energy gap can be considered as a soft molecule with low stability and high chemical reactivity.40 The HOMO–LUMO energies explain that the charge transfer occurs within the molecule. The energy eigenvalues of these orbitals are generally used to define various reactivity descriptors such as ionization, electron affinity, hardness, softness, chemical potential, and so on. The capability of molecules to undergo charge transfer from donor to acceptor moieties within the molecule, through π-bonds, is an important feature of NLO structural–function relationships.41 The spatial plots for the distribution of the HOMO and LUMO are used to describe the exchange of charges, as illustrated in Figure 10. HOMOs are localized predominantly over N–H and one of the rings, while LUMO is arranged over the whole region of molecule, except H atoms and the CH3 group, which represents the charge transfer from one moiety to another.
Figure 10.

Molecular orbital plots for L1.
2.5.3. Natural Bond Orbital Analysis
Natural bond orbital (NBO) analysis is carried out to depict the charge transfer between the donor–acceptor pairs within the molecule. Stability of L1 arising from hyperconjugative interaction and charge delocalization has been analyzed. The hyperconjugative interaction (stabilization energy), E(2), between some important donor and acceptor NBOs and their occupancies are tabulated in Table S2. The interaction energy E(2) between donor–acceptor NBOs is calculated using second-order perturbation theory analysis of Fock matrix in NBO basis. The larger value E(2) reflects the more intensive electron donor–acceptor NBO interaction. The electron delocalization can be defined as a charge transfer from a donor NBO, with a decrease of its occupancy, to an acceptor NBO.42 As shown in Table S2, the occupancy in acceptor NBOs clearly demonstrates strong charge delocalization, leading to high stabilization energy. The low value of E(2), 0.89 kcal/mol, predicted for LP (1) O3 → σ* N1–H1 defines weak interaction, N–H···O. The π → π* and LP (lone pair) → π* interactions are found with higher stabilization energy values. In Table S2, most of the hyperconjugative interactions are formed by the overlapping of π(C–C) with π*(C–C) NBOs, which results in ICT, causing stabilization of L1. The results of charge transfer within the molecule support the high NLO potential of L1. The energy values related to hyperconjugative interactions can be utilized to measure the intramolecular charge delocalization.
2.5.4. NLO Properties
The NLO properties of L1 have been studied by the theoretical calculations at the B3LYP/6-311++G(d,p) level of theory. The high values of hyperpolarizability and strong ICT properties of L1 play a pivotal role in explaining the contribution of the molecular geometry in NLO response.43 The linear polarizability and first and second hyperpolarizabilities are obtained in the presence of static and dynamic electric fields. The results for the average values of these parameters for L1 in vacuum and solution phases are tabulated in Table 5. The average values of the NLO parameters have been computed using the equations reported in the literature.44 The resultant electric dipole moment (μ) of L1 in vacuum and solution (acetone) phases is found to be 4.228 and 6.244 Debye, respectively, showing that the solvent effect causes an increment of 47.68% in the dipole moment. The contribution to the total dipole moment is given by the μz component only. In Table 5, NLO-related parameters have revealed dependency of the wavelength and dielectric constant, that is, solvent effect. In vacuum, the value of isotropic first-order hyperpolarizability (static) of L1 is ca. 90 times greater than the value for urea (βo = 0.3728 × 10⁻³⁰ esu).45 The static isotropic second hyperpolarizability values are 167.9 and 483.5 (×10–36 esu) for L1 in vacuum and solution, respectively. The values of static average second hyperpolarizability are found to be appreciably larger than that of urea (4.16 × 10–36 esu).46
Table 5. B3LYP/6-311++G(d,p) and PCM-B3LYP/6-311++G(d,p) Results for Average Linear Polarizability and First and Second Hyperpolarizabilities (Static and Dynamic).
| parameters | B3LYP/6-311++G(d,p) | PCM-B3LYP/6-311++G(d,p) |
|---|---|---|
| Polarizability, α (×10–22 esu) | ||
| α (static) | ||
| isotropic | 0.374 | 0.499 |
| anisotropy | 0.447 | 0.566 |
| α (−ω; ω), λ = 520.0 nm | ||
| isotropic | 0.714 | 0.827 |
| anisotropy | 1.372 | 1.605 |
| First Dipole Hyperpolarizability, β (×10–30 esu) | ||
| β (static) | 33.839 | 71.946 |
| β (−ω; ω, 0), λ = 520.0 nm | 2731.535 | 4663.182 |
| β (−2ω; ω, ω), λ = 520.0 nm | 1090.953 | 1139.238 |
| Second Dipole Hyperpolarizability, γ (×10–36 esu) | ||
| γ (static) | 167.904 | 483.535 |
| γ (−ω; ω, 0, 0)a, λ = 520.0 nm | 49605.334 | 116815.960 |
| γ (−2ω; ω, ω,0)b, λ = 520.0 nm | –22256.933 | –38784.898 |
| γ (−ω; ω, ω, −ω)c, λ = 520.0 nm | 99042.764 | 233148.386 |
| γ (−3ω; ω, ω, ω)d, λ = 520.0 nm | 296792.486 | 698478.089 |
The linear polarizability and first- and second-order hyperpolarizabilities of L1 were also obtained by incorporating the dynamic effects of an applied electric field (with frequency ω = 0.087 a.u.). The obtained dynamic values revealed enhancement from static values due to the presence of the applied electric field. In the parentheses of notations, α, β, and γ, the first frequency denoted by the negative corresponds to the emitted radiation frequency; the other frequencies (positive) are related to the absorbed radiation,46 as given in Table 5. The isotropic second-order hyperpolarizabilities ⟨γ (−ω; ω, 0, 0)⟩ (Kerr effect), ⟨γ (−2ω; ω, ω, 0)⟩ [dc-second harmonic generation (SHG)], ⟨γ (−ω; ω, ω, −ω)⟩ [related to the nonlinear optical process of the intensity-dependent refractive index (IDRI)], and ⟨γ (−3ω; ω, ω, ω)⟩ [third harmonic generation (THG)] for λ = 520 nm are found to be 1.168, −0.388, 2.331, and 6.985 (×10–31 esu), respectively, in the solvent phase (acetone), while in vacuum, these are 0.496, −0.222, 0.990, and 2.968 (×10–31 esu), respectively. In the solution phase, the first hyperpolarizability ⟨β(−ω; ω, 0)⟩ and ⟨β(−2ω; ω, ω)⟩ increases around 65 and 16 times the static values, respectively, while the second hyperpolarizability ⟨γ (−ω; ω, 0, 0)⟩ and ⟨γ (−2ω; ω, ω, 0)⟩ increases around 241 and 80 times the static values, respectively. The studied theoretical parameters suggest that L1 can be considered to be a potential NLO candidate.
3. Conclusions
The Schiff base molecule is structurally authenticated by spectroscopic, SC-XRD, and computational studies. The experimental results are found to be in reasonable agreement with the theoretical results. It revealed that the molecule is in a zwitterionic form and stabilized via N–H···O bonding. Hirshfeld analysis revealed the crucial intermolecular interactions that support in stabilizing the supramolecular assembly of the crystal. The obtained high values of nonlinear refraction (n2), nonlinear absorption (β), and the third-order NLO susceptibility χ(3) with the variation of concentration as well as laser power substantiate the promising candidature of L1 for NLO applications. Furthermore, NBO analysis confirms the hyperconjugative interactions, and the lowering of HOMO–LUMO energy gap may be due to the charge-transfer interaction, resulting in high NLO potential. Furthermore, the large value of second-order hyperpolarizability and the optical limiting characteristics showed L1 as a potential optical limiter material. Therefore, the present NLO study reveals that L1 can be utilized to cultivate the optoelectronic devices such as optical switches, optical data storage devices, optical sensor, and so on. Additionally, the optical limiting nature of L1 vindicates its utility as an instrument protector from unwanted laser illumination.
4. Experimental Section
4.1. Materials
All the solvents and reagents used for synthesis were commercially available and used without further purification. Reagent grade 4-amino benzoic acid and 2-hydroxy-3-methoxybenzaldehyde were obtained from Sigma-Aldrich and used as received. Methanol was procured from SD Fine Chemicals.
4.2. Synthesis of 4-((2-Hydroxy-3-methoxybenzylidene) amino) Benzoic Acid (L1)
This Schiff base molecule was synthesized according to an earlier reported procedure.47 A hot solution of 4-aminobenzoic acid (7.2 mmol) in 15 mL of methanol was added to 2-hydroxy-3-methoxybenzaldehyde (7.2 mmol). The reaction mixture was heated for around 30 min until the completion of the reaction. Then, it was filtered and repeatedly washed with hot methanol and dried under vacuum (yield ∼78%). It was crystallized by slow evaporation in a methanol. mp 254–255 °C, FTIR (KBr cm–1): 3422 (s) 2917 (s), 2837 (m), 2536 (m), 1691 (s), 1593 (m), 1462 (s), 1421 (s), 1364 (s), 1288 (s), 1252 (s), 1166 (m), 1169 (s), 1099 (m), 1016 (s), 967 (s), 853 (s), 745 (s), 731 (s), 691 (m). UV–vis absorption (λmax, nm): 310 nm. (Figures S1 & S8).
4.3. Physical Measurement
Fourier transform infrared spectrum was recorded on a PerkinElmer Spectrum-2 using a KBr disk, 4000–400 cm–1. The absorption spectrum was measured at room temperature using a Thermo Scientific Evolution 201 UV–visible spectrophotometer containing a 10–4 M solution in ethanol with a cuvette of 1 cm path length.
4.4. NLO Measurements
NLO parameters such as nonlinear refractive index (n2), nonlinear absorption (β), and third-order NLO susceptibility, χ(3), of L1 have been measured using a very simple and highly sensitive Z-scan technique based on spatial beam distortion, which was proposed by Sheikh–Bahae et al.33,48,49 Moreover, this technique is widely used because it provides sign and accurate magnitude of third-order susceptibility.50 Here, a tightly focused Gaussian beam of continuous wave diode laser (Thorlabs) with 120 mW laser power at 520 nm has been employed for the interaction with L1 dissolved in the acetone and poured in the cuvette of 1 mm thickness. The sample cuvette has been fixed on a computer-controlled translation stage, moving at 1 mm/s, so that it can be accurately moved through the focal region of the laser beam. The sample experiences different laser intensities at each Z-position, and the position-dependent transmission is measured using a photomultiplier tube (PMM01-1, Thorlabs). However, the detected signals are acquired, stored, and processed by a D/A converter and computer. The self-focusing (positive n2) or defocusing (negative n2) nature of the beam has been recorded by PMT as the cuvette is translated along the axis of the beam. To record the scans for closed and open aperture, an aperture is kept in the far field in front of the PMT. For the accuracy of the results, the data was recorded three times and averaged for the sample and the solvent in both OA and CA methods. The averaged data of the sample was also divided by solvent data to exclude the optical nonlinearity of the solvent.
4.5. Computational Details
The theoretical calculations have been performed for the ground state of L1 using the hybrid functional (B3LYP) with the 6-311++G(d,p) basis set, as implemented in Gaussian 09 software.51 The coordinates of the input geometry for the theoretical calculations were taken from the crystallographic information file.37 The geometry of L1 was fully optimized without using any symmetry constraints under tight convergence criterion, and subsequently, harmonic IR frequencies were obtained with positive values in vacuum and solution phases. The simulated IR spectrum was plotted with pure Lorentzian band shapes with a full width at half-maximum of 5 cm–1. Vibrational assignments of some important modes were made with great care by visualization of animation of modes using the Gauss View 5 program.52 The frontier molecular orbitals, that is, HOMO and LUMO, their energy Eigen values, and HOMO–LUMO gap were obtained at the same level of theory. The NBO analysis was carried out to study hyperconjugative interactions that play a significant role in stabilizing the molecule. The electronic spectra were studied in both vacuum and solution (ethanol) phases using TD-DFT/B3LYP calculations using the same basis set. The polarizable continuum model (PCM) was incorporated for the calculations in solution phase. The nonlinear optical behavior of L1 was also studied using theoretical NLO parameters (static and dynamic) such as polarizability and hyperpolarizability values (first and second order) in vacuum and solution phases.
Acknowledgments
The Department of Applied Chemistry, Faculty of Engineering and Technology, Aligarh Muslim University, UP, India, and Department of Physics, Faculty of Science, AMU, are gratefully acknowledged for providing laboratory facilities. The UGC Start-up grant is thanked for financial support.
Supporting Information Available
The Supporting Information is available free of charge at https://pubs.acs.org/doi/10.1021/acsomega.0c05557.
Geometric parameters for L1, torsion angle, important donor–acceptor NBO interactions based on second-order perturbation theory analysis of the Fock matrix in NBO basis for L1, concentration-dependent UV–vis absorption spectra of L1, representation of the Hirshfeld surface, representation of the molecular structure of L1, close interaction in the title molecule with its neighbouring species, optimized geometry of L1, simulated and experimental IR spectra along with band assignments for L1, theoretical and experimental UV–vis absorption spectra of L1, and FTIR spectrum of L1 (PDF)
Single crystal data of L1 (https://doi.org/10.1107/S2056989018016262) with CCDC1879300 (CIF)
This data can be obtained free of charge via http://www.ccdc.cam.ac.uk/conts/retrieving.html, or from the Cambridge Crystallographic Data Centre, 12 Union Road, Cambridge CB2 1EZ, UK; fax: (+44) 1223-336-033; or e-mail:deposit@ccdc.cam.ac.uk
The authors declare no competing financial interest.
Supplementary Material
References
- Kouissa B.; Bouchouit K.; Abed S.; Essaidi Z.; Derkowska B.; Sahraoui B. Investigation study on the nonlinear optical properties of natural dyes: Chlorophyll a and b. Opt. Commun. 2013, 293, 75–79. 10.1016/j.optcom.2012.12.009. [DOI] [Google Scholar]
- Shi Y.; Lou A. J.-T.; He G. S.; Baev A.; Swihart M. T.; Prasad P. N.; Marks T. J. Cooperative coupling of cyanine and tictoid twisted π-systems to amplify organic chromophore cubic nonlinearities. J. Am. Chem. Soc. 2015, 137, 4622–4625. 10.1021/jacs.5b01042. [DOI] [PubMed] [Google Scholar]
- May J. C.; Lim J. H.; Biaggio I.; Moonen N. N. P.; Michinobu T.; Diederich F. Highly efficient third-order optical nonlinearities in donor-substituted cyanoethynylethene molecules. Opt. Lett. 2005, 30, 3057–3059. 10.1364/ol.30.003057. [DOI] [PubMed] [Google Scholar]
- Asthana D.; Ajayakumar M. R.; Pant R. P.; Mukhopadhyay P. NTCDA–TTF first axial fusion: emergent panchromatic, NIR optical, multi-state redox and high optical contrast photooxidation. Chem. Commun. 2012, 48, 6475–6477. 10.1039/c2cc31274c. [DOI] [PubMed] [Google Scholar]
- Cyvin S. J.; Rauch J. E.; Decius J. C. Theory of hyper-raman effects (Nonlinear inelastic light scattering): Selection rules and depolarization ratios for the second-order polarizability. J. Chem. Phys. 1965, 43, 4083–4095. 10.1063/1.1696646. [DOI] [Google Scholar]
- Coe B. J. Switchable nonlinear optical metallochromophores with pyridinium electron acceptor groups. Acc. Chem. Res. 2006, 39, 383–393. 10.1021/ar050225k. [DOI] [PubMed] [Google Scholar]
- Ostroverkhova O. Organic optoelectronic materials: mechanisms and applications. Chem. Rev. 2016, 116, 13279–13412. 10.1021/acs.chemrev.6b00127. [DOI] [PubMed] [Google Scholar]
- Jia J.; Li T.; Cui Y.; Li Y.; Wang W.; Han L.; Li Y.; Gao J. Study on the synthesis and third-order nonlinear optical properties of D-A poly-quinacridone optical materials. Dyes Pigm. 2019, 162, 26–35. 10.1016/j.dyepig.2018.09.038. [DOI] [Google Scholar]
- Bhuvaneswari R.; Murugesan K. S. Synthesis, growth, structural, dielectric, thermal, linear and nonlinear properties of 8-hydroxyquinolinium 3-carboxy-4-hydroxy benzene sulfonate monohydrate single crystal. Opt. Mater. 2019, 98, 109431. 10.1016/j.optmat.2019.109431. [DOI] [Google Scholar]
- Mohamed M. P.; Sudha S.; Jayaprakash P.; Vinitha G.; Nageshwari M.; Sangeetha P.; Kumari C. R. T.; Caroline M. L. Growth and characterization of L-histidinium fumarate fumaric acid monohydrate single crystal: A promising second and third order nonlinear optical material. Chin. J. Phys. 2019, 60, 581–597. 10.1016/j.cjph.2019.05.032. [DOI] [Google Scholar]
- Derkowska-Zielinska B.; Barwiolek M.; Cassagne C.; Boudebs G. Nonlinear optical study of Schiff bases using Z-scan technique. Opt. Laser Technol. 2020, 124, 105968. 10.1016/j.optlastec.2019.105968. [DOI] [Google Scholar]
- Jia J.; Li Y.; Gao J. A series of novel ferrocenyl derivatives: Schiff bases-like push-pull systems with large third-order optical responses. Dyes Pigm. 2017, 137, 342–351. 10.1016/j.dyepig.2016.11.008. [DOI] [Google Scholar]
- Asthana D.; Pandey R.; Mukhopadhyay P. Urea-based constructs readily amplify and attenuate nonlinear optical activity in response to H-bonding and anion recognition. Chem. Commun. 2013, 49, 451. 10.1039/c2cc36631b. [DOI] [PubMed] [Google Scholar]
- Mukhopadhyay P.; Bharadwaj P. K.; Krishnan A.; Das P. K. Synthesis and characterization of mono- and bis-D−π–A cryptand derivatives for second-order nonlinear optics and its modulation with different metal ion inputs. J. Mater. Chem. 2002, 12, 2786–2791. 10.1039/b203199j. [DOI] [Google Scholar]
- Dominiak P. M.; Grech E.; Barr G.; Teat S.; Mallinson P.; Woźniak K. Neutral and ionic hydrogen bonding in schiff bases. Chem.—Eur. J. 2003, 9, 963. 10.1002/chem.200390118. [DOI] [PubMed] [Google Scholar]
- Minkin V. I.; Tsukanov A. V.; Dubonosov A. D.; Bren V. A. Tautomeric Schiff bases: Iono-, solvato-, thermo- and photochromism. J. Mol. Struct. 2011, 998, 179–191. 10.1016/j.molstruc.2011.05.029. [DOI] [Google Scholar]
- D’silva E. D.; Podagatlapalli G. K.; Venugopal Rao S.; Dharmaprakash S. M. Study on third-order nonlinear optical properties of 4-methylsulfanyl chalcone derivatives using picosecond pulses. Mater. Res. Bull. 2012, 47, 3552–3557. 10.1016/j.materresbull.2012.06.063. [DOI] [Google Scholar]
- Thilak T.; Ahamed M. B.; Vinitha G. Third order nonlinear optical properties of potassium dichromate single crystals by Z-scan technique. Optik 2013, 124, 4716–4720. 10.1016/j.ijleo.2013.01.111. [DOI] [Google Scholar]
- Baig M. I.; Anis M.; Muley G. G. Influence of tartaric acid on linear-nonlinear optical and electrical properties of KH2PO4 crystal. Opt. Matter 2017, 72, 1–7. 10.1016/j.optmat.2017.05.042. [DOI] [Google Scholar]
- Afzal S. M.; Razvi M. A. N.; Khan S. A.; Osman O. I.; Bakry A. H.; Asiri A. M. Physicochemical and nonlinear optical properties of novel environmentally benign heterocyclic azomethine dyes: experimental and theoretical studies. PloS One 2016, 11, e0161613 10.1371/journal.pone.0161613. [DOI] [PMC free article] [PubMed] [Google Scholar]
- Rocha M.; Ruiz M. C.; Echeverría G. A.; Piro O. E.; Di Virgilio A. L.; León I. E.; Frontera A.; Gil D. M. Diethylaminophenyl-based Schiff base Cu(II) and V(IV) complexes: experimental and theoretical studies and cytotoxicity assays. New J. Chem. 2019, 43, 18832–18842. 10.1039/c9nj04975d. [DOI] [Google Scholar]
- Metzler C. M.; Cahill A.; Metzler D. E. Equilibriums and Absorption Spectra of Schiff Bases. J. Am. Chem. Soc. 1980, 102, 6075–6082. 10.1021/ja00539a017. [DOI] [Google Scholar]
- Alexandrov E. V.; Blatov V. A.; Kochetkov A. V.; Proserpio D. M. Underlying nets in three-periodic coordination polymers: topology, taxonomy and prediction from a computer-aided analysis of the Cambridge structural database. CrystEngComm 2011, 13, 3947–3958. 10.1039/c0ce00636j. [DOI] [Google Scholar]
- a Spackman M. A.; Jayatilaka D. Hirshfeld surface analysis. CrystEngComm 2009, 11, 19–32. 10.1039/b818330a. [DOI] [Google Scholar]; b Seth S. K.; Sarkar D.; Roy A.; Kar T. Insight into supramolecular self-assembly directed by weak interactions in acetophenone derivatives: crystal structures and Hirshfeld surface analyses. CrystEngComm 2011, 13, 6728–6741. 10.1039/c1ce05670k. [DOI] [Google Scholar]
- McKinnon J. J.; Jayatilaka D.; Spackman M. A. Towards quantitative analysis of intermolecular interactions with Hirshfeld surfaces. Chem. Commun. 2007, 3814–3816. 10.1039/b704980c. [DOI] [PubMed] [Google Scholar]
- McKinnon J. J.; Fabbiani F. P. A.; Spackman M. A. Comparison of polymorphic molecular crystal structures through Hirshfeld surface analysis. Cryst. Growth Des. 2007, 7, 755. 10.1021/cg060773k. [DOI] [Google Scholar]
- Fabbiani F. P. A.; Byrne L. T.; McKinnon J. J.; Spackman M. A. Solvent inclusion in the structural voids of form II carbamazepine: single-crystal X-ray diffraction, NMR spectroscopy and Hirshfeld surface analysis. CrystEngComm 2007, 9, 728–652. 10.1039/b708303n. [DOI] [Google Scholar]
- McKinnon J. J.; Spackman M. A.; Mitchell A. S. Novel tools for visualizing and exploring intermolecular interactions in molecular crystals. Acta Crystallogr., Sect. B: Struct. Sci. 2004, 60, 627–668. 10.1107/s0108768104020300. [DOI] [PubMed] [Google Scholar]
- Sutherland R. L.; McLean D. G.; Kirkpatrick S.. Handbook of Nonlinear Optics, 2nd ed; Marcel Dekker: New York, 2003; pp 339–341. [Google Scholar]
- Boyd R. W.Nonlinear Optics, 3rd ed; Academic Press, 2008; pp 207–369. [Google Scholar]
- Liu X.; Guo S.; Wang H.; Hou L. Theoretical study on the closed-aperture Z-scan curves in the materials with nonlinear refraction and strong nonlinear absorption. Opt. Commun. 2001, 197, 431–437. 10.1016/s0030-4018(01)01406-7. [DOI] [Google Scholar]
- Sudharsana N.; Keerthana B.; Nagalakshmi R.; Krishnakumar V.; Guru Prasad L. Growth and characterization of hydroxyl ethylammonium picrate single crystals for third-order nonlinear optical applications. Mater. Chem. Phys. 2012, 134, 736–746. 10.1016/j.matchemphys.2012.03.062. [DOI] [Google Scholar]
- Sheik-bahae M.; Said A. A.; Stryland E. W. V. High-sensitivity, single-beam n(2) measurements. Opt. Lett. 1989, 14, 955–957. 10.1364/ol.14.000955. [DOI] [PubMed] [Google Scholar]
- El-Shishtawy R. M.; Al-Zahrani F. A. M.; Afzal S. M.; Razvi M. A. N.; Al-amshany Z. M.; Bakry A. H.; Asiri A. M. Synthesis, linear and nonlinear optical properties of a new dimethine cyanine dye derived from phenothiazine. RSC Adv. 2016, 6, 91546–91556. 10.1039/c6ra13839j. [DOI] [Google Scholar]
- Sreekumar G.; Frobel P. G. L.; Muneera C. I.; Sathiyamoorthy K.; Vijayan C.; Mukherjee C. Saturable and reverse saturable absorption and nonlinear refraction in nanoclustered amido black dye–polymer films under low power continuous wave He–Ne laser light excitation. J. Opt. A: Pure Appl. Opt. 2009, 11, 125204. 10.1088/1464-4258/11/12/125204. [DOI] [Google Scholar]
- Ao G.; Xiao Z.; Qian X.; Li Z.; Wang Y.; Zhang X.; Song Y. Nonlinear optical properties tuning in meso-tetraphenylporphyrin derivatives substituted with donor/acceptor groups in picosecond and nanosecond regimes. Molecules 2015, 20, 5554–5565. 10.3390/molecules20045554. [DOI] [PMC free article] [PubMed] [Google Scholar]
- Uthaya Kumar M.; Jeyakumari A. P.; Anbalagan G.; Shinde V.; Sriram S. Quantum chemical studies on synthesis, characterization and third order nonlinear optical properties of (E)-2-(benzo [d][1, 3] dioxol-5-ylmethylene) hydrazinecarboxamide single crystal. J. Mater. Sci.: Mater. Electron. 2019, 30, 11931–11944. 10.1007/s10854-019-01541-4. [DOI] [Google Scholar]
- Senthil K.; Kalainathan S.; Hamada F.; Yamada M.; Aravindan P. G. Synthesis, growth, structural and HOMO and LUMO, MEP analysis of a new stilbazolium derivative crystal: a enhanced third-order NLO properties with a high laser-induced damage threshold for NLO applications. Opt. Mater. 2015, 46, 565–577. 10.1016/j.optmat.2015.05.029. [DOI] [Google Scholar]
- Socrates G.Infrared Characteristic Group Frequencies, 3rd ed.; Wiley Interscience Publications: New York, 1980; pp 15–47. [Google Scholar]
- Amiri S. S.; Makarem S.; Ahmar H.; Ashenag S. Theoretical studies and spectroscopic characterization of novel 4-methyl-5-((5-phenyl-1, 3, 4-oxadiazol-2-yl) thio) benzene-1, 2-diol. J. Mol. Struct. 2016, 1119, 18–24. 10.1016/j.molstruc.2016.04.053. [DOI] [Google Scholar]
- Khalid M.; Ali A.; Jawaria R.; Asghar M. A.; Asim S.; Khan M. U.; Hussain R.; Fayyaz ur Rehman M.; Ennis C. J.; Akram M. S. First principles study of electronic and nonlinear optical properties of A–D−π–A and D–A–D−π–A configured compounds containing novel quinoline–carbazole derivatives. RSC Adv. 2020, 10, 22273–22283. 10.1039/d0ra02857f. [DOI] [PMC free article] [PubMed] [Google Scholar]
- John C.; Manimaran D.; Joe I. H.; Lukose G.; Rahim S. Structure and nonlinear optical properties study of 2-amino-5-chlorobenzophenone: A spectroscopic approach. Orient. J. Chem. 2016, 32, 637. 10.13005/ojc/320172. [DOI] [Google Scholar]
- Kumar A.; Yadav M. P. S. Computational studies of third-order nonlinear optical properties of pyridine derivative 2-aminopyridinium p-toluenesulphonate crystal. Pramana—J. Phys. 2017, 89, 7. 10.1007/s12043-017-1397-9. [DOI] [Google Scholar]
- Sasikala V.; Sajan D.; Joseph L.; Balaji J.; Prabu S.; Srinivasan P. Spectroscopic and DFT-based computational studies on the molecular electronic structural characteristics and the third-order nonlinear property of an organic NLO crystal: (E)-N′-(4-chlorobenzylidene)-4-methylbenzenesulfonohydrazide. Chem. Phys. Lett. 2017, 674, 11–27. 10.1016/j.cplett.2017.02.039. [DOI] [Google Scholar]
- Arivazhagan M.; Kumar J. S. Vibrational assignment, HOMO–LUMO, first-hyperpolarizability and Mulliken’s charge analysis of 2, 7-dinitrofluorene. Indian J. Pure Appl. Phys. 2012, 50, 363–373. [Google Scholar]
- Valverde C.; de Lima e Castro S. A.; Vaz G. R.; de Almeida Ferreira J. L.; Baseia B.; Osório F. A. P. Third-order nonlinear optical properties of a carboxylic acid derivative. Acta Chim. Slov. 2018, 65, 739–749. 10.17344/acsi.2018.4462. [DOI] [PubMed] [Google Scholar]
- Kamaal S.; Faizi M. S. H.; Ali A.; Ahmad M.; Iskenderov T. Crystal structure of 4-[(3-methoxy-2-oxidobenzylidene)azaniumyl]benzoic acid methanol monosolvate. Acta Crystallogr., Sect. E: Crystallogr. Commun. 2018, 74, 1847–1850. 10.1107/s2056989018016262. [DOI] [PMC free article] [PubMed] [Google Scholar]
- Sheik-Bahae M.; Said A. A.; Wei T. H.; Hagan D. J.; Stryland E. V. V. Sensitive measurement of optical nonlinearities using a single beam. IEEE J. Quantum Electron. 1990, 26, 760–769. 10.1109/3.53394. [DOI] [Google Scholar]
- Said A. A.; Sheik-Bahae M.; Hagan D. J.; Wei T. H.; Wang J.; Young J.; Van Stryland E. W. Determination of bound-electronic and free-carrier nonlinearities in ZnSe, GaAs, CdTe, and ZnTe. J. Opt. Soc. Am. B 1992, 9, 405–414. 10.1364/josab.9.000405. [DOI] [Google Scholar]
- Zhang J. Research on experimental accuracy of laser Z-scan technology. AIP Conf. Proc. 2018, 1794, 020025. 10.1063/1.4971907. [DOI] [Google Scholar]
- Frisch M. J.; Trucks G. W.; Schlegel H. B.; Scuseria G. E.; Robb M. A.; Cheeseman J. R.; Scalmani G.; Barone V.; Petersson G. A.; et al. Gaussian 09, Revision D.01; Gaussian Inc.: Wallingford, CT, 2009. https://gaussian.com/.
- Dennington R.; Keith T.; Millam J.. GaussView, Ver. 5; Semichem Inc.: Shawnee Mission KS, 2009.
Associated Data
This section collects any data citations, data availability statements, or supplementary materials included in this article.