

Abstract

It remains a research challenge in determining the catalytic reaction mechanisms primarily caused by the difficulty to experimentally identify active intermediates with current analytic characterizations. Although computational chemistry has provided an alternative approach to simulate the catalysis process and achieve insights into the reaction pathways, the simulation results would not be conclusive without experimental evidence. Herein, we investigate spatiotemporal electrostatic potential (ESP) distribution surrounding reacting molecules during the catalysis process and suggest its use as a fingerprint to help differentiate and identify active intermediates. Our ESP study of ammonia synthesis on the Ru surface shows a high spatial sensitivity of ESP distribution to molecular configuration and structure of intermediate species and only minor temporal ESP oscillation throughout the lifetime of the intermediates, which provides strong theoretical support to use ESP distribution as a new approach to characterize intermediates. With the ESP measurements at the microscale and in real-time, turning feasible, experimental identification of active intermediates and determination of reaction pathways would become possible by measuring the ESP surrounding the reacting molecules. We suggest developing ESP measurement tools to experimentally explore and unveil reaction mechanisms.
Introduction
Mechanistic catalysis study is an important topic that not only helps to understand the reaction mechanisms and catalytic properties but also provides theoretical guidance in catalyst material research and development. With experimental identification of active intermediates keeping a grand challenge restricted by current analytic techniques, density functional theory (DFT) simulation provides an alternative approach to obtain insights into the reaction mechanisms.1,2 By computing the adsorption energy of all possible intermediates and the energy barrier associated with individual elementary steps, plausible active intermediates and catalysis mechanisms can be proposed through finding the most balanced reaction pathway. Till to date, DFT has been widely used in fundamental catalysis research that resulted in many interesting findings.3−5 However, the DFT simulation results remained largely unvalidated with a lack of solid experimental proof.6−8 Direct measurement of the relative energy of intermediates is difficult to implement. In this regard, the discovery of a new methodology that allows experimental identification of active intermediates becomes essential to confirm DFT simulations and eventually determine the catalysis mechanisms.
Herein, we propose electrostatic potential (ESP) distribution of active intermediates as a new approach for their characterization that can be linked to reaction mechanism validation. Most intermediate species have molecular polarity and have strong electronic interaction with the catalytic active site that often is accompanied by charge transfer,9 which would generate ESP distribution in the surrounding space. Considering that the ESP distribution is sensitive to the molecular configuration and structure, it can be used as a fingerprint of active intermediates for differentiation. In the meantime, high spatial and temporal sensitivity of current ESP techniques has allowed experimental measurement of the values at the microscale and in real time, for instance, surface potential mapping using scanning probe microscopy.10−12 Thus, it would become technically feasible to experimentally monitor spatiotemporal ESP changes surrounding the reacting molecules to help identify the intermediates and determine the reaction pathways during catalysis.
In this work, we validate the use of ESP as an active intermediate fingerprint by simulating ammonia thermal synthesis on the ruthenium surface and investigating spatial and temporal ESP distributions surrounding the active intermediates. Ammonia synthesis is one of the most important chemical reactions, and Ru is discovered as one of the most active catalysts in this reaction.13−16 The past decades have witnessed intensive experimental and theoretical efforts on understanding the reaction mechanisms and the catalytic properties.17−20 Different mechanisms have been proposed, among which the associative and dissociative pathways are largely accepted.21,22 These previous studies provide a representative, good basis reaction system for our ESP study. Our findings show that the ESP distribution is spatially sensitive to active intermediates and temporally stable, with only slight oscillations, throughout the lifetime of intermediates, which provide strong theoretical support of ESP as a valid method for their characterization and differentiation.
Results and Discussion
With many previous DFT studies already conducting extensive mechanistic investigations, this work is not intended to discuss the ammonia synthesis mechanisms but rather uses this reaction as a model system for our ESP study.23,24 In this work, we only consider a case of reacting hydrogen molecule directly with adsorbed nitrogen without considering the dissociative adsorption process of H2 molecules. Two widely accepted reaction mechanisms, the dissociative pathway (route 1) and the associative pathway (route 2), are adopted for simulation on Ru (001) (Table S1).25−27Figure 1a shows the energy diagram of ammonia synthesis following the dissociative mechanism. The reaction begins with the adsorption of the N2 molecule to the active site followed by dissociation into two *N intermediates. This step is kinetically unfavored due to a significant energy barrier to break the symmetric and strong N≡N triple bond.28 The generated *N reacts stepwise with hydrogen, which goes downhill in energy levels and forms *NH, *NH2, and *NH3, respectively. The *NH3 would eventually desorb from the Ru surface, resulting in the final product NH3. In comparison, N2 would not undergo molecular dissociation after adsorption to the active site in the associative mechanism (Figure 1b). Alternately, it directly reacts with adsorbed hydrogen and generates a *N–NH intermediate. *N–NH would continue hydrogenating into *N–NH2, which, with further hydrogenation, generates an unstable *N–NH3 transition state that quickly decomposes into NH3 and *N. The hydrogenation of *N into *NH, *NH2, *NH3, and eventual NH3 follows a similar route as depicted in the dissociative mechanism. Structural models of all these involved intermediates are provided in Figures S1–S13 with computational details. The simulated pathways are consistent with literature studies,29−31 which validate our DFT simulations of the two ammonia synthesis mechanisms.
Figure 1.

DFT-simulated energy diagrams for ammonia synthesis on Ru (001) following (a) dissociative mechanism and (b) associative mechanism.
Figure 2 shows computed two-dimensional (2D) and three-dimensional (3D) electrostatic potential (ESP) maps of individual active intermediates, which are involved in the ammonia synthesis process. The contour maps are colored for differentiating ESP variation, with color gradients between blue and red representing different ESP values from a lower limit to an upper limit. All 3D maps are shown with ESP values ranging from 0.565 to 0.610 V, and the associated 2D maps are the top view of the ESP in the Ru (001) surface that ranges from 0.650 to 0.660 V. The narrow ESP range of the 2D maps is mainly because of the fact that Ru is metallic and thus the surface is largely equipotential, except the interface region between the intermediate and Ru surface and the void regions between Ru surface atoms. Nevertheless, the ESP still exhibits significant, distinct distributions on the 2D maps with different intermediates. The dependency of ESP distribution on the intermediate type is more dramatic in the 3D space in terms of both the contour map shape and ESP value. This is reasonable as the spatial distribution of ESP is primarily determined by the intermediate species, which is sensitive to their characteristic molecular structure and configuration. For instance, a N2 molecule by itself is symmetric with strong N≡N triple bonds. It generates a very weak ESP distribution with its nonpolar characteristic and thus zero dipole moment. When it adsorbs to Ru and forms *N2, it gets polarized owing to the electronic interaction with the active site that would lead to orbital hybridization and charge transfer. However, the low adsorption energy reveals only a moderate interaction and thus slight polarization. As a result, the 3D ESP map for *N2 shows a merely observable distribution surrounding the intermediate. In comparison, *NH and *NH2 intermediates are generated in the dissociative pathway. As they possess a higher polarity and thus a larger dipole moment, their ESP intensity and spatial distribution are more significant compared to *N2. *N–NH and *N–NH2 are important intermediates in the associative pathway. Their 3D ESP distributions are also intense due to a significant dipole moment and can be easily distinguishable from each other owing to their different molecular characteristics. By examining all the simulated ESP maps, it is evident that each intermediate has its unique ESP distribution that is sensitive to the molecular structure and configuration. In this regard, ESP distribution is an intrinsic characteristic of intermediates and can be used as a fingerprint for their differentiation.
Figure 2.

3D and 2D ESP maps of different active intermediates generated on Ru (001) during ammonia synthesis.
Considering that catalysis is a kinetic process during which individual intermediates would possibly undergo dynamic molecular motions like rotation and bond vibrating during their lifetime, we analyzed temporal changes in their ESP distribution for examining the influence of the intermediate dynamics. Figure 3 shows simulated ESP maps at nine different, representative moments for *N–NH2, an intermediate that has been experimentally characterized and thought to be formed in route 2.32,28 It needs to be noted that typical dynamic motions of a molecule occur in a high frequency within nanoseconds. In our simulation, an arbitrary lifetime interval is used, which does not represent real time but would not affect our major conclusion. The *N–NH2 exhibits slight changes in the rotational and vibrational mode at the nine captured moments, evidencing that the intermediate does undergo dynamic motions. For more quantitative comparison, we read the ESP values at three different space positions surrounding *N–NH2, being labelled as Positions #1, #2, and #3 in Figure 3, at these temporal moments. The ESP readings are found significantly different at the three locations, confirming the spatial sensitivity of the ESP distribution. At each position, the values show continuous variation along the entire measurement timescale, corresponding to the change of ESP distribution caused by intermediate dynamic motions. In the meantime, the ESP variation with arbitrary time series seems minor, with an average of 0.6851 ± 0.0004 V at Position #1, 0.6626 ± 0.0009 V at Position #2, and 0.6433 ± 0.0018 V at Position #3 obtained. These data represent only a <0.2% change (Table S2), which suggests that the ESP distribution of the intermediate would not be significantly influenced by molecular dynamic motions and remains largely unchanged along time. In other words, the space–time results, i.e., the spatiotemporal distribution, further validate the use of ESP as a fingerprint of active intermediates. It needs noting that our ESP distribution simulation is limited to a space close to the intermediates as restricted by the DFT. Considering the big ESP values at angstroms away from the intermediates and decay of ESP being inversely proportional with distance, the ESP would be still significant in value and experimentally sensible even at more distanced positions.
Figure 3.

Representative ESP maps of *N–NH2 at different life moments and temporal changes in the ESP value at different positions (inset: the statistical average of the ESP values at three positions).
With ESP being identified as a characteristic of the intermediate, it provides us the possibility to depict a whole reaction process that involves the generation and consumption of active intermediates using ESP spatiotemporal distribution. As illustrated in Figure 4, the reaction system exhibits characteristic, distinct ESP distributions when different intermediates are generated and consumed in sequence during a catalysis cycle along with subtle ESP oscillations caused by dynamic motions of individual intermediates during their lifetime. The study of ESP distributions would help to achieve more insights into reaction intermediates and mechanisms that would be especially meaningful when the ESP values can be experimentally measured.
Figure 4.
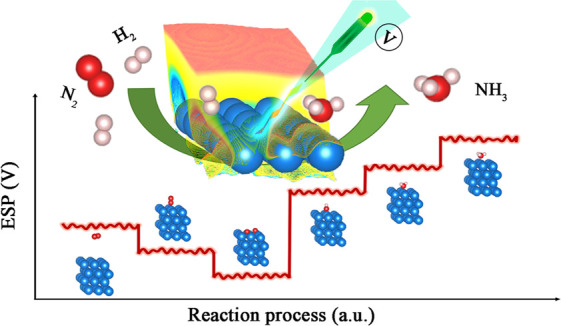
Schematic illustration of spatiotemporal ESP distribution of intermediates during ammonia synthesis.
Supposing ESP can be measured at the nanoscale, which has been becoming possible with the high sensitivity of current potential measurement technology and rapid advancement of microelectronic technology,12,33,34 real-time ESP values at different positions surrounding the active sites throughout the whole reaction process would be obtained. Real-time ESP maps can be reconstructed using the measured ESP values that help to identify the intermediate type and finally determine the reaction pathway, and the timescale ESP change would provide valuable lifetime information of intermediates.
Conclusions
In summary, we studied ESP distributions of active intermediates in ammonia synthesis and examined the spatiotemporal changes. By investigating all involved intermediates, we found that each intermediate has its unique, characteristic ESP distribution, which is spatially sensitive to its molecular structure and configuration. The ESP distribution and values show only slight oscillation over the intermediate lifetime due to molecular dynamic motions of the intermediate. The sensitive feature of ESP distribution and the little temporal change in value suggest a good possibility for use, which helps fingerprint active intermediates and achieve more insights into reaction pathways, which is particularly valuable when the experimental measurement of ESP at the nanoscale becomes available. The discovery of ESP distribution as an intermediate fingerprint would open a new avenue in fundamental catalysis research by achieving additional information of intermediates and unearthing the reaction mechanisms.
Experimental Section
Computational Methods
All DFT calculations were performed using the Quantum ESPRESSO package.35 Generalized gradient approximation (GGA) and the Perdew–Burke–Ernzerhof (PBE) with projector-augmented wave (PAW) sets from PSlibrary 0.3.1 were used to carry out the structure relaxation and energy calculation.36 The bulk lattice of Ru was optimized before the cleavage of the (001) surface. The Ru slab was modeled by a p(3 × 3) unit cell with five layers of close-packed Ru (001) surfaces and a vacuum layer of 18 Å in the direction perpendicular to the surface. A plane-wave basis set was used with a cutoff energy of 60 Ry with the density cutoff being 600 Ry and a Monkhorst–Pack k-point mesh being 2 × 2 × 1. The Fermi-level smearing was set at 0.1 eV. All atoms in the supercell were allowed to relax until the force on each atom is less than 0.05 eV/Å. The relative electrostatic potential surface and values were obtained by post-processing of the abovementioned DFT calculation results using Quantum Espresso.
Acknowledgments
We acknowledge the financial support of this work by National Science Foundation (1955452).
Glossary
Abbreviations
- DFT
density functional theory
- ESP
electrostatic potential.
Supporting Information Available
The Supporting Information is available free of charge at https://pubs.acs.org/doi/10.1021/acsomega.0c05975.
Summary of intermediate models in the simulation, Ru (001) slab model in the simulation, summary of DFT calculation results, and summary of the simulated ESP values of *N–NH2 (PDF)
Author Contributions
‡ J.L. and X.S. contributed equally. All authors have given approval to the final version of the manuscript.
The authors declare no competing financial interest.
Supplementary Material
References
- Nørskov J. K.; Bligaard T.; Rossmeisl J.; Christensen C. H. Towards the Computational Design of Solid Catalysts. Nat. Chem. 2009, 1, 37–46. 10.1038/nchem.121. [DOI] [PubMed] [Google Scholar]
- Bhandari S.; Rangarajan S.; Maravelias C. T.; Dumesic J. A.; Mavrikakis M. Reaction Mechanism of Vapor-Phase Formic Acid Decomposition over Platinum Catalysts: DFT, Reaction Kinetics Experiments, and Microkinetic Modeling. ACS Catal. 2020, 10, 4112–4126. 10.1021/acscatal.9b05424. [DOI] [Google Scholar]
- Gao Y.; Cai Z.; Wu X.; Lv Z.; Wu P.; Cai C. Graphdiyne-Supported Single-Atom-Sized Fe Catalysts for the Oxygen Reduction Reaction: DFT Predictions and Experimental Validations. ACS Catal. 2018, 8, 10364–10374. 10.1021/acscatal.8b02360. [DOI] [Google Scholar]
- Artrith N.; Lin Z.; Chen J. G. Predicting the Activity and Selectivity of Bimetallic Metal Catalysts for Ethanol Reforming Using Machine Learning. ACS Catal. 2020, 10, 9438–9444. 10.1021/acscatal.0c02089. [DOI] [Google Scholar]
- Kuld S.; Thorhauge M.; Falsig H.; Elkjær C. F.; Helveg S.; Chorkendorff I.; Sehested J. Quantifying the Promotion of Cu Catalysts by ZnO for Methanol Synthesis. Science 2016, 352, 969–974. 10.1126/science.aaf0718. [DOI] [PubMed] [Google Scholar]
- Cohen A. J.; Mori-Sánchez P.; Yang W. Insights into Current Limitations of Density Functional Theory. Science 2008, 321, 792–794. 10.1126/science.1158722. [DOI] [PubMed] [Google Scholar]
- Cohen A. J.; Mori-Sánchez P.; Yang W. Challenges for Density Functional Theory. Chem. Rev. 2012, 112, 289–320. 10.1021/cr200107z. [DOI] [PubMed] [Google Scholar]
- Feibelman P. J.; Hammer B.; Nørskov J. K.; Wagner F.; Scheffler M.; Stumpf R.; Watwe R.; Dumesic J. The CO/Pt (111) Puzzle. J. Phys. Chem. B 2001, 105, 4018–4025. 10.1021/jp002302t. [DOI] [Google Scholar]
- Zaera F. Probing Catalytic Reactions at Surfaces. Prog. Surf. Sci. 2001, 69, 1–98. 10.1016/S0079-6816(01)00040-5. [DOI] [Google Scholar]
- Chen X. Q.; Yamada H.; Horiuchi T.; Matsushige K.; Watanabe S.; Kawai M.; Weiss P. S. Surface Potential of Ferroelectric Thin Films Investigated by Scanning Probe Microscopy. J. Vac. Sci. Technol., B 1999, 17, 1930–1934. 10.1116/1.590851. [DOI] [Google Scholar]
- Collins L.; Belianinov A.; Somnath S.; Balke N.; Kalinin S. V.; Jesse S. Full Data Acquisition in Kelvin Probe Force Microscopy: Mapping Dynamic Electric Phenomena in Real Space. Sci. Rep. 2016, 6, 30557. 10.1038/srep30557. [DOI] [PMC free article] [PubMed] [Google Scholar]
- Nellist M. R.; Laskowski F. A. L.; Qiu J.; Hajibabaei H.; Sivula K.; Hamann T. W.; Boettcher S. W. Potential-Sensing Electrochemical Atomic Force Microscopy for in Operando Analysis of Water-Splitting Catalysts and Interfaces. Nat. Energy 2018, 3, 46–52. 10.1038/s41560-017-0048-1. [DOI] [Google Scholar]
- Schlögl R. Catalytic Synthesis of Ammonia—A “Never-Ending Story”?. Angew. Chem. Int. Ed. 2003, 42, 2004–2008. 10.1002/anie.200301553. [DOI] [PubMed] [Google Scholar]
- Erisman J. W.; Sutton M. A.; Galloway J.; Klimont Z.; Winiwarter W. How a Century of Ammonia Synthesis Changed the World. Nat. Geosci. 2008, 1, 636–639. 10.1038/ngeo325. [DOI] [Google Scholar]
- Li J.; Zhan G.; Yang J.; Quan F.; Mao C.; Liu Y.; Wang B.; Lei F.; Li L.; Chan A. W. M.; Xu L.; Shi Y.; Du Y.; Hao W.; Wong P. K.; Wang J.; Dou S.-X.; Zhang L.; Yu J. C. Efficient Ammonia Electrosynthesis from Nitrate on Strained Ruthenium Nanoclusters. J. Am. Chem. Soc. 2020, 142, 7036–7046. 10.1021/jacs.0c00418. [DOI] [PubMed] [Google Scholar]
- Jennings J. R.Catalytic Ammonia Synthesis: Fundamentals and Practice; Springer Science & Business Media: 2013. [Google Scholar]
- Rosowski F.; Hornung A.; Hinrichsen O.; Herein D.; Muhler M.; Ertl G. Ruthenium Catalysts for Ammonia Synthesis at High Pressures: Preparation, Characterization, and Power-Law Kinetics. Appl. Catal., A 1997, 151, 443–460. 10.1016/S0926-860X(96)00304-3. [DOI] [Google Scholar]
- Strongin D. R.; Somorjai G. A. The Effects of Potassium on Ammonia Synthesis over Iron Single-Crystal Surfaces. J. Catal. 1988, 109, 51–60. 10.1016/0021-9517(88)90184-4. [DOI] [Google Scholar]
- Giddey S.; Badwal S. P. S.; Kulkarni A. Review of Electrochemical Ammonia Production Technologies and Materials. Int. J. Hydrogen Energy 2013, 38, 14576–14594. 10.1016/j.ijhydene.2013.09.054. [DOI] [Google Scholar]
- Kyriakou V.; Garagounis I.; Vasileiou E.; Vourros A.; Stoukides M. Progress in the Electrochemical Synthesis of Ammonia. Catal. Today 2017, 286, 2–13. 10.1016/j.cattod.2016.06.014. [DOI] [Google Scholar]
- Garden A. L.; Skúlason E. The Mechanism of Industrial Ammonia Synthesis Revisited: Calculations of the Role of the Associative Mechanism. J. Phys. Chem. C 2015, 119, 26554–26559. 10.1021/acs.jpcc.5b08508. [DOI] [Google Scholar]
- Wang Q.; Guo J.; Chen P. Recent Progress towards Mild-Condition Ammonia Synthesis. J. Energy Chem. 2019, 36, 25–36. 10.1016/j.jechem.2019.01.027. [DOI] [Google Scholar]
- Logadóttir Á.; Nørskov J. K. Ammonia Synthesis over a Ru (0001) Surface Studied by Density Functional Calculations. J. Catal. 2003, 220, 273–279. 10.1016/S0021-9517(03)00156-8. [DOI] [Google Scholar]
- Honkala K.; Hellman A.; Remediakis I. N.; Logadottir A.; Carlsson A.; Dahl S.; Christensen C. H.; Nørskov J. K. Ammonia Synthesis from First-Principles Calculations. Science 2005, 307, 555–558. 10.1126/science.1106435. [DOI] [PubMed] [Google Scholar]
- Rod T. H.; Hammer B.; Nørskov J. K. Nitrogen Adsorption and Hydrogenation on a MoFe 6 S 9 Complex. Phys. Rev. Lett. 1999, 82, 4054. 10.1103/PhysRevLett.82.4054. [DOI] [Google Scholar]
- Rod T. H.; Logadottir A.; Nørskov J. K. Ammonia Synthesis at Low Temperatures. J. Chem. Phys. 2000, 112, 5343–5347. 10.1063/1.481103. [DOI] [Google Scholar]
- Zheng J.; Liao F.; Wu S.; Jones G.; Chen T.-Y.; Fellowes J.; Sudmeier T.; McPherson I. J.; Wilkinson I.; Tsang S. C. E. Efficient Non-dissociative Activation of Dinitrogen to Ammonia over Lithium-Promoted Ruthenium Nanoparticles at Low Pressure. Angew. Chem., Int. Ed. 2019, 58, 17335–17341. 10.1002/anie.201907171. [DOI] [PubMed] [Google Scholar]
- Zhang C. J.; Lynch M.; Hu P. A Density Functional Theory Study of Stepwise Addition Reactions in Ammonia Synthesis on Ru (0001). Surf. Sci. 2002, 496, 221–230. 10.1016/S0039-6028(01)01621-1. [DOI] [Google Scholar]
- Ishikawa A.; Doi T.; Nakai H. Catalytic Performance of Ru, Os, and Rh Nanoparticles for Ammonia Synthesis: A Density Functional Theory Analysis. J. Catal. 2018, 357, 213–222. 10.1016/j.jcat.2017.11.018. [DOI] [Google Scholar]
- Hellman A.; Honkala K.; Remediakis I. N.; Logadóttir Á.; Carlsson A.; Dahl S.; Christensen C. H.; Nørskov J. K. Ammonia Synthesis and Decomposition on a Ru-Based Catalyst Modeled by First-Principles. Surf. Sci. 2009, 603, 1731–1739. 10.1016/j.susc.2008.10.059. [DOI] [Google Scholar]
- Vojvodic A.; Medford A. J.; Studt F.; Abild-Pedersen F.; Khan T. S.; Bligaard T.; Nørskov J. K. Exploring the Limits: A Low-Pressure, Low-Temperature Haber–Bosch Process. Chem. Phys. Lett. 2014, 598, 108–112. 10.1016/j.cplett.2014.03.003. [DOI] [Google Scholar]
- Anderson J. S.; Cutsail G. E. III; Rittle J.; Connor B. A.; Gunderson W. A.; Zhang L.; Hoffman B. M.; Peters J. C. Characterization of an FeN–NH2 Intermediate Relevant to Catalytic N2 Reduction to NH3. J. Am. Chem. Soc. 2015, 137, 7803–7809. 10.1021/jacs.5b03432. [DOI] [PMC free article] [PubMed] [Google Scholar]
- Nellist M. R.; Chen Y.; Mark A.; Gödrich S.; Stelling C.; Jiang J.; Poddar R.; Li C.; Kumar R.; Papastavrou G. Atomic Force Microscopy with Nanoelectrode Tips for High Resolution Electrochemical, Nanoadhesion and Nanoelectrical Imaging. Nanotechnology 2017, 28, 95711. 10.1088/1361-6528/aa5839. [DOI] [PubMed] [Google Scholar]
- Kai T.; Zhou M.; Duan Z.; Henkelman G. A.; Bard A. J. Detection of CO2•–in the Electrochemical Reduction of Carbon Dioxide in N, N-Dimethylformamide by Scanning Electrochemical Microscopy. J. Am. Chem. Soc. 2017, 139, 18552–18557. 10.1021/jacs.7b08702. [DOI] [PubMed] [Google Scholar]
- Giannozzi P.; Baroni S.; Bonini N.; Calandra M.; Car R.; Cavazzoni C.; Ceresoli D.; Chiarotti G. L.; Cococcioni M.; Dabo I. QUANTUM ESPRESSO: A Modular and Open-Source Software Project for Quantum Simulations of Materials. J. Phys.: Condens. Matter 2009, 21, 395502. 10.1088/0953-8984/21/39/395502. [DOI] [PubMed] [Google Scholar]
- Dal Corso A. Pseudopotentials Periodic Table: From H to Pu. Comput. Mater. Sci. 2014, 95, 337–350. 10.1016/j.commatsci.2014.07.043. [DOI] [Google Scholar]
Associated Data
This section collects any data citations, data availability statements, or supplementary materials included in this article.