

Abstract

The need to recover the graphene properties in terms of electrical and thermal conductivity calls for the application of reduction processes leading to the removal of oxygen atoms from the graphene oxide sheet surface. The recombination of carbon–carbon double bonds causes a partial recovery of the original graphene properties mainly limited by the presence of residual oxygen atoms and lattice defects. However, the loss of polar oxygen-based functional groups renders the material dispersibility rather complicated. In addition, oxygen-containing functional groups are reaction sites useful to further bind active molecules to engineer the reduced graphene sheets. For these reasons, a variety of chemical processes are described in the literature to reduce the graphene oxide. However, it is greatly important to select a chemical process enabling a thin modulation of the residual oxygen content thus tuning the properties of the final product. In this work, we will present a chemical-processing technique based on the hydroiodic acid to carefully control the degree of residual oxidation. Graphene oxides were reduced using hydroiodic acid with concentrations from 0.06 to 0.95 mol L–1. Their properties were characterized in detail and tested, and the results showed that their oxygen content was finely tuned from 33.6 to 10.7 atom %. This allows carefully tailoring the material properties with respect to the desired application, which is exemplified by the variation of the bulk resistance from 92 Ω to 14.8 MΩ of the film from the obtained rGO.
1. Introduction
Carbon atoms of graphene are densely packed into a honeycomb lattice structure with sp2 bonding hybridization. The resulting two-dimensional atomic monolayer consequently has outstanding electron conductivity, excellent mechanical strength, superior thermal conductivity, and a high surface area.1 These unique properties render graphene a promising material for a variety of applications from electronics to energy conversion and storage, sensing, medicine, and catalysis.2−6 However, one of the barriers that obstructs its wide replacement of conventional materials in these applications is scalability and cost of graphene production. Various methods have been developed for graphene synthesis and can be generally categorized into bottom-up and top-down approaches. Chemical vapor deposition (CVD) is a typical bottom-up approach, which builds a graphene sheet through thermal decomposition of hydrocarbon molecules on a catalytic substrate surface.7 A large-area and high-quality graphene sheet was prepared by CVD, but this process suffers greatly from a low production rate, high cost, and sophisticated instrumentation. The alternative top-down approach produces separated graphene sheets by exfoliation of inexpensive bulk graphite. The exfoliation techniques include micromechanical cleavage, solution exfoliation, chemical exfoliation, and electrochemical exfoliation, among which chemical exfoliation could be a promising route to produce large amounts of graphene at low cost.8
In the process of chemical exfoliation of graphite, bulk graphite is first chemically oxidized into graphite oxide using strong oxidation agents.9 During the oxidation reaction, various functional groups, such as hydroxyl and epoxide randomly distributed on the basal surface and carboxylic acid at edges, are introduced,10 which intercalate with water molecules to increase the interlayer spacing. The enlarged layer distance makes it possible to delaminate graphite oxide into graphene oxide (GO) under ultrasonication.11 The presence of oxygen functionalization in GO partially breaks sp2–sp2 bonds into sp3–sp3 bonds, which makes GO a good insulator.12 A subsequent GO transformation into reduced GO (rGO) can be performed to restore the π-conjugated structure and conductivity resembling graphene.
The chemical exfoliation approach not only provides an efficient pathway to produce a graphene-like structure with superior properties, but also provides this kind of material great tunability for different applications. With a low oxygen content, as mentioned above, rGO recovers to some extent graphene’s properties and becomes a good electrical and thermal conductor, although there will be some differences because of incomplete reduction and defect formation.13 In contrast, with high oxygen contents, polar functionalities on rGO make it more hydrophilic to be dispersible in polar solvents, especially in aqueous solution. More importantly, oxygen-containing functional groups provide reaction sites to produce functionalized GO. For example, GO/rGO composites containing metal nanoparticles,14−16 oxides/hydroxides,17−20 organic molecules,21,22 and doped heteroatoms23 have been reported to be successfully synthesized. Therefore, fine tuning the oxygen contents is important for the performance optimization of rGO.
Many reducing agents, for example, H2S,24 hydrazine,25 NaBH4,26 hydrohalic acid,27 metal iodide,28 ascorbic acid,29 amino acids,30 etc. have been investigated for GO reduction to prepare rGO. Depending on their reducing potential and reaction mechanism, the properties of final rGO products from different reductants showed significantly different properties. Their oxygen content in terms of the C/O ratio varied from 30 to 2.2, and conductivities changed from 3.2 × 10⁻⁵ to 55,088 S m–1.28,31 Hydrazine and its derivatives are well-known reagents for the GO reduction. Stankovich et al. reported that the C/O atom ratio increased from 2.7 to 10.3 after reduction with hydrazine hydrate.32 However, in addition to the decrease of the oxygen level, reduction with hydrazine also left nitrogen impurities,32,33 which is supposed to cause lower conductivity than pristine graphene.34 NaBH4 is also effective as a reductant for GO and can overcome the nitrogen contamination problem of hydrazine. One problem of NaBH4 reduction is its hydrolysis, which can reduce its reduction efficiency. A C/O ratio of about 6.8 of rGO reduced by NaBH4 was achieved in 2.1 h reduction treatment.35 Recently, green reductants have attracted much attention for GO reduction. Ascorbic acid is one of the most studied green reductants, which is nontoxic to environment and microorganisms, and the obtained rGO can be used for biomedical applications. However, its reduction strength is not comparable to hydrazine. The obtained rGO products have a C/O range of 2.7–6.36,37 Up to now, the most effective reductants for GO reduction have been hydroiodic acid or metal iodide. The rGO samples reduced by 55% hydroiodic acid (HI) at 100 °C for 1 h reached a C/O ratio higher than 12 and a high conductivity of 29,800 S m–1. The rGO reduced by the FeI2 acid solution at 95 °C for 6 h also showed a conductivity as high as 55,088 S m–1. The high conductivities of these two samples have been attributed to the nucleophilic substitution reaction of oxygen-containing functional groups by I–, the reaction promotion by a high concentration of H+, and easy elimination of most of the iodine atoms.28,38
Therefore, in consideration of the importance of tuning of the oxygen content and powerful restoration of properties after hydriodic (HI) reduction, we herein report in detail the tuning of the oxygen content of rGO by controlling the HI solution concentration during the chemical reduction in aqueous solution. The evolution of the structure and properties of rGO along with the degree of reduction was investigated using various techniques. This study provided an easy and efficient way to control the oxygen content of rGO, which could find various applications depending on its oxygen content.
2. Results and Discussion
2.1. Successful Reduction of GO
We first performed XPS measurements to check the success of GO reduction to rGO by the HI aqueous solution. A survey scan from 0 to 1200 eV binding energy was first carried out for the GO and rGO samples. The spectra are shown in Figure 1. For comparison purpose, all the wide survey spectra were normalized to C 1s peaks. The main peaks at about 284 and 531 eV can be attributed to C 1s and O 1s, respectively.39 In the GO spectrum, the O 1s peak is dominant over C 1s, which reveals that GO is rich in oxygen functional groups before reduction. Compared with GO, there is a significant decrease in the O 1s peak intensity in rGO samples along with the increase of the HI solution concentration. This is a direct indication of successful removal of oxygen atoms from GO and a good control of the reduction degree of rGO. For rGO, two weak peaks from iodine were also detected at 619.1 eV (I3d 5/2) and 630.9 eV (I3d 3/2),40 which means that a small amount of I atoms remains after reduction, especially for samples reduced by high HI concentrations.
Figure 1.

Wide survey XPS spectra of GO and rGO reduced with different HI concentrations.
The thermogravimetric analysis–differential scanning calorimetry (TGA–DSC) technique is another powerful technique to prove the accomplishment of a controlled reduction of GO to rGO. During the TGA–DSC measurement, a thermal reduction process of GO/rGO samples occurred by removing the oxygen functional group in the form of CO or CO2 gases. Therefore, the weight loss during this measurement is dependent on the oxygen content of GO/rGO. As shown in Figure 2, GO obviously showed the highest weight loss of 51.2 wt % when the measurement temperature reached 800 °C. The rGO samples, as expected, showed much lower weight loss because of less oxygen functional groups after reduction. Their values decreased in the reversed order of the HI concentration gradually from 38.3 to 29.8, 23.4, 19.7, and 16.1 wt %, respectively.
Figure 2.

TGA curves of GO and rGO reduced with different HI concentrations.
The weight losses of GO and rGO proceeded in three steps. Minor weight loss (less than 5 wt %) below 150 °C is supposed to be because of the escape of adsorbed water molecules. Main weight losses of GO and rGO occurred in the temperature range from 150 to 400 °C resulting from the thermal decomposition of oxygen-containing functional groups into H2O, CO, and CO2 gases. The slow weight loss after 400 °C is caused by the elimination of more stable functional groups.41−43 Accompanied by the removal of oxygen-containing functional groups, an exothermic peak at 100–250 °C was detected on DSC curves as shown in Figure 3. The exothermic nature of this reaction has been widely reported previously44 and explained by the transformations of epoxide groups and accelerated by the presence of OH groups. Therefore, it is obvious that the TGA–DSC results are highly in agreement with the XPS results (wide spectra in Figure 1) showing the success of controllable reduction of GO by varying the HI solution concentration.
Figure 3.

DSC curves of GO and rGO reduced with different HI concentrations.
The UV–vis spectra in Figure 4 show that with the increase of the HI reducing agent concentration, a red-shift of the absorption peak occurs. For the GO sample, the absorption occurs at 238 nm as found by other authors45−47 resulting from the π–π* transition of aromatic C–C bonds. The GO sample also shows a visible feature at ∼303 nm, which is commonly attributed to n–π* due to both C=O bonds47 and to optical transitions between π and π* states in the finite-sized molecular sp2 domains and the nanometer-size sp2 clusters.48,49 Upon reduction, the absorption band at 238 nm red-shifts and the feature at 303 nm disappears. In addition, the shift of the absorption band increases with increasing degree of the GO reduction. The shift toward the NIR is caused by the conversion of sp3 oxygen-coordinated carbon atoms to sp2 with the carbon oxygen bond breakage and recombination in C=C.50 Then, also the sequence of the UV–vis spectra shows a substantial agreement with the previous experiments where the loss of oxygen atoms induced by HI leads to a reduction of the bandgap (graphitization) with a parallel reduction of the absorption band frequency and disappearance of the oxygen-related absorption features.
Figure 4.

UV–vis spectra of GO and rGO reduced with different HI concentrations.
2.2. Effects of Oxygen Contents on Surface and Structural Properties
To determine the oxygen contents and surface functional groups of GO and rGO samples, high-resolution XPS spectra of C 1s and O 1s were acquired. Figure S1 reports the trend of the O 1s and C 1s line shapes as a function of the HI concentration. Figure S1A shows that increasing the HI concentration induces a lowering of the O 1s intensity. In agreement with this finding, the intensity of the oxidized carbon components also decreases in the BE range 286−290 eV as summarized in Figure S1C. For the sake of clarity, to better appreciate the effect of the increasing HI concentration on the reduction process, the C 1s core lines were normalized to a common height. An example of the O 1s and C 1s peak fitting is reported in Figure S1B and S1D.
The C 1s spectrum of GO can be fitted using six peaks corresponding to carbon atoms in different chemical environments. The peak at 284.4 eV describes the sp2-hybridized C atoms arranged on the corner of a hexagon as in graphite. The peak at ∼285.4 eV corresponds to sp3-hybridized carbon atoms,51 which likely derives from unsaturated carbon atoms reacting with hydrogen during the oxidation process as shown using theoretical models.10 The peak at ∼286.4 is assigned to epoxy and hydroxyl functional groups. The peak at ∼287 eV is attributed to the carbonyl group while a slightly higher binding energy describes the O–C–O bond. The highest BE around 289.5 eV describes the carboxyl acidic component.35,52−54 The results of the spectral peak fitting are summarized in Table 1. In the spectrum of GO, the more intense peak is attributed to C–OH bonds. Acid treatment is needed to exfoliate graphite leading to graphene sheet formation, responsible for the oxidation of carbon atoms. There are different models describing the oxidation of the resulting graphene sheets. The experimental evidence from different techniques leads to a collective picture where the dominant structural features present on the surface of GO are attributed to tertiary alcohols and ethers, most likely 1,2-ethers (i.e., epoxides)10 as confirmed by the XPS spectrum of C 1s.
Table 1. Bond concentrations as measured by XPS.
| O 1s conc.
(%) |
C 1s conc. (%) |
||||||||
|---|---|---|---|---|---|---|---|---|---|
| C–OH |
C–OH |
||||||||
| C=O | C–O–C | H2O | C=C | C sp3 | C–O–C | C=O | O–C–O | C–(C=O) | |
| GO | 7.78 | 24.7 | 1.11 | 30.01 | 0 | 22.88 | 6.9 | 4.17 | 1.37 |
| rGO 0.06 | 3.5 | 18.36 | 1.02 | 48.46 | 7.01 | 16.68 | 3.12 | 1.53 | 0.32 |
| rGO 0.12 | 1.62 | 14.9 | 2.59 | 55.11 | 7.14 | 14.19 | 3.51 | 0.95 | 0 |
| rGO 0.24 | 2.55 | 8.35 | 0.46 | 74.44 | 6.05 | 4.73 | 2.47 | 0.96 | 0 |
| rGO 0.47 | 3.24 | 6.91 | 0.32 | 76.47 | 6.02 | 4.55 | 1.62 | 0.87 | 0 |
| rGO 0.95 | 3.29 | 7.17 | 0.2 | 76.53 | 6.97 | 4.43 | 0.78 | 0.63 | 0 |
After reduction, the C 1s spectra of the rGO samples can be described by the same number of peaks, but their intensity changes significantly. The decreasing concentrations of oxygen calculated from the XPS spectra are plotted against the HI concentration in Figure 5. As can be observed, the main changes in the O 1s and C 1s core lines displayed in Figure S1A and S1C are attributed to a steep decrease of the oxygen concentration with increasing molar concentration of HI acid in the reducing process. The efficiency of the acid treatment drops at HI concentrations ∼0.2 mM letting the oxygen concentration almost constant at a value of 10%. There are several reduction methods of the GO (see e.g., the review31), they can be grouped into two categories: the first group is formed by reducing agents traditionally applied in synthetic chemistry with reaction pathways toward specific oxygen functional groups (i.e., metal hydrides are reactive toward carbonyl functional groups). To the second category belong reducing agents, which do not display any definite modes of reaction leading to nonspecific oxygen moieties.
Figure 5.

Curve of the oxygen content in rGO vs HI concentration for reduction.
Hydrohalic acids such as HI, HBr, and HCl are often utilized for electrophilic addition and nucleophilic substitution reactions. The halides are nucleophilic in nature, with increasing nucleophilicity from Cl– < Br– < I–. In particular, important property of the hydrohalic acids is their capability of opening epoxides.31 These properties render the hydrohalic acids superior candidates for removing hydroxyl and epoxide groups which, as already observed, constitute the main part of oxygen functionalities on GO. According to the suggested reaction mechanism by Moon et al., The reduction process includes iodination of alcohols, cleavage of ether and iodination, reduction of aromatic iodides, and partial reduction of the carbonyl group.27 The reaction scheme is summarized in Figure 6.
Figure 6.
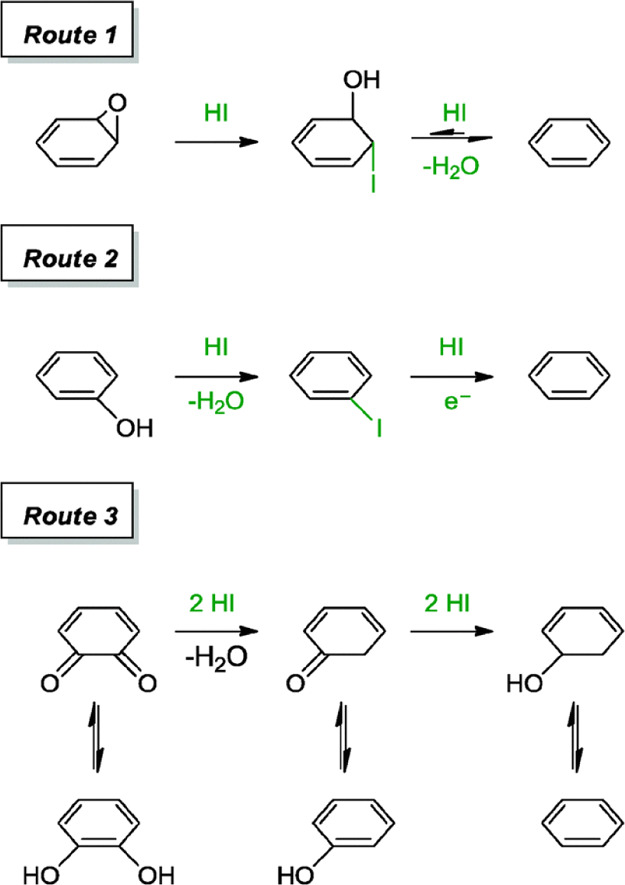
Suggested reaction mechanism of oxygen containing groups with HI. Reproduced from ref (31) with permission from The Royal Society of Chemistry.
For instance, we observe that in our GO samples, the abundance of epoxy and hydroxyl functional groups is approximately 23%, while the concentration of all the remaining carbon-oxidized components amounts to ∼12.5%. As a matter of fact, this well compares with the abundance of oxygen after HI reduction demonstrating the halide acid efficiency in removing the epoxy and hydroxyl functional groups.
Figure 7A displays the evolution of the normalized Raman spectra upon changing the concentration of the HI acid. In the Raman spectra, the 2D features at about 2700 cm–1 are hardly visible at all the HI concentrations. For each HI concentration, the Raman spectra are dominated by the D band at ∼1330 cm–1. Figure 7B represents an expanded view of the D and G bands in the range 1100–1800 cm–1, which are normalized to a common height to better appreciate the line shape changes. It can be seen that increasing the HI concentration in the reducing process, the intensity of the peak at ∼1600 cm–1 decreases. In addition, there are opposite trends for the widths of the two main peaks, the first decreases with increasing HI concentration while the second at a higher Raman shift increases revealing the coexistence of the two contributions deriving from the G and D′ features.
Figure 7.
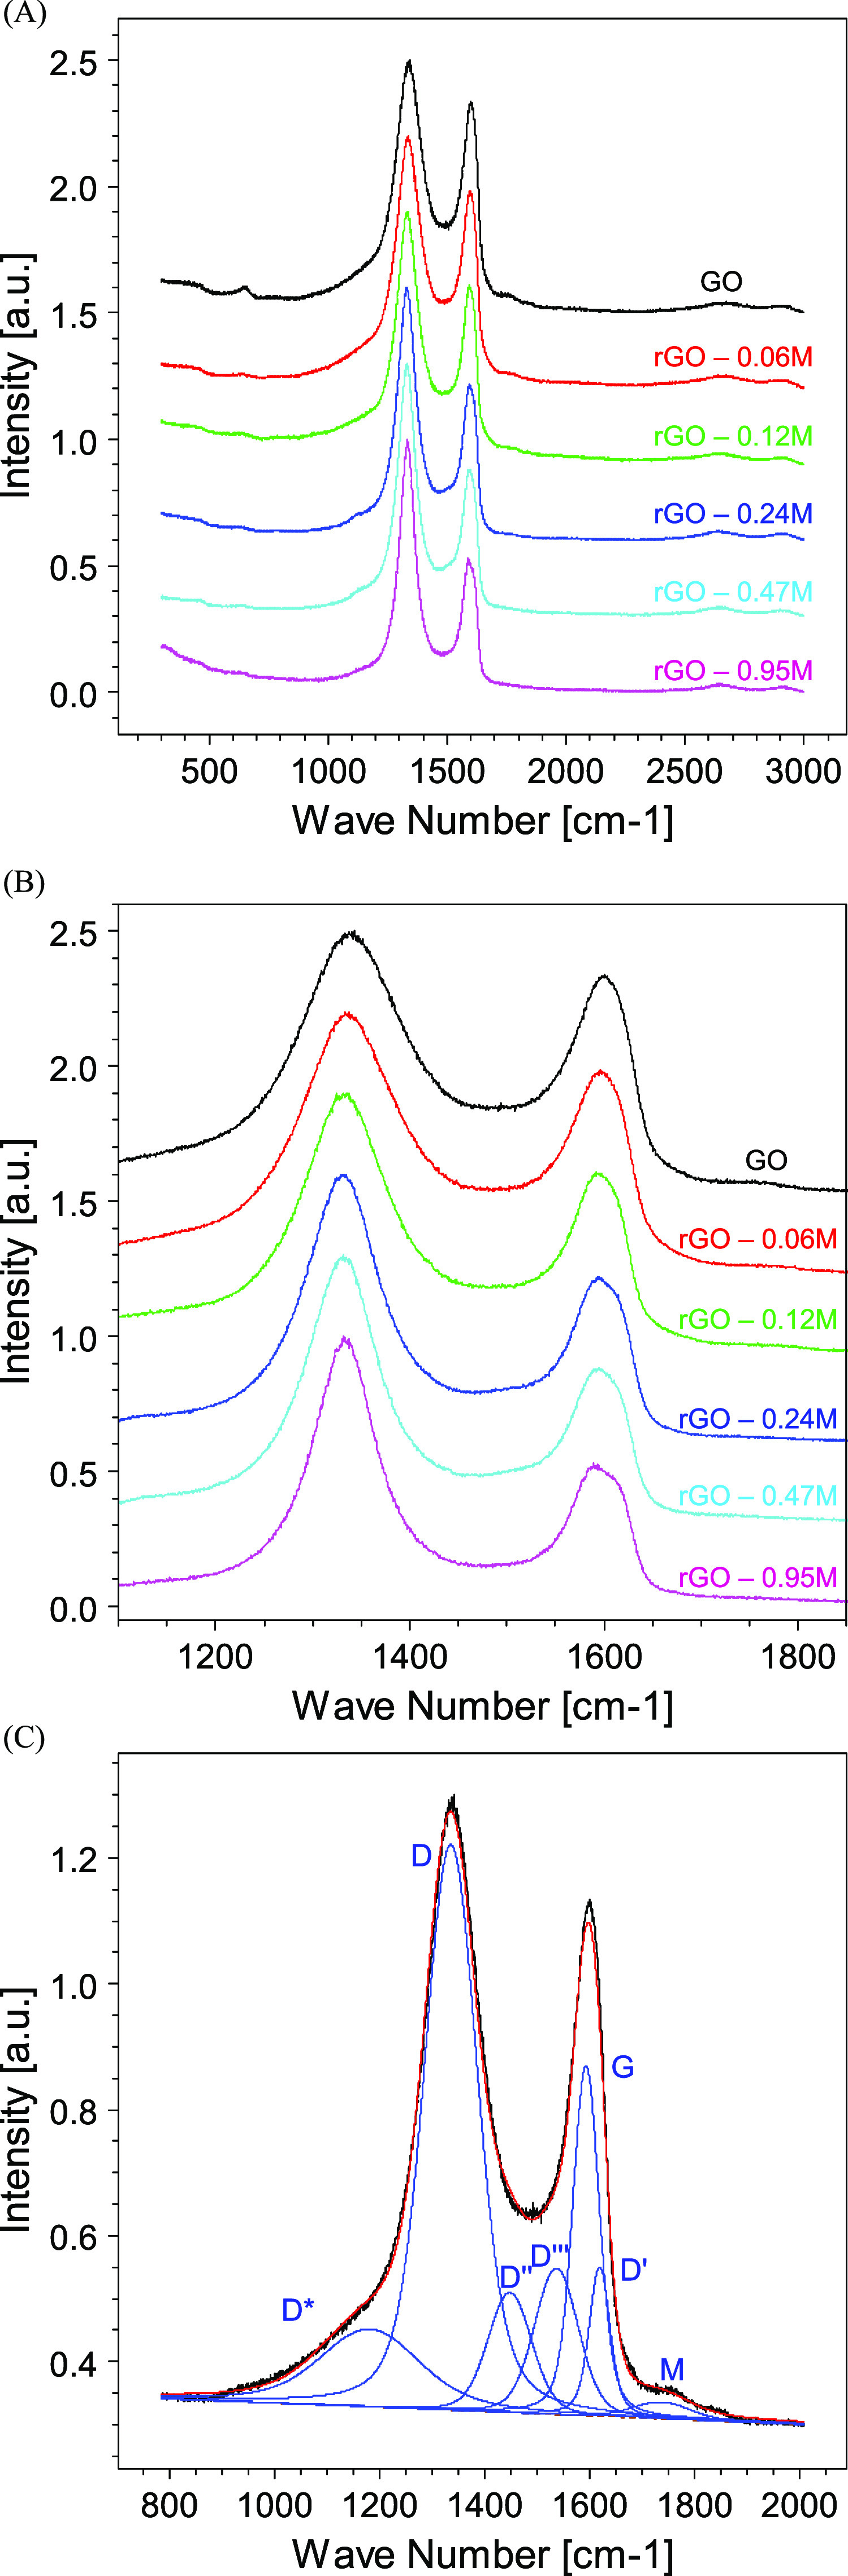
(A) Raman spectra of GO and rGO reduced with different HI concentrations. (B) Zoomed view of the D and G band evolution as a function of the HI concentration, (C) example of the Raman band fitting together with the fit component assignment.
The Raman peaks were fitted following the procedures reported in the literature.55,56 In the present peak-fitting, we used two components D″ and D‴ between the D and G bands to achieve a best-fit of the Raman spectrum. Figure 7C shows an example of the Raman best fit corresponding to the GO spectrum while the trend of the peak intensities as a function of the HI concentration is depicted in Figure 8. To compare the bands deriving from the various Raman spectral fitting, all the intensity values were normalized for the total intensity of the parent Raman spectrum (i.e., I(x) = I0(x)/Itot, where I0(x) is the original spectral intensity of the fit component x, while Itot is the total spectral intensity of the seven components).
Figure 8.

Trend of (A) D band; (B) G band, (C) D′ band; (D) D″ + D‴ bands; (E) M band, and finally (F) I(D)/I(G) ratio as a function of the HI concentration used in the GO reduction process.
The interpretation of the main Raman components is well described in the literature. The D* component at ∼1200 cm–1 was related to the formation of a disordered graphitic lattice by sp2–sp3 bonds.57 As reported in Figure 8, this component decreases with increasing reduction of the GO testifying the reconstruction of an ordered graphitic layer by removing the sp3-induced oxygen bonds. The trend of the D* band is in excellent agreement with the trend of the oxygen.
The D band in our spectra is centered at 1333 cm–1. The D band is associated with an A1g breathing mode at the Brillouin zone symmetry point K. The intensity of this structure is correlated with the number of defects in the graphene plane.58 It increases with increasing reduction process reaching a plateau at the higher HI concentrations. Likely, the removal of the oxygen bonds leads to the formation of defects, which are not fully compensated by the reconstruction of the graphitic layer (as it appears from Figure 7, the spectral power of the D band is much more intense with respect to that of the G band).
The components 3 and 4 are assigned to D″ and D‴ at ∼1450 and 1535 cm–1, respectively. These fit components have been correlated with the presence of oxygen56 and the degree of crystallinity.57,59 The trend of the sum (D″ + D‴) is in agreement with that of D* and with the XPS results. In addition, the decreasing intensity of these components is attributed to the decreasing FWHM of the D and G bands.
The component 5 is assigned to the G band describing the first-order E2g optical mode of the carbon–carbon double bond of the graphite plane.60,61 As shown in Figure 8, the spectral intensity of this band increases as the HI molar concentration increases. As expected, the reduction process increases the spectral power of the component describing the C=C graphitic component. The position of the G band is sensitive to the presence of oxidized carbon atoms. In agreement with the literature,62 the position of the G band shifts to higher frequencies in the presence of a high degree of graphene oxidation as it occurs in GO. Upon reduction, the position of the G band shifts back to lower frequencies as summarized in Table 2.
Table 2. Position and FWHM of the G Band as a Function of the Hi Concentration.
| HI conc. (M) | G position (cm–1) | I(D)/I(G) | FWHM (cm–1) | |
|---|---|---|---|---|
| GO | 0 | 1594 | 3.18 | 20.5 |
| rGO | 0.06 M | 1590.6 | 3.35 | 20.6 |
| rGO | 0.12 M | 1590.3 | 3.56 | 19.4 |
| rGO | 0.24 M | 1589.7 | 3.73 | 18.1 |
| rGO | 0.47 M | 1588.5 | 3.68 | 17.8 |
| rGO | 0.95 M | 1586.6 | 3.61 | 16.0 |
The component 6 represents the D′ band at ∼1610 cm–1, which is assigned to the intravalley double resonance process and appears in the Raman spectra of the defected materials.63 As occurs for the D band, the intensity of D′ is associated with the degree of disorder which increases with the reduction process. Finally, at ∼1710 cm–1, a weak oscillation peak assigned to the M band is found. This feature is attributed to an intravalley resonant scattering process originating from the combination of the out-of-plane layer-breathing mode and the in-plane longitudinal optical mode.64,65 The fit component is very weak and it disappears in the Raman spectra of the samples treated with the higher HI concentrations.
In Figure 8, the trend of the I(D)/I(G) ratio is reported. In the first stage of the reduction process, because of the creation of defects, vacancies, and change of bond hybridization the disorder is prevalent with respect to the production of reduced carbon atoms. In the second stage, the ratio reaches a plateau. Also, this trend is in agreement with the reduction of the oxygen concentration displayed in Figure 5, which flattens at the higher HI concentrations and also with the trend of the D* and D bands.
To further characterize the GO and of the rGO samples, XRD was performed. The results are summarized in Figure 9. As it clearly appears, the GO sample reproduces the canonical XRD spectrum of GO in agreement with recent literature.66,67 The peak at around 2θ = 10° corresponds to an interlayer spacing of about 0.8 nm. In graphite, the (002) diffraction peak occurs at around 2θ = 26.4° corresponding to a lattice spacing of 3.34 nm. The increase of the interlayer spacing is because of the intercalation of the oxygen-containing functional groups as reported in the literature.68,69 With increasing degree of reduction, this peak disappears. On the contrary, some features appear around 2θ = 24.5° corresponding to a d-spacing of about 0.36 nm. The reduction of the interlayer distance from GO to rGO testifies the removal of the oxygen functional groups in agreement with the Raman and XPS results. The reduction process then leads to a partial reconstruction of graphitic domains. However, the feature is rather broad mirroring the small dimensions of these domains. The increased graphitization of the GO patches appears clearly in Figure 10. Initially, the high polarity of the GO particulate renders the GO sheets easily dispersible in water. This property is progressively lost by removing the oxygen from the GO layers. This causes a gradual instability of the rGO dispersion with increasing aggregation caused by van der Waals and π–π stacking forces. After 24 h from the reduction, the GO suspension is stable while the rGO forms clusters and, at a higher degree of reduction, forms a hydrogel.
Figure 9.

XRD patterns of GO and rGO reduced with different HI concentrations.
Figure 10.
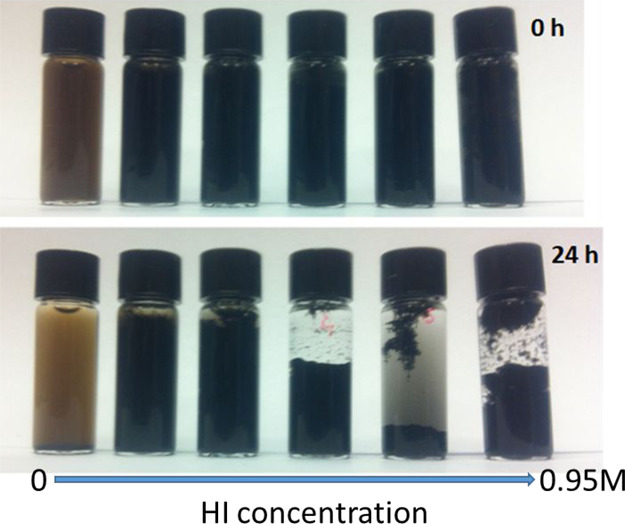
Suspension stability of GO and rGO reduced with different HI concentrations.
The conductivity in the graphene sheets depends on the transport properties of the electron charge.70 This phenomenon, in turn, is affected by structural defects, functionality, and layer disorder. Despite the presence of oxygen limiting the electron mobility, rGO displays a conductive character. Different factors have been proposed to explain the rGO conductivity:32 (i) percolation mechanisms across particle interfaces; (ii) conduction through the conductive network; and (iii) conduction due to ionic channels, which can explain the dependence of rGO conductivity on temperature and humidity. Because of the high polarity of the GO surface, the last mechanism is on the basis of its conductivity. The dependence of the conductivity by defects and the presence of oxygen allowed us to further characterize the extent of reduction at increasing levels of HI. The bulk resistance of the free-standing GO and rGO films measured using a multimeter is plotted in Figure 11. With the increase of the HI concentration used for GO reduction, the bulk resistance of the rGO film decreased quickly. The resistance of GO is 14.8 ± 1.8 MΩ, while that of rGO-0.95 M is 92 ± 1 Ω. This result illustrates that it is possible to control the electrical properties of rGO to suit different applications, for example, flexible electronic circuits for electronic devices or low coat insulating layers for silicon solar cells.
Figure 11.

Bulk resistance of the free-standing film prepared with GO and rGO reduced with different HI concentrations. Error bars are also indicated for each of the measurements.
3. Conclusions
In this work, hydroiodic acid was utilized as the reduction agent to remove oxygen from GO sheets. GO chemical processing was carried out with increasing concentrations of HI to understand the extent of the reduction. The characterization techniques show that initially the reduction process proceeds efficiently. Then, when the residual oxygen abundance lowers, removing oxygen atoms becomes more difficult. Also, increasing the HI concentration, the reduction efficiency strongly decreases and an oxygen concentration of about 10% is obtained. In agreement with this evidence, the TGA displays a decreasing amount of weight in the reduced GO samples while, in the UV−vis spectra, a red-shift of the absorption peak is observed. Moreover, the Raman spectra show an increasing graphitization of the material which agrees with the XRD analyses. We demonstrated that HI is an efficient reducing agent enabling a fine control over the degree of reduction by simply varying its concentration and the residual oxygen concentration. This was confirmed by bulk resistance measurements, which indicated that the bulk resistance of the rGO film can be adjusted in the range of 14.8 MΩ to 92 Ω.
Reduction of the resistivity opens important perspectives for the use of rGO as a transparent electrode for photovoltaics.71 Then, upon decreasing the oxygen content, the material’s properties can be reshaped. Upon reduction, the bandgap of pristine GO ∼2.2 eV, may be decreased leading to semiconducting material properties facilitating its applications in electronics,72,73 also the possibility of rGO doping can also be considered74,75for sensing75optics applications.76In addition, reduction of the oxygen concentration to the desired concentration not only eliminates the oxidative stress induced by GO on living cells but promotes the cell growth,77while maintaining the possibility to functionalize the material.78This indicates that the capability to thinly control the reduction of GO is important in all the various applications where the oxygen content play an important role.
4. Experimental Section
4.1. Chemicals
GO water suspension of 4 mg mL–1 was purchased from Graphenea. Its monolayer content exceeds 95% at a concentration of 0.5 mg mL–1. HI acid (57 wt %, 99.999%) and absolute ethanol (99.5%) were purchased from Aldrich and Merck, respectively. Milli-Q water was used for the experiments.
4.2. Reduction of Graphene Oxide
The reduction of GO using HI as the reductant was performed in an aqueous solution. In a typical synthesis, 10 mL 4 mg mL–1 GO solution was diluted into 0.8 mg mL–1 using Milli-Q water under ultrasonication for 5 min in a 250 mL round bottom flask. Then, 50 mL HI aqueous solution at different molar concentrations X (X = 0.06, 0.12, 0.24, 0.47, and 0.95 M) was added into the GO solution and mixed thoroughly under ultrasonication for another 5 min. The flask containing above mixture was heated to 90 °C in an oil bath and kept at this temperature to carry out the reduction reaction under vigorous stirring. After 4 h reaction, the resulting mixture was cooled down using an ice bath and the rGO product was collected by vacuum filtration using a cellulose filtration paper. After washing with Milli-Q water and absolute ethanol alternatively several times, the rGO powder was dried under vacuum overnight. Samples were denoted as rGO-X (X is the molar concentration of HI for GO reduction).
4.3. Preparation of GO and rGO Films
GO and rGO films were prepared using the reported vacuum filtration method with some modifications.35 In order to disperse both GO and rGO, water–ethanol solution of 10 mL with a volume ratio of 1:1 was used to disperse 4 mg each sample under ultrasonication. Then solution was filtered through a polycarbonate membrane (nucleopore track-etch membrane, Whatman) with a diameter of 25 mm and a pore channel size of 0.8 μm. The polycarbonate membrane was used as received. The GO/rGO dispersions in water/ethanol solution were slowly filtered through the membrane under vacuum. Continuous films were obtained for both GO and rGO thanks to the hydrophilic groups of the filtration membrane, which prevent cracking of film into flakes. The obtained membrane has a diameter of 17.2 mm and a thickness of 19 ± 2 μm. The GO and rGO films were then dried for carrying out further test.
4.4. Characterization and Tests
X-ray diffraction (XRD) patterns of GO and rGO were measured on an APD 2000 powder diffractometer from GNR-Analytical Instruments Group with monochromated Cu Kα radiation (λ = 1.541 Å) operated at 40 kV and 30 mA. The scan range of the diffraction angle was set to a range of 5 to 40° with a step size of 0.02° and 5 s per step. Interlayer spacing of GO and rGO was calculated using Bragg’s law: λ = 2d sin(θ), where λ is X-ray wavelength, d is the interlayer spacing of GO or rGO, and θ is the diffraction angle.
TGA–DSC analysis was simultaneously carried out on a Mettler Toledo TGA–DSC 2 system controlled using a STARe software program. The powder sample in an alumina crucible was heated from room temperature to 800 °C at a ramp of 10 °C min–1 under a flow of argon gas. Changes in sample mass and heat flow along with temperature increase were monitored using STARe software.
X-ray photoelectron spectra (XPS) were recorded using a Kratos Axis Ultra DLD spectrometer equipped with a 150 W monochromated Al Kα excitation source (1486.6 eV). GO and rGO samples were attached on the XPS sample holder using a conductive double-side adhesive tape. Prior to the measurement, samples were degassed under high vacuum overnight. A pass energy of 160 and 20 eV was used for obtaining wide survey spectra and high-resolution core-line spectra, respectively. The obtained spectra were analyzed using home-made RxpsG software based on R platform.79
Optical absorbance measurements of GO and rGO were performed on a JASCO V-670 Ultraviolet–visible–near infrared (UV–vis–NIR) spectrometer. 0.05 mg mL–1 of GO or rGO solution for the measurement was prepared by dispersing the powder sample in ethanol under ultrasonication. The spectra were scanned from 800 to 200 nm using a quartz cuvette with an optical path of 10 mm.
Raman spectra were collected on a Labram Aramis microRaman system from HORIBA Jobin Yvon. An excitation wavelength of 632.8 nm from the He–Ne source was used and the spectra were scanned from 300 to 3000 cm–1. Raman samples were prepared by pressing GO or rGO powder on a microscope slide. The Raman spectra were fitted using linear background subtraction and Voigt functions.
Electrical resistance of the prepared free-standing GO and rGO films was measured using an Avidsen 107100 multimeter under ambient conditions. During the measurement, the two probes of the multimeter were put on the edges of the film along the diameter line of the film. For each film, three values were obtained at different points to get an average value.w.liu@unsw.edu.au
Acknowledgments
The authors are grateful to Fondazione Bruno Kessler for providing support to their research.
Supporting Information Available
The Supporting Information is available free of charge at https://pubs.acs.org/doi/10.1021/acsomega.0c05578.
XPS O 1s and C 1s spectra of the pristine GO and of graphene reduced with the increasing HI concentrations and examples of O 1s and C 1s peak-fitting (PDF)
The authors declare no competing financial interest.
Supplementary Material
References
- Allen M. J.; Tung V. C.; Kaner R. B. Honeycomb Carbon: A Review of Graphene. Chem. Rev. 2010, 110, 132–145. 10.1021/cr900070d. [DOI] [PubMed] [Google Scholar]
- Torrisi F.; Hasan T.; Wu W.; Sun Z.; Lombardo A.; Kulmala T. S.; Hsieh G.-W.; Jung S.; Bonaccorso F.; Paul P. J.; Chu D.; Ferrari A. C. Inkjet-Printed Graphene Electronics. ACS Nano 2012, 6, 2992–3006. 10.1021/nn2044609. [DOI] [PubMed] [Google Scholar]
- Choi H.-J.; Jung S.-M.; Seo J.-M.; Chang D. W.; Dai L.; Baek J.-B. Graphene for energy conversion and storage in fuel cells and supercapacitors. Nano Energy 2012, 1, 534–551. 10.1016/j.nanoen.2012.05.001. [DOI] [Google Scholar]
- Nag A.; Mitra A.; Mukhopadhyay S. C. Graphene and its sensor-based applications: A review. Sens. Actuators, A 2018, 270, 177–194. 10.1016/j.sna.2017.12.028. [DOI] [Google Scholar]
- Priyadarsini S.; Mohanty S.; Mukherjee S.; Basu S.; Mishra M. Graphene and graphene oxide as nanomaterials for medicine and biology application. J. Nanostruct. Chem. 2018, 8, 123–137. 10.1007/s40097-018-0265-6. [DOI] [Google Scholar]
- Hu M.; Yao Z.; Wang X. Graphene-Based Nanomaterials for Catalysis. Ind. Eng. Chem. Res. 2017, 56, 3477–3502. 10.1021/acs.iecr.6b05048. [DOI] [Google Scholar]
- Li X.; Cai W.; An J.; Kim S.; Nah J.; Yang D.; Piner R.; Velamakanni A.; Jung I.; Tutuc E.; Banerjee S. K.; Colombo L.; Ruoff R. S. Large-Area Synthesis of High-Quality and Uniform Graphene Films on Copper Foils. Science 2009, 324, 1312–1314. 10.1126/science.1171245. [DOI] [PubMed] [Google Scholar]
- Edwards R. S.; Coleman K. S. Graphene synthesis: relationship to applications. Nanoscale 2013, 5, 38–51. 10.1039/c2nr32629a. [DOI] [PubMed] [Google Scholar]
- Hummers W. S.; Offeman R. E. Preparation of Graphitic Oxide. J. Am. Chem. Soc. 1958, 80, 1339. 10.1021/ja01539a017. [DOI] [Google Scholar]
- Dreyer D. R.; Park S.; Bielawski C. W.; Ruoff R. S. The chemistry of graphene oxide. Chem. Soc. Rev. 2010, 39, 228–240. 10.1039/b917103g. [DOI] [PubMed] [Google Scholar]
- Park S.; Ruoff R. S. Chemical methods for the production of graphenes. Nat. Nanotechnol. 2009, 4, 217. 10.1038/nnano.2009.58. [DOI] [PubMed] [Google Scholar]
- Chen D.; Feng H.; Li J. Graphene Oxide: Preparation, Functionalization, and Electrochemical Applications. Chem. Rev. 2012, 112, 6027–6053. 10.1021/cr300115g. [DOI] [PubMed] [Google Scholar]
- Ćirić L.; Sienkiewicz A.; Gaál R.; Jaćimović J.; Vâju C.; Magrez A.; Forró L. Defects and localization in chemically-derived graphene. Phys. Rev. B: Condens. Matter Mater. Phys. 2012, 86, 195139. 10.1103/PhysRevB.86.195139. [DOI] [Google Scholar]
- Zhang H.; Hines D.; Akins D. L. Synthesis of a nanocomposite composed of reduced graphene oxide and gold nanoparticles. Dalton Trans. 2014, 43, 2670–2675. 10.1039/c3dt52573b. [DOI] [PubMed] [Google Scholar]
- Xu C.; Wang X.; Zhu J. Graphene–Metal Particle Nanocomposites. J. Phys. Chem. C 2008, 112, 19841–19845. 10.1021/jp807989b. [DOI] [Google Scholar]
- Wang L.; Yang Z.; Cui Y.; Wei B.; Xu S.; Sheng J.; Wang M.; Zhu Y.; Fei W. Graphene-copper composite with micro-layered grains and ultrahigh strength. Sci. Rep. 2017, 7, 41896. 10.1038/srep41896. [DOI] [PMC free article] [PubMed] [Google Scholar]
- Wang J.; Deng Q.; Li M.; Jiang K.; Zhang J.; Hu Z.; Chu J. Copper ferrites@reduced graphene oxide anode materials for advanced lithium storage applications. Sci. Rep. 2017, 7, 8903. 10.1038/s41598-017-09214-0. [DOI] [PMC free article] [PubMed] [Google Scholar]
- Zubir N. A.; Yacou C.; Motuzas J.; Zhang X.; Diniz da Costa J. C. Structural and functional investigation of graphene oxide–Fe3O4 nanocomposites for the heterogeneous Fenton-like reaction. Sci. Rep. 2014, 4, 4594. 10.1038/srep04594. [DOI] [PMC free article] [PubMed] [Google Scholar]
- Zhu X.; Dai H.; Hu J.; Ding L.; Jiang L. Reduced graphene oxide–nickel oxide composite as high performance electrode materials for supercapacitors. J. Power Sources 2012, 203, 243–249. 10.1016/j.jpowsour.2011.11.055. [DOI] [Google Scholar]
- Li M.; Cheng J. P.; Wang J.; Liu F.; Zhang X. B. The growth of nickel-manganese and cobalt-manganese layered double hydroxides on reduced graphene oxide for supercapacitor. Electrochim. Acta 2016, 206, 108–115. 10.1016/j.electacta.2016.04.084. [DOI] [Google Scholar]
- Wang J.; Xu Y.; Zhu J.; Ren P. Electrochemical in situ polymerization of reduced graphene oxide/polypyrrole composite with high power density. J. Power Sources 2012, 208, 138–143. 10.1016/j.jpowsour.2012.02.018. [DOI] [Google Scholar]
- Travlou N. A.; Kyzas G. Z.; Lazaridis N. K.; Deliyanni E. A. Functionalization of Graphite Oxide with Magnetic Chitosan for the Preparation of a Nanocomposite Dye Adsorbent. Langmuir 2013, 29, 1657–1668. 10.1021/la304696y. [DOI] [PubMed] [Google Scholar]
- Li X.; Wang H.; Robinson J. T.; Sanchez H.; Diankov G.; Dai H. Simultaneous Nitrogen Doping and Reduction of Graphene Oxide. J. Am. Chem. Soc. 2009, 131, 15939–15944. 10.1021/ja907098f. [DOI] [PubMed] [Google Scholar]
- Zhang C.; Lv W.; Zhang W.; Zheng X.; Wu M.-B.; Wei W.; Tao Y.; Li Z.; Yang Q.-H. Reduction of Graphene Oxide by Hydrogen Sulfide: A Promising Strategy for Pollutant Control and as an Electrode for Li-S Batteries. Adv. Energy Mater. 2014, 4, 1301565. 10.1002/aenm.201301565. [DOI] [Google Scholar]
- Park S.; An J.; Potts J. R.; Velamakanni A.; Murali S.; Ruoff R. S. Hydrazine-reduction of graphite- and graphene oxide. Carbon 2011, 49, 3019–3023. 10.1016/j.carbon.2011.02.071. [DOI] [Google Scholar]
- Shin H. J.; Kim K. K.; Benayad A.; Yoon S. M.; Park H. K.; Jung I. S.; Jin M. H.; Jeong H. K.; Kim J. M.; Choi J. Y.; Lee Y. H. Efficient Reduction of Graphite Oxide by Sodium Borohydride and Its Effect on Electrical Conductance. Adv. Funct. Mater. 2009, 19, 1987–1992. 10.1002/adfm.200900167. [DOI] [Google Scholar]
- Moon I. K.; Lee J.; Ruoff R. S.; Lee H. Reduced graphene oxide by chemical graphitization. Nat. Commun. 2010, 1, 73. 10.1038/ncomms1067. [DOI] [PubMed] [Google Scholar]
- Liu C.; Hao F.; Zhao X.; Zhao Q.; Luo S.; Lin H. Low temperature reduction of free-standing graphene oxide papers with metal iodides for ultrahigh bulk conductivity. Sci. Rep. 2014, 4, 3965. 10.1038/srep03965. [DOI] [PMC free article] [PubMed] [Google Scholar]
- Zhang J.; Yang H.; Shen G.; Cheng P.; Zhang J.; Guo S. Reduction of graphene oxide vial-ascorbic acid. Chem. Commun. 2010, 46, 1112–1114. 10.1039/b917705a. [DOI] [PubMed] [Google Scholar]
- Chen D.; Li L.; Guo L. An environment-friendly preparation of reduced graphene oxide nanosheets via amino acid. Nanotechnology 2011, 22, 325601. 10.1088/0957-4484/22/32/325601. [DOI] [PubMed] [Google Scholar]
- Chua C. K.; Pumera M. Chemical reduction of graphene oxide: a synthetic chemistry viewpoint. Chem. Soc. Rev. 2014, 43, 291–312. 10.1039/c3cs60303b. [DOI] [PubMed] [Google Scholar]
- Stankovich S.; Dikin D. A.; Piner R. D.; Kohlhaas K. A.; Kleinhammes A.; Jia Y.; Wu Y.; Nguyen S. T.; Ruoff R. S. Synthesis of graphene-based nanosheets via chemical reduction of exfoliated graphite oxide. Carbon 2007, 45, 1558–1565. 10.1016/j.carbon.2007.02.034. [DOI] [Google Scholar]
- Park S.; Hu Y.; Hwang J. O.; Lee E.-S.; Casabianca L. B.; Cai W.; Potts J. R.; Ha H.-W.; Chen S.; Oh J.; Kim S. O.; Kim Y.-H.; Ishii Y.; Ruoff R. S. Chemical structures of hydrazine-treated graphene oxide and generation of aromatic nitrogen doping. Nat. Commun. 2012, 3, 638. 10.1038/ncomms1643. [DOI] [PubMed] [Google Scholar]
- Ambrosi A.; Chua C. K.; Latiff N. M.; Loo A. H.; Wong C. H. A.; Eng A. Y. S.; Bonanni A.; Pumera M. Graphene and its electrochemistry–an update. Chem. Soc. Rev. 2016, 45, 2458–2493. 10.1039/c6cs00136j. [DOI] [PubMed] [Google Scholar]
- Guex L. G.; Sacchi B.; Peuvot K. F.; Andersson R. L.; Pourrahimi A. M.; Ström V.; Farris S.; Olsson R. T. Experimental review: chemical reduction of graphene oxide (GO) to reduced graphene oxide (rGO) by aqueous chemistry. Nanoscale 2017, 9, 9562–9571. 10.1039/c7nr02943h. [DOI] [PubMed] [Google Scholar]
- Tas M.; Altin Y.; Celik Bedeloglu A. Reduction of graphene oxide thin films using a stepwise thermal annealing assisted by l-ascorbic acid. Diamond Relat. Mater. 2019, 92, 242–247. 10.1016/j.diamond.2019.01.009. [DOI] [Google Scholar]
- Becerra-Paniagua D. K.; Cabrera-German D.; Díaz-Cruz E. B.; Montiel-González Z.; Sotelo-Lerma M.; Hu H. Dispersion degree and sheet spacing control of graphene products via oxygen functionalities and its effect on electrical conductivities of P3HT-graphene composite coatings. J. Mater. Sci.: Mater. Electron. 2020, 31, 19623–19637. 10.1007/s10854-020-04489-y. [DOI] [Google Scholar]
- Pei S.; Zhao J.; Du J.; Ren W.; Cheng H.-M. Direct reduction of graphene oxide films into highly conductive and flexible graphene films by hydrohalic acids. Carbon 2010, 48, 4466–4474. 10.1016/j.carbon.2010.08.006. [DOI] [Google Scholar]
- Chu J. H.; Kwak J.; Kim S.-D.; Lee M. J.; Kim J. J.; Park S.-D.; Choi J.-K.; Ryu G. H.; Park K.; Kim S. Y.; Kim J. H.; Lee Z.; Kim Y.-W.; Kwon S.-Y. Monolithic graphene oxide sheets with controllable composition. Nat. Commun. 2014, 5, 3383. 10.1038/ncomms4383. [DOI] [PubMed] [Google Scholar]
- Ahlberg P.; Hinnemo M.; Song M.; Gao X.; Olsson J.; Zhang S.-L.; Zhang Z.-B. A two-in-one process for reliable graphene transistors processed with photo-lithography. Appl. Phys. Lett. 2015, 107, 203104. 10.1063/1.4935985. [DOI] [Google Scholar]
- Abdolhosseinzadeh S.; Asgharzadeh H.; Seop Kim H. Fast and fully-scalable synthesis of reduced graphene oxide. Sci. Rep. 2015, 5, 10160. 10.1038/srep10160. [DOI] [PMC free article] [PubMed] [Google Scholar]
- Marcano D. C.; Kosynkin D. V.; Berlin J. M.; Sinitskii A.; Sun Z.; Slesarev A.; Alemany L. B.; Lu W.; Tour J. M. Improved Synthesis of Graphene Oxide. ACS Nano 2010, 4, 4806–4814. 10.1021/nn1006368. [DOI] [PubMed] [Google Scholar]
- Shen J.; Hu Y.; Shi M.; Lu X.; Qin C.; Li C.; Ye M. Fast and Facile Preparation of Graphene Oxide and Reduced Graphene Oxide Nanoplatelets. Chem. Mater. 2009, 21, 3514–3520. 10.1021/cm901247t. [DOI] [Google Scholar]
- Qiu Y.; Collin F.; Hurt R. H.; Külaots I. Thermochemistry and kinetics of graphite oxide exothermic decomposition for safety in large-scale storage and processing. Carbon 2016, 96, 20–28. 10.1016/j.carbon.2015.09.040. [DOI] [PMC free article] [PubMed] [Google Scholar]
- Md Said N. H.; Liu W.-W.; Lai C.-w.; Noriman N. Z.; Khe C.-S.; Hashim U.; Lee H. C. Comparison on graphite, graphene oxide and reduced graphene oxide: Synthesis and characterization. AIP Conf. Proc. 2017, 1892, 150002. 10.1063/1.5005764. [DOI] [Google Scholar]
- Abid; Sehrawat P.; Islam S. S.; Mishra P.; Ahmad S. Reduced graphene oxide (rGO) based wideband optical sensor and the role of Temperature, Defect States and Quantum Efficiency. Sci. Rep. 2018, 8, 3537. 10.1038/s41598-018-21686-2. [DOI] [PMC free article] [PubMed] [Google Scholar]
- Rabchinskii M. K.; Shnitov V. V.; Dideikin A. T.; Aleksenskii A. E.; Vul’ S. P.; Baidakova M. V.; Pronin I. I.; Kirilenko D. A.; Brunkov P. N.; Weise J.; Molodtsov S. L. Nanoscale Perforation of Graphene Oxide during Photoreduction Process in the Argon Atmosphere. J. Phys. Chem. C 2016, 120, 28261–28269. 10.1021/acs.jpcc.6b08758. [DOI] [Google Scholar]
- Eda G.; Lin Y.-Y.; Mattevi C.; Yamaguchi H.; Chen H.-A.; Chen I.-S.; Chen C.-W.; Chhowalla M. Blue Photoluminescence from Chemically Derived Graphene Oxide. Adv. Mater. 2010, 22, 505–509. 10.1002/adma.200901996. [DOI] [PubMed] [Google Scholar]
- Yan J.-A.; Xian L.; Chou M. Y. Structural and Electronic Properties of Oxidized Graphene. Phys. Rev. Lett. 2009, 103, 086802. 10.1103/physrevlett.103.086802. [DOI] [PubMed] [Google Scholar]
- Li D.; Müller M. B.; Gilje S.; Kaner R. B.; Wallace G. G. Processable aqueous dispersions of graphene nanosheets. Nat. Nanotechnol. 2008, 3, 101–105. 10.1038/nnano.2007.451. [DOI] [PubMed] [Google Scholar]
- Muzyka R.; Drewniak S.; Pustelny T.; Chrubasik M.; Gryglewicz G. Characterization of Graphite Oxide and Reduced Graphene Oxide Obtained from Different Graphite Precursors and Oxidized by Different Methods Using Raman Spectroscopy. Materials 2018, 11, 1050. 10.3390/ma11071050. [DOI] [PMC free article] [PubMed] [Google Scholar]
- Rabchinskii M. K.; Dideikin A. T.; Kirilenko D. A.; Baidakova M. V.; Shnitov V. V.; Roth F.; Konyakhin S. V.; Besedina N. A.; Pavlov S. I.; Kuricyn R. A.; Lebedeva N. M.; Brunkov P. N.; Vul’ A. Y. Facile reduction of graphene oxide suspensions and films using glass wafers. Sci. Rep. 2018, 8, 14154. 10.1038/s41598-018-32488-x. [DOI] [PMC free article] [PubMed] [Google Scholar]
- Koinuma M.; Tateishi H.; Hatakeyama K.; Miyamoto S.; Ogata C.; Funatsu A.; Taniguchi T.; Matsumoto Y. Analysis of Reduced Graphene Oxides by X-ray Photoelectron Spectroscopy and Electrochemical Capacitance. Chem. Lett. 2013, 42, 924–926. 10.1246/cl.130152. [DOI] [Google Scholar]
- Chiu N.-F.; Yang C.-D.; Chen C.-C.; Kuo C.-T. Stepwise control of reduction of graphene oxide and quantitative real-time evaluation of residual oxygen content using EC-SPR for a label-free electrochemical immunosensor. Sens. Actuators, B 2018, 258, 981–990. 10.1016/j.snb.2017.11.187. [DOI] [Google Scholar]
- Ma B.; Rodriguez R. D.; Ruban A.; Pavlov S.; Sheremet E. The correlation between electrical conductivity and second-order Raman modes of laser-reduced graphene oxide. Phys. Chem. Chem. Phys. 2019, 21, 10125–10134. 10.1039/c9cp00093c. [DOI] [PubMed] [Google Scholar]
- Vecera P.; Chacón-Torres J. C.; Pichler T.; Reich S.; Soni H. R.; Görling A.; Edelthalhammer K.; Peterlik H.; Hauke F.; Hirsch A. Precise determination of graphene functionalization by in situ Raman spectroscopy. Nat. Commun. 2017, 8, 15192. 10.1038/ncomms15192. [DOI] [PMC free article] [PubMed] [Google Scholar] [Retracted]
- Claramunt S.; Varea A.; López-Díaz D.; Velázquez M. M.; Cornet A.; Cirera A. The Importance of Interbands on the Interpretation of the Raman Spectrum of Graphene Oxide. J. Phys. Chem. C 2015, 119, 10123–10129. 10.1021/acs.jpcc.5b01590. [DOI] [Google Scholar]
- Cançado L. G.; Jorio A.; Ferreira E. H. M.; Stavale F.; Achete C. A.; Capaz R. B.; Moutinho M. V. O.; Lombardo A.; Kulmala T. S.; Ferrari A. C. Quantifying Defects in Graphene via Raman Spectroscopy at Different Excitation Energies. Nano Lett. 2011, 11, 3190–3196. 10.1021/nl201432g. [DOI] [PubMed] [Google Scholar]
- López-Díaz D.; López Holgado M.; García-Fierro J. L.; Velázquez M. M. Evolution of the Raman Spectrum with the Chemical Composition of Graphene Oxide. J. Phys. Chem. C 2017, 121, 20489–20497. 10.1021/acs.jpcc.7b06236. [DOI] [Google Scholar]
- Ferrari A. C.; Robertson J.; Reich S.; Thomsen C. Raman spectroscopy of graphite. Philos. Trans. R. Soc., A 2004, 362, 2271–2288. 10.1098/rsta.2004.1452. [DOI] [PubMed] [Google Scholar]
- Martins Ferreira E. H.; Moutinho M. V. O.; Stavale F.; Lucchese M. M.; Capaz R. B.; Achete C. A.; Jorio A. Evolution of the Raman spectra from single-, few-, and many-layer graphene with increasing disorder. Phys. Rev. B: Condens. Matter Mater. Phys. 2010, 82, 125429. 10.1103/physrevb.82.125429. [DOI] [PubMed] [Google Scholar]
- Kudin K. N.; Ozbas B.; Schniepp H. C.; Prud’homme R. K.; Aksay I. A.; Car R. Raman Spectra of Graphite Oxide and Functionalized Graphene Sheets. Nano Lett. 2008, 8, 36–41. 10.1021/nl071822y. [DOI] [PubMed] [Google Scholar]
- Elias D. C.; Nair R. R.; Mohiuddin T. M. G.; Morozov S. V.; Blake P.; Halsall M. P.; Ferrari A. C.; Boukhvalov D. W.; Katsnelson M. I.; Geim A. K.; Novoselov K. S. Control of Graphene’s Properties by Reversible Hydrogenation: Evidence for Graphane. Science 2009, 323, 610–613. 10.1126/science.1167130. [DOI] [PubMed] [Google Scholar]
- Lui C. H.; Malard L. M.; Kim S.; Lantz G.; Laverge F. E.; Saito R.; Heinz T. F. Observation of Layer-Breathing Mode Vibrations in Few-Layer Graphene through Combination Raman Scattering. Nano Lett. 2012, 12, 5539–5544. 10.1021/nl302450s. [DOI] [PubMed] [Google Scholar]
- Jorio A.; Dresselhaus M. S.; Saito R.; Dresselhaus G.. Raman spectroscopy in graphene related systems; John Wiley & Sons, 2011. [Google Scholar]
- Jiao X.; Qiu Y.; Zhang L.; Zhang X. Comparison of the characteristic properties of reduced graphene oxides synthesized from natural graphites with different graphitization degrees. RSC Adv. 2017, 7, 52337–52344. 10.1039/c7ra10809e. [DOI] [Google Scholar]
- Huang H.-H.; De Silva K. K. H.; Kumara G. R. A.; Yoshimura M. Structural Evolution of Hydrothermally Derived Reduced Graphene Oxide. Sci. Rep. 2018, 8, 6849. 10.1038/s41598-018-25194-1. [DOI] [PMC free article] [PubMed] [Google Scholar]
- Krishnamoorthy K.; Veerapandian M.; Yun K.; Kim S.-J. The chemical and structural analysis of graphene oxide with different degrees of oxidation. Carbon 2013, 53, 38–49. 10.1016/j.carbon.2012.10.013. [DOI] [Google Scholar]
- Zhuo Q.; Gao J.; Peng M.; Bai L.; Deng J.; Xia Y.; Ma Y.; Zhong J.; Sun X. Large-scale synthesis of graphene by the reduction of graphene oxide at room temperature using metal nanoparticles as catalyst. Carbon 2013, 52, 559–564. 10.1016/j.carbon.2012.10.014. [DOI] [Google Scholar]
- Kaiser A. B.; Gómez-Navarro C.; Sundaram R. S.; Burghard M.; Kern K. Electrical Conduction Mechanism in Chemically Derived Graphene Monolayers. Nano Lett. 2009, 9, 1787–1792. 10.1021/nl803698b. [DOI] [PubMed] [Google Scholar]
- Petridis C.; Konios D.; Stylianakis M. M.; Kakavelakis G.; Sygletou M.; Savva K.; Tzourmpakis P.; Krassas M.; Vaenas N.; Stratakis E.; Kymakis E. Solution processed reduced graphene oxide electrodes for organic photovoltaics. Nanoscale Horiz. 2016, 1, 375–382. 10.1039/c5nh00089k. [DOI] [PubMed] [Google Scholar]
- Tadyszak K.; Chybczyńska K.; Ławniczak P.; Zalewska A.; Cieniek B.; Gonet M.; Murias M. Magnetic and electric properties of partially reduced graphene oxide aerogels. J. Magn. Magn. Mater. 2019, 492, 165656. 10.1016/j.jmmm.2019.165656. [DOI] [Google Scholar]
- Hantel M. M.; Kaspar T.; Nesper R.; Wokaun A.; Kötz R. Partially Reduced Graphene Oxide Paper: A Thin Film Electrode for Electrochemical Capacitors. J. Electrochem. Soc. 2013, 160, A747–A750. 10.1149/2.019306jes. [DOI] [Google Scholar]
- Tadyszak K.; Majchrzycki Ł.; Szyller Ł.; Scheibe B. Preparation and characterization of partially reduced graphene oxide aerogels doped with transition metal ions. J. Mater. Sci. 2018, 53, 16086–16098. 10.1007/s10853-018-2770-x. [DOI] [Google Scholar]
- Tarcan R.; Todor-Boer O.; Petrovai I.; Leordean C.; Astilean S.; Botiz I. Reduced graphene oxide today. J. Mater. Chem. C 2020, 8, 1198–1224. 10.1039/c9tc04916a. [DOI] [Google Scholar]
- Yao B. C.; Wu Y.; Yu C. B.; He J. R.; Rao Y. J.; Gong Y.; Fu F.; Chen Y. F.; Li Y. R. Partially reduced graphene oxide based FRET on fiber-optic interferometer for biochemical detection. Sci. Rep. 2016, 6, 23706. 10.1038/srep23706. [DOI] [PMC free article] [PubMed] [Google Scholar]
- Isseroff R.; Reddy R.; Williams N.; Reyes J.; Marmorat C.; Simon M.; Yang F.; Walker S.; Rafailovich M. The Effects of Graphene Oxide and Partially Reduced Graphene Oxide on Staphylococcus aureus, Dermal Fibroblasts, and Keratinocytes. MRS Adv. 2018, 3, 679–689. 10.1557/adv.2018.243. [DOI] [Google Scholar]
- Elhamid A. E. M. A.; Attiya A. M.; Zahran M. B.. In Different Types of Partially Reduced Graphene Oxide as Mild Heat Sensors for Medical Applications. 2019 6th International Conference on Advanced Control Circuits and Systems (ACCS) & 2019 5th International Conference on New Paradigms in Electronics & information Technology (PEIT), 17-20 Nov. 2019; 2019; pp 161-166.
- Speranza G.; Canteri R. RxpsG a new open project for Photoelectron and Electron Spectroscopy data processing. SoftwareX 2019, 10, 100282. 10.1016/j.softx.2019.100282. [DOI] [Google Scholar]
Associated Data
This section collects any data citations, data availability statements, or supplementary materials included in this article.