

Abstract
The pathogenesis of hypertrophic scar (HS) is still poorly understood. Macrophages, especially the polarisation of that to M1 or M2, play a pivotal role in control of the degree of scar formation. Profiling of macrophage phenotypes in human specimens during long‐term period of wound healing and HS formation may provide valuable clinical evidence for understanding the pathology of human scars. Human wound and HS specimens were collected, the macrophage phenotype was identified by immunofluorescence, and biomarkers and cytokines associated with M1 and M2 macrophages were detected by RT‐PCR. The correlation between the macrophage phenotype and HS characteristics was analysed by linear regression analyses. We found excessive and persistent infiltration by M1 macrophages around the blood vessels in the superficial layer of the dermis at early wound tissues, whereas M2 macrophages predominated in later wound tissues and the proliferative phase of HS and were scattered throughout the dermis. The density of M1 macrophages was positively correlated with mRNA expression levels of tumour necrosis factor‐alpha (TNF‐α) and IL‐6. The density of M2 macrophages was positively correlated with ARG1 and negatively correlated with the duration of HS. The sequential infiltration by M1 macrophage and M2 macrophages in human wound and HS tissues was confirmed.
Keywords: cytokines, hypertrophic scar, macrophage phenotype, wound healing
Abbreviations
- anova
analysis of variance
- ARG1
arginase1
- GAPDH
glyceraldehyde 3‐phosphate dehydrogenase
- HS
hypertrophic scar
- IL‐6
interleukin 6
- NOS2
nitric Oxide Synthase 2
- PBS
phosphate‐buffered saline
- qPCR
quantitative polymerase chain reaction
- TGF‐β1
transforming growth factor‐beta 1
- TNF‐α
tumour necrosis factor‐alpha.
1. INTRODUCTION
A hypertrophic scar (HS) is the most common complication after skin injury. Each year, millions of cases of traumatic injuries give rise to HSs, resulting in disfigurement and dysfunction.1 Patients with these scars often suffer from local itching, pain, dysfunction, restricted movement, and other physical and psychosocial problems. An estimated US$12 billion is spent annually in the United States on treatment for skin scars.2 The immense economic and social impact of HS on society calls for more attention to the understanding of biological mechanisms underlying HS formation.
Wound healing consists pathologically of inflammatory, proliferative, and remodelling phases. When the inflammatory phase persists, HSs form.1 Macrophages play a pivotal role in the transition between the inflammatory and proliferative phases, in which they coordinate and sustain the wound‐healing process3 and ultimately control the degree of scar formation.4 The extent of the inflammatory response is determined in large part by the balance of macrophage polarisation into proinflammatory M1 or anti‐inflammatory M2 macrophages. In addition, HS formation after wounding is a dynamic process, which continues to thicken for up to 1 year, defined as the proliferative phase. The period after the proliferative phase is generally defined as the mature phase. Macrophages exhibit distinct functions during the various phases of skin wound repair. A recent study showed that the depletion of macrophages restricted to the early stage of the repair response resulted in minimised scar formation; in contrast, the depletion of macrophages restricted the consecutive midstage of the repair response and the late stage of repair did not significantly impact the outcome of the repair response.4 Zhu et al found that systemic macrophage depletion in the subacute phase of wound healing reduced scar formation.5 Based on the opposite function of M1 macrophage and M2 macrophage during the wound repair process, this contradiction is because of the fact that the dynamic changes of the macrophage phenotype during HS formation remain elusive. Therefore, further studies aiming to explore the correlation between tissue macrophage phenotypes and pathological significance are imperative.
Most of the previous studies on the involvement of subtypes of macrophages in HS formation are based on animal models (e.g., mice, pigs, and rabbits). However, dermal hypertrophic scarring is commonly seen after human wound healing has completed that is hardly seen in animal wounds.6 It is noted that the differences in the inflammatory responses are thought to lead to different clinical outcomes.7 As macrophages are one of the major players in the regulation of immune responses during skin wound healing,8 there is great interest in the investigation of the functions of this cell type during scar formation. Importantly, some researchers suggested that human macrophages are “fundamentally” distinct from rodent macrophages with regard to nitric oxide synthase (NOS) activity and metabolism of arginine.9 Profiling of macrophage phenotypes in human specimens during long‐term period of HS formation may provide valuable clinical evidence for understanding the pathology of human scars. Therefore, we performed macrophage phenotype detection by in situ double immunofluorescence staining of RBP‐J or CMAF in the context of CD68 for M1 or for M2 macrophage as such combined staining was verified by Barros et al10 to be a suitable tool to characterise the macrophage polarisation in human tissues. Notch signalling determines M1 polarisation and that RBP‐J is a key regulatory transcription factor of this signalling pathway. Notch–RBP‐J signalling controls the expressions of M1 macrophage‐associated genes.11 Moreover, CMAF is an essential transcription factor for M2 macrophage‐associated gene expressions, contributing to macrophage polarisation towards M2 cells.12 In this study, human tissues were timely collected at various wound‐healing process and HS formation stages, and the tissue macrophage M1 or M2 phenotypes were characterised.
2. METHODS
2.1. Patients and skin samples
This study was approved by the Ethics Committee of Xijing Hospital, the Fourth Military Medical University, China. All volunteers and patients agreed to participate in this study, and written informed consent was obtained from all adult subjects. Parents and guardians of participating children had the aims of the research explained to them, and written consent was obtained from guardians on the behalf of the children for collection of samples and subsequent analysis. The study conformed to the ethical guidelines of the 1975 Declaration of Helsinki as reflected in approval by the institution's human research review committee. The Vancouver scar scale (VSS)13 was used to score the hyperplasia severity of the HSs. Table 1 shows the details of the tissue specimens. After wound tissue biopsy, the total 20 wound tissue specimens were divided into four groups according to the injury time (0‐2 days group, 2‐7 days group, 7‐14 days group, and 14‐28 days group). The HS samples with the duration of 1 through 24 months postinjury were collected from patients who received no treatments over the scar regions. These HS samples were divided into three groups (1‐6 months group, 6‐12 months group, and 12‐24 months group) according to the duration of HS development. The five normal skin samples were collected from the hypogastrium donor regions during reconstructive surgeries and from the finger skin of polydactyly surgeries. Patients were excluded in case their wound was infectious or with comorbidity (e.g., diabetes, malnutrition, or malignant). Each tissue specimen was bisected, with halves placed in 10% formalin for 24 hours and the other halves snap frozen in liquid nitrogen and stored at −80°C for RT‐PCR. The formalin‐fixed tissue samples were embedded in paraffin, cut into 4‐μm sections, and stained with immunofluorescence staining of M1/M2 macrophages.
Table 1.
Characteristics of human tissue specimens
| No. | Age (y) | Sex | Sites of biopsy | Time after wounding | Type of wound | Wound size (length × width) | Wound depth | Scar severity score |
|---|---|---|---|---|---|---|---|---|
| 1 | 52 | Female | Forehead | 4 h | Traumatic | 3 × 0.5 | ME | N/A |
| 2 | 16 | Female | Face | 6 h | Traumatic | 3 × 0.5 | ME | N/A |
| 3 | 28 | Male | Face | 9 h | Traumatic | 4 × 0.6 | ME | N/A |
| 4 | 29 | Male | Forehead | 9 h | Traumatic | 2.5 × 0.4 | BE | N/A |
| 5 | 83 | Female | Neck | 14 h | Traumatic | 2.5 × 0.5 | ME | N/A |
| 6 | 17 | Male | Face | 2 d | Traumatic | 1.5 × 1.2 | ME | N/A |
| 7 | 6 | Male | Face | 3 d | Traumatic | 15 × 0.5 | BE | N/A |
| 8 | 42 | Male | Face | 4 d | Traumatic | 1.5 × 3.5 | ME | N/A |
| 9 | 7 | Female | Forehead | 4 d | Traumatic | 6 × 0.5 | ME | N/A |
| 10 | 22 | Male | Face | 5 d | Traumatic | 2 × 1.5 | ME | N/A |
| 11 | 5 | Male | Upper lip | 9 d | Traumatic | 2 × 2 | ME | N/A |
| 12 | 59 | Male | Face | 9 d | Traumatic | 4 × 0.5 | ME | N/A |
| 13 | 47 | Female | Nose | 10 d | Traumatic | 1.5 × 1.5 | ME | N/A |
| 14 | 24 | Male | Nose | 10 d | Traumatic | 1.5 × 4 | ME | N/A |
| 15 | 26 | Male | Ear | 10 d | Traumatic | 2 × 1 | ME | N/A |
| 16 | 26 | Male | Left leg | 15 d | Traumatic | 8.5 × 0.5 | ME | N/A |
| 17 | 30 | Female | Face | 24 d | Traumatic | 2 × 3 | ME | N/A |
| 18 | 27 | Male | Face | 24 d | Traumatic | 4 × 3 | ME | N/A |
| 19 | 20 | Male | Face | 28 d | Traumatic | 10 × 0.5 | ME | N/A |
| 20 | 42 | Male | Forehead | 28 d | Traumatic | 5 × 0.5 | ME | N/A |
| 21 | 1 | Male | Finger | 4 m | Burn | N/A | N/A | 10 |
| 22 | 1 | Male | Finger | 6 m | Traumatic | N/A | N/A | 10 |
| 23 | 27 | Male | Face | 6 m | Traumatic | N/A | N/A | 8 |
| 24 | 1 | Female | Finger | 7 m | Burn | N/A | N/A | 9 |
| 25 | 5 | Male | Abdomen | 7 m | Surgical | N/A | N/A | 3 |
| 26 | 28 | Male | Finger | 7 m | Burn | N/A | N/A | 13 |
| 27 | 1 | Female | Left hand | 7 m | Burn | N/A | N/A | 9 |
| 28 | 11 | Male | Finger | 8 m | Traumatic | N/A | N/A | 13 |
| 29 | 14 | Male | Neck | 8 m | Traumatic | N/A | N/A | 9 |
| 30 | 22 | Male | Scalp | 8 m | Traumatic | N/A | N/A | 8 |
| 31 | 32 | Male | Face | 11 m | Traumatic | N/A | N/A | 8 |
| 32 | 29 | Male | Underjaw | 1 y | Traumatic | N/A | N/A | 8 |
| 33 | 39 | Female | Neck | 1 y | Traumatic | N/A | N/A | 8 |
| 34 | 7 | Male | Left forearm | 1 y | Burn | N/A | N/A | 9 |
| 35 | 2 | Male | Right hand | 1 y | Burn | N/A | N/A | 7 |
| 36 | 10 | Female | Chest | 2 y | Burn | N/A | N/A | 13 |
| 37 | 25 | Male | Finger | 2 y | Burn | N/A | N/A | 11 |
| 38 | 3 | Female | Neck | 2 y | Burn | N/A | N/A | 11 |
| 39 | 18 | Male | Neck | 2 y | Burn | N/A | N/A | 13 |
| 40 | 3 | Female | Left forearm | 2 y | Burn | N/A | N/A | 12 |
| 41 | 33 | Male | Hypogastrium | N/A | N/A | N/A | N/A | 0 |
| 42 | 1 | Male | Finger | N/A | N/A | N/A | N/A | 0 |
| 43 | 5 | Male | Finger | N/A | N/A | N/A | N/A | 0 |
| 44 | 50 | Male | Hypogastrium | N/A | N/A | N/A | N/A | 0 |
| 45 | 1 | Female | Finger | N/A | N/A | N/A | N/A | 0 |
Abbreviations: BE, bone exposed; ME, muscle exposed; N/A, not applicable.
2.2. Immunofluorescence staining of M1/M2 macrophages
Immunofluorescence staining was performed on 4‐μm‐thick paraffin‐embedded sections. The sections were dewaxed, and antigen retrieval was performed by heat treatment in a water bath for 30 minutes with pH 9.0 EDTA buffer, followed by blocking with 10% donkey serum albumin for 1 hours and then incubated with the rabbit polyclonal anti‐RBP‐J (ab180588, 1:100, Abcam, Cambridge, MA) or the anti‐CMAF antibody (Ab955, 1:500, Abcam, Cambridge, MA) at 4°C overnight. The sections were then stained with the donkey anti‐rabbit secondary antibody (A‐21207, 1:1000, Thermo Fisher Scientific, Waltham, MA) for 3 hours at room temperature. Subsequently, slides were washed in 1× phosphate buffer solution tween‐20 (PBST) for 10 minutes three times and then incubated with the mouse monoclonal macrophage CD68 antibody (Ab955, 1:400, Abcam, Cambridge, MA) at 4°C overnight. The sections were then stained with the donkey anti‐mouse secondary antibody (A‐21202, 1:1000, Thermo Fisher Scientific, Waltham, MA) for 3 hours at room temperature. The tissue slices were washed and counterstained with Hoechst 33258 (WLA036a, Wanlei, Shenyang, China).
For quantitative evaluation, five randomly selected non‐overlapping high‐magnification fields (40×) of each section were photographed using the laser confocal microscope (Nikon Eclipse Ti, Tokyo, Japan). The numbers of labelled M1 or M2 macrophages were determined by counting positively stained marker combinations of CD68/RBP‐J or CD68/CMAF in the dermal layer of the skin using image analysis software (NIS‐Elements AR 2.10, Tokyo, Japan) by two separate investigators with certain pathology knowledge who were blinded to sample grouping.
2.3. Real‐time PCR analysis for cytokines associated with M1/M2 macrophages
Total RNA of skin samples was isolated using the TRIzol reagent (Invitrogen, Carlsbad, CA, USA) according to the manufacturer's instructions and reverse transcribed using PrimeScript RT Master Mix (RR036A, Takara, Shiga, Japan). All PCR primers flanked exon‐exon borders to avoid amplification of genomic sequences, and these sequences are shown in Table 2. Real‐time PCR was performed using SYBR Premix Ex Taq II (RR820A, Takara, Shiga, Japan) in a StepOne Plus Real Time PCR system (Applied Biosystems, Foster City, CA, USA). All PCRs were performed at least twice. The comparative method of relative quantification (2−△△Ct) was used to calculate the expression level of the target gene normalised to the housekeeping gene glyceraldehyde‐3‐phosphate dehydrogenase (GAPDH). Data are expressed as the relative increase of the wound samples or the HS samples over normal skin samples.
Table 2.
Primers and sequences used in the experiment
| Genes test | Primers sequences (5′‐3′) | Annealing (°C) |
|---|---|---|
| NOS2(NM_000625.4) | F: CAGCAAGCAGCAGAATGAGTCC | 60 |
| R: TGCATCCAGCTTGACCAGAGA | ||
| TNF‐α(NM_000594.3) | F: CTGCCTGCTGCACTTTGGAG | 60 |
| R: ACATGGGCTACAGGCTTGTCACT | ||
| IL6(NM_000600) | F: AAGCCAGAGCTGTGCAGATGAGTA | 60 |
| R: TGTCCTGCAGCCACTGGTTC | ||
| ARG1(NM_000045.3) | F: GTTTTGATGTTGACGGACTGGA | 62 |
| R: AATCCTGAGAGTAGCCCTGTTTTG | ||
| TGFβ1(NM_000660.5) | F: TCCTGGCGATACCTCAGCAA | 60 |
| R: GCTAAGGCGAAAGCCCTCAA | ||
| CD206(NM_002438.3) | F: GCCCGGAGTCAGATCACACA | 60 |
| R: AGTGGCTCAACCCGATATGACAG |
2.4. Statistical analysis
All statistical tests were performed using SPSS17.0 software (SPSS, Chicago, Illinois). The results were expressed as the mean ± standard deviation, and statistical comparisons of the means were performed using the one‐way analysis of variance (anova). LSD was used to calculate statistical significance. Differences with P < 0.05 were considered statistically significant. Linear regression analyses were performed to determine correlations between normally distributed data variables.
3. RESULTS
3.1. The density of macrophage M1/M2 phenotype during HS development
The results showed that the density of the M1 macrophages increased gradually and peaked at 7 to 14 days postinjury, followed by an obvious decline at 14 to 28 days (Figures 1D,I and Figure 2A). Density did not change significantly in HS tissue compared with 14 to 28 days wound and normal skin. anova showed that the number of M1 macrophages in 7 to 14 days wounds was significantly higher than the other wound tissue groups, HS tissue and NS tissue (P < 0.01). Meanwhile, M1 macrophages in 0 to 2 and 2 to 7 days wounds were also significantly more abundant than in normal skin and the three groups of HS tissue. In a word, M1 macrophages were mainly found in early wound tissues. Conversely, the density of M2 macrophages remained stable during the first three stages and peaked at 14 to 28 days postinjury, later than the peaking time of M1 macrophages (7‐14 days postinjury). In contrast to M1 macrophages, the density of M2 macrophages in HS tissues of the proliferative phase (1‐6 months) was significantly higher than that of normal skin and early wound tissues (0‐2, 2‐7 and 7‐14 days, P < 0.01) and significantly lower than that of later wound tissue (14‐28 days, P < 0.01, Figure 2B). anova showed that the density of M2 macrophages in 14 to 28 days wounds was significantly higher than the other wound tissue groups, HS tissue and NS tissue (P < 0.01). In a word, M2 macrophages were mainly found in remodelling wound tissues and proliferative HS tissues.
Figure 1.

The dynamic changes of the macrophage M1/M2 phenotype during wound healing and hypertrophic scar (HS) development. A, B, C, D, I, J, K, and L showed the M1 macrophages of normal skin, wounds of the 0 to 2 days group, the 2 to 7 days group, the 7 to 14 days group, the 14 to 28 days group, HS of the 1 to 6 months group, the 6 to 12 months group, and the 12 to 24 months group. M1 macrophages were identified as double positive for membrane staining of CD68 (green) and nuclear transcription factor staining of RBP‐J (red). Similarly, M2 macrophages were identified as double positive for membrane staining of CD68 (green) and nuclear transcription factors staining of CMAF (red). E, F, G, H, M, N, O, and P showed the M2 macrophages of normal skin, wounds of the 0 to 2 days group, the 2 to 7 days group, the 7 to 14 days group, the 14 to 28 days group, HS of the 1 to 6 m group, the 6 to 12 m group, and the 12 to 24 m group. Original magnification: 40×. The arrows indicate the positive cells. d, days; m, months
Figure 2.
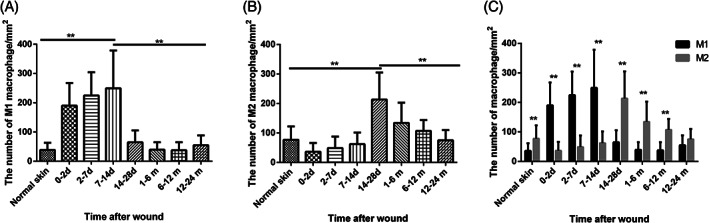
The density changes of M1 and M2 macrophages in wound‐healing process and hypertrophic scar (HS) development and the ratio of M1 and M2 macrophages in each group. The density was calculated as the ratio of the number of double positive cells in the dermal region using 400‐fold magnification and the area. A showed the density changes of M1 macrophages and B showed the density changes of M2 macrophages. C showed the ratio of the density of M1 macrophage and M2 macrophage. Error bars represent the mean ± standard deviation (n = 5; independent experiments). Significantly different at **P < 0.01 as determined using one‐way analysis of variance with post hoc LSD test
3.2. M1 macrophages were distributed perivascularly and M2 macrophages were distributed diffusely in the dermis
Histologically, most M1 macrophages were detected accumulating around the blood vessels (Figure 3C,D) in the superficial layer of the dermis during the early stages of wound healing (Figure 3A). The distribution of M2 macrophages was different from that of M1 macrophages, which were scattered throughout dermis but not gathered around the blood vessels (Figure 4).
Figure 3.

Histologic analysis of M1 macrophage infiltration in the human tissues (green: CD68, red: RBP‐J, blue: DAPI). The dotted lines indicate the boundaries of the epidermis and the dermis. A and C showed the histological distribution of M1 macrophage in the 0 to 2 and 2 to 7 days wounds with the original magnification of 20×. B and D showed the local amplification of A and C with the original magnification of 40× and a double positive cell was showed in the lower right box of B and the top right box of D
Figure 4.

Histologic analysis of M2 macrophage infiltration in the human tissues. (green: CD68, red: CMAF, blue: DAPI). The dotted lines indicate the boundaries of the epidermis and the dermis. A and C showed the histological distribution of M2 macrophage in the 1 to 6 and 12 to 24 months hypertrophic scar tissues with the original magnification of 20×. B and D showed the local amplification of a and C with the original magnification of 40× and a double positive cell was shown in the lower right box of B and D
3.3. The dynamic changes of biomarkers and cytokines associated with M1 and M2 macrophages during HS formation
To study the functional impact of macrophages during various phases of human skin repair processes, we compared the dynamic changes of M1‐associated and M2‐associated biomarkers and cytokines in a series of clinical wound tissues and HS specimens by quantitative real‐time PCR (Figure 5). The results showed that the trends of the three M1 biomarkers we investigated were accordant, manifesting first by a decrease at 2 to 7 days postinjury, followed by an increase at 7 to 14 days postinjury, and then another decrease at 14 to 28 days. In addition, these three biomarkers reached the highest levels at 7 to 14 days postinjury, which was in accordance with the time taken by the M1 macrophage to reach the peak number (Figure 2A). Unlike M1 macrophage, the mRNA level of the tested M1‐type genes (NOS2 and TNF‐α) in HS tissues was not significantly lower than wound tissues. Confined to HS tissues, NOS2 and IL‐6 gradually increased over time from the HS proliferation phase (1‐6 and 6‐12 months) to the mature phase (12‐24 months) and peaked at 12 to 24 months of HS formation (Figure 5A,C), while tumour necrosis factor‐alpha (TNF‐α) decreased from the HS proliferation phase to the mature phase (Figure 5B). anova showed that the M1‐associated cytokine IL‐6 in 2 to 7 and 7 to 14 days wound tissues was significantly higher than in normal skin and 7 to 14 days wound was also significantly higher than all HS tissues (P < 0.05).
Figure 5.

Relative mRNA expression of biomarkers and cytokines associated with M1 macrophages and M2 macrophages normalised to GAPDH and normal skin expressed as 2−(ΔΔCt) in human specimens during wound‐healing process and hypertrophic scar development. A–C showed the relative mRNA expression of M1‐associated genes NOS2, TNF‐α, and IL‐6. D–F showed the relative mRNA expression of M2‐associated genes ARG1, TGF‐β1, and CD206. Error bars represent the mean ± standard deviation (n = 5; independent experiments). Significantly different at *P < 0.05, **P < 0.01 as determined using one‐way analysis of variance with post hoc LSD test. NS, normal skin; d, days; m, months
As for the markers of M2 macrophages, ARG1 expression showed the same changing trend as that of M2 macrophage cell density in wound tissues, demonstrating a gradual increase after trauma, and reaching a peak value at 14 to 28 days postinjury. This was significantly higher than that of wound tissues collected at other time points, as well as that of normal skin and all HS tissues (P < 0.01). The other two markers of M2 macrophage in wound tissues showed the same changing characteristics, with expression levels increasing at 2 to 7 days postinjury and decreasing at 14 to 28 days postinjury. In contrast to M1‐associated biomarkers, mRNA expression of the tested M2 markers, CD206 and ARG1, decreased from the proliferation phase (1‐6 and 6‐12 months) to the mature phase (12‐24 months), consistent with the changing trend of M2 macrophage during HS formation (Figure 2B). However, M2‐associated cytokine TGF‐β1 showed different behaviour, increasing at all periods of HS development. anova showed that TGF‐β1 in later HS tissues (6‐12 and 12‐24 months) was significantly higher than that of normal skin (P < 0.05), and TGF‐β1 in 12 to 24 months HS tissue was also significantly higher than that of 0 to 2 days wound tissue (P < 0.01).
3.4. The correlation between the M1/M2 macrophage and the characteristics of HS
By univariate analysis, we found a negative correlation between HS hyperplasia time and M2 density (correlation 9.344; P = 0.011; Table 3), indicating that M2 macrophages disappeared gradually during HS development. Furthermore, relative mRNA expression of TNF‐α and IL‐6 correlated with M1 macrophage density in human wound and HS specimens we tested, demonstrating that M1 macrophages were the main source of TNF‐α and IL‐6 in wound and HS. In addition, ARG1 correlated with M2 macrophage density, verifying that ARG1 is an appropriate biomarker of M2 macrophages.
Table 3.
Univariate analysis of correlations between M1 density, M2 density, M1‐type biomarkers, M2‐type biomarkers, VSS score, and HS hyperplasia time
| Hyperplasia time (mo) | M1 | M2 | NOS2 | TNF‐α | IL‐6 | ARG1 | TGF‐β1 | CD206 | |
|---|---|---|---|---|---|---|---|---|---|
| VSS score | F = 3.123 | F = 1.183 | F = 2.687 | F = 0.034 | F = 3.515 | F = 1.823 | F = 1.961 | F = 0.679 | F = 0.005 |
| P = 0.121 | P = 0.309 | P = 0.140 | P = 0.858 | P = 0.094 | P = 0.210 | P = 0.195 | P = 0.431 | P = 0.946 | |
| Hyperplasia time (mo) | F = 1.073 | F = 9.344 | F = 0.661 | F = 0.195 | F = 3.816 | F = 2.853 | F = 4.705 | F = 2.315 | |
| P = 0.322 | P = 0.011 * | P = 0.437 | P = 0.669 | P = 0.083 | P = 0.126 | P = 0.058 | P = 0.163 | ||
| M1 | F = 4.106 | F = 0.269 | F = 0.475 | F = 0.568 | F = 0.336 | F = 0.438 | F = 0.039 | ||
| P = 0.050 | P = 0.280 | P = 0.046 * | P = 0.014 * | P = 0.173 | P = 0.069 | P = 0.847 | |||
| M2 | F = 0.001 | F = 0.204 | F = −0.003 | F = 0.697 | F = 0.199 | F = 0.069 | |||
| P = 0.997 | P = 0.417 | P = 0.990 | P = 0.001 ** | P = 0.427 | P = 0.797 |
Bold values represent the correlation between the row and the column is remarkable.
P < 0.05.;
P < 0.01.
4. DISCUSSION
In the process of tissue repair, M1 initiates inflammatory responses while M2 dominates in the later stages of proliferation and remodelling. The sequential infiltration by M1 and M2 macrophages in wound was also found in Daley's study in a murine model,14 along with evidence that wound macrophages isolated in the early stage after wounding predominantly produce M1‐associated cytokines (TNF‐α and IL‐6), whereas those harvested from wounds on the later phase release more M2‐associated cytokines TGF‐β1. This finding resembles our finding of TNF‐α and IL‐6 peaking at 7 to 14 days postinjury, followed by a substantial decline at 14 to 28 days postinjury, whereas TGF‐β1 maintained high levels from day 2 to day 28 postinjury. Broek et al15 investigated the dynamic changes of M2 macrophages during human HS formation and found that M2 macrophages increased at 4 to 6 weeks postoperatively in HS‐forming patients and then decreased at 12 and 52 weeks. This observation is in agreement with our results that M2 macrophage increased during wound healing, peaking at the remoulding phase and decreasing during HS development (Figure 2B). M2 macrophages disappeared along with HS development. Some die in the wound, as evidenced by the appearance of the intracellular M2 macrophage molecule ARG1 in rat wound extracellular fluid.16 Others are likely to migrate to draining lymph nodes.17, 18
The traditional view was that less inflammation results in optimal healing with minimum scar formation, as described in mucosal or foetal wound healing,19, 20, 21 and increased inflammatory response has been linked to HS formation.22 By contrast, Broek et al15 found that inflammation had been suppressed in HS, compared with normotrophic scars as a result of inflammatory gene expression, but they did not investigate dynamic changes of M1 macrophages. Our results found that M1 macrophages accumulated around the blood vessels, leading to an inflammatory cascade during the early wound‐healing process. The differences of these results may be ascribed to the time span of HS development we investigated, as Broek et al did not investigate the early wound‐healing process. The evidence of our study further confirmed in human that the rapid influx of monocytes was subsequently differentiated into M1 macrophages once skin injury occurred, which were identified as a principal source of M1 macrophages. This is in alignment with previous studies in diverse models.23 Lucas et al4 showed that M2 was absent in the wound site if macrophages were depleted during the early stage of repair, indicating that environmental factors that induce M2 macrophages are primarily present during the early stage of repair, maybe M1 macrophages or proinflammatory cytokines, but the cytokines considered necessary for M2 macrophage, IL‐4 and IL‐13 were not detected in the mouse wound environment at any time and were not produced by mouse wound cells, according to Daley.14 Therefore, M2 macrophages are likely to originate from M1 macrophages based on animal experiments.
Depending on the activating stimulus received, M2 macrophages can be further divided into four different subsets consisting of M2a, M2b, M2c, and M2d. The M2a subtype is stimulated by interleukin (IL)‐4 or IL‐13, M2b by IL‐1R ligands or lipopolysaccharide, M2c by glucocorticoids or IL‐10, and M2d is by TLR agonists through the adenosine receptor.24 As previously mentioned, Daley reported that IL‐4 and IL‐13 were not detected in the mouse wound environment at any time and were not produced by mouse wound cells.14 Therefore, M2 macrophage in wound tissues should be M2b, M2c, or M2d. M2b and M2d do not express cell markers of CD206 and ARG1, and do not secrete cytokines of TGF‐β,24 thus it is speculated that M2 macrophage in wound tissues should be M2c. The M2c subset strongly exhibits anti‐inflammatory activities against apoptotic cells by releasing high amounts of IL‐10 and TGF‐β,24 and IL‐10, in turn, stimulates macrophage to polarise into M2c, resulting into a positive feedback loop of IL‐10 production by M2c. The literature reported that CMAF is an essential transcription factor for IL‐10 gene expression in Macrophages.25 Therefore, our immunofluorescence results support the speculation indirectly.
Macrophages in wounds are a critical source of important cytokines in wound healing.26, 27 TNF‐α plays a critical regulatory role in muscle regeneration and is essential for efficient healing after injury.28 Excessive levels of IL‐6 have been associated with cutaneous scarring. IL‐6 administration to foetal wounds resulted in scar formation.29 A strong and persistent expression of TGF‐β1 was detected in human postburn HSs,30, 31 which could induce ECM production and fibroblast differentiation. In the current study, we investigated the dynamic changes of cytokines TNF‐α, IL‐6, and TGF‐β1 during wound healing and HS formation. Grellner et al32 showed that TNF‐α and IL‐6 in wound increased by 8.5‐fold and 11‐fold compared with control skin, respectively. In addition, these cytokines increased from several seconds or minutes to 24 hours and decreased after 24 hours. Our investigations agreed with their results: mRNA levels of TNF‐α and IL‐6 increased at 0 to 2 days postwounding followed by a decline at 2 to 7 days postwounding. IL‐6 in wound and HS tissue was 3 to 300‐fold higher than in normal skin (Figure 5C). Overexpression of IL‐6 may result in scar formation by facilitating proliferation of keratinocytes, myoblasts, and fibroblasts.33 The mRNA level of TGF‐β1 in 2 to 7, 7 to 14 days wound, and 12 to 24 months HS tissue was significantly higher than in normal skin (Figure 5E), indicating that TGF‐β1 plays an important role in wound healing and HS formation. However, mRNA levels of TGF‐β1 did not correlate significantly with the number of M2 macrophages, possibly because M2 macrophages are not the only source of TGF‐β1. The HS fibroblast showed an overexpression of TGF‐β1 RI and RII receptors up to 2 years post injury and there was a failure to detect TGF‐β receptors in HTS after 8 years indicated by Schmid et al.34 Ghahary et al found that there was no obvious decrease of TGF‐β1 in 27 months postburn scar.35 Abdou et al36 reported that TGF‐β1 expression in aberrant scar lesions was significantly associated with lesions of shorter duration and older age group, while the samples used in that article included keloid samples. Usually, HS became mature over 1 to 2 years, induced by the decrease of some profibrotic factors, such as TGF‐β1, but this period can range from 6 months to 3 years.37 Therefore, in the future study, we would collect some cases of HS samples with the duration time more than 2 years to investigate the expression of TGF‐β1 combined with clinical characteristics of HS.
The expression of TNF‐α, IL‐6 and ARG1 was interrelated with the density of M1 and M2 macrophages, respectively, yet NOS2, TGF‐β1, and CD206 did not correlate with the number of macrophages. Thus, characteristics associated with a macrophage phenotype may not be expressed simultaneously in vivo, in agreement with the concept that a single marker cannot be used to define a population of macrophages.38 In addition, previous studies of the macrophage phenotype based on animal models cannot represent the characteristic of human macrophages, because of the differences in skin physiology and immunology.9 This study, which investigated macrophage phenotypes in human tissue, could reflect actual clinical status. More importantly, scar formation is a dynamic process over a period of several months after skin injury. Studies confined to one period were inadequate. We collected wound and HS tissue at various phases to reflect the dynamic changes of macrophage phenotypes and cytokine levels systematically, thereby gaining a deeper understanding of the pathogenesis of hyperplastic scars.
Chen L, Wang J, Li S, et al. The clinical dynamic changes of macrophage phenotype and function in different stages of human wound healing and hypertrophic scar formation. Int Wound J. 2019;16:360–369. 10.1111/iwj.13041
Funding information National Natural Science Foundation of China, Grant/Award Number: 81571906
Contributor Information
Baoqiang Song, Email: songbq@fmmu.edu.cn.
Yingjun Su, Email: suyingjun@fmmu.edu.cn.
REFERENCES
- 1. Finnerty CC, Jeschke MG, Branski LK, Barret JP, Dziewulski P, Herndon DN. Hypertrophic scarring: the greatest unmet challenge after burn injury. The Lancet. 2016;388(10052):1427‐1436. [DOI] [PMC free article] [PubMed] [Google Scholar]
- 2. Sen CK, Gordillo GM, Roy S, et al. Human skin wounds: a major and snowballing threat to public health and the economy. Wound Repair Regen. 2009;17(6):763‐771. [DOI] [PMC free article] [PubMed] [Google Scholar]
- 3. Singer AJ, Clark RA. Cutaneous wound healing. N Engl J Med. 1999;341(10):738‐746. [DOI] [PubMed] [Google Scholar]
- 4. Lucas T, Waisman A, Ranjan R, et al. Differential roles of macrophages in diverse phases of skin repair. J Immunol. 2010;184(7):3964‐3977. [DOI] [PubMed] [Google Scholar]
- 5. Zhu Z, Ding J, Ma Z, Iwashina T, Tredget EE. Systemic depletion of macrophages in the subacute phase of wound healing reduces hypertrophic scar formation. Wound Repair Regen. 2016;24(4):644‐656. [DOI] [PubMed] [Google Scholar]
- 6. Martin P, Parkhurst SM. Parallels between tissue repair and embryo morphogenesis. Development. 2004;131(13):3021‐3034. [DOI] [PubMed] [Google Scholar]
- 7. Mustoe TA, Cooter RD, Gold MH, et al. International clinical recommendations on scar management. Plast Reconstr Surg. 2002;110(2):560‐571. [DOI] [PubMed] [Google Scholar]
- 8. Brancato SK, Albina JE. Wound macrophages as key regulators of repair: origin, phenotype, and function. Am J Pathol. 2011;178(1):19‐25. [DOI] [PMC free article] [PubMed] [Google Scholar]
- 9. Schneemann M, Schoeden G. Macrophage biology and immunology: man is not a mouse. J Leukoc Biol. 2007;81(3):579. [DOI] [PubMed] [Google Scholar]
- 10. Barros MH, Hauck F, Dreyer JH, Kempkes B, Niedobitek G. Macrophage polarisation: an immunohistochemical approach for identifying M1 and M2 macrophages. PLoS One. 2013;8(11):e80908. [DOI] [PMC free article] [PubMed] [Google Scholar]
- 11. Xu H, Zhu J, Smith S, et al. Notch‐RBP‐J signaling regulates the transcription factor IRF8 to promote inflammatory macrophage polarization. Nat Immunol. 2012;13(7):642‐650. [DOI] [PMC free article] [PubMed] [Google Scholar]
- 12. Cao S, Liu J, Chesi M, et al. Differential regulation of IL‐12 and IL‐10 gene expression in macrophages by the basic Leucine zipper transcription factor c‐Maf Fibrosarcoma. J Immunol. 2002;169(10):5715‐5725. [DOI] [PubMed] [Google Scholar]
- 13. Sullivan T, Smith J, Kermode J, McIver E, Courtemanche DJ. Rating the burn scar. J Burn Care Rehabil. 1990;11(3):256‐260. [DOI] [PubMed] [Google Scholar]
- 14. Daley JM, Brancato SK, Thomay AA, Reichner JS, Albina JE. The phenotype of murine wound macrophages. J Leukoc Biol. 2010;87(1):59‐67. [DOI] [PMC free article] [PubMed] [Google Scholar]
- 15. van den Broek LJ, van der Veer WM, de Jong EH, Gibbs S, Niessen FB. Suppressed inflammatory gene expression during human hypertrophic scar compared to normotrophic scar formation. Exp Dermatol. 2015;24(8):623‐629. [DOI] [PubMed] [Google Scholar]
- 16. Albina JE, Mills CD, Henry WL Jr, Caldwell MD. Temporal expression of different pathways of 1‐arginine metabolism in healing wounds. The Journal of Immunology. 1990;144(10):3877‐3880. [PubMed] [Google Scholar]
- 17. Bellingan GJ, Caldwell H, Howie SE, Dransfield I, Haslett C. In vivo fate of the inflammatory macrophage during the resolution of inflammation: inflammatory macrophages do not die locally, but emigrate to the draining lymph nodes. J Immunol. 1996;157(6):2577‐2585. [PubMed] [Google Scholar]
- 18. Harmsen AG, Muggenburg BA, Snipes MB, Bice DE. The role of macrophages in particle translocation from lungs to lymph nodes. Science. 1985;230(4731):1277‐1280. [DOI] [PubMed] [Google Scholar]
- 19. Chen L, Arbieva ZH, Guo S, Marucha PT, Mustoe TA, DiPietro LA. Positional differences in the wound transcriptome of skin and oral mucosa. BMC Genomics. 2010;11:471. [DOI] [PMC free article] [PubMed] [Google Scholar]
- 20. Wilgus TA. Regenerative healing in fetal skin: a review of the literature. Ostomy Wound Manage. 2007;53(6):16‐31. quiz 2‐3. [PubMed] [Google Scholar]
- 21. Wong JW, Gallant‐Behm C, Wiebe C, et al. Wound healing in oral mucosa results in reduced scar formation as compared with skin: evidence from the red Duroc pig model and humans. Wound Repair Regen. 2009;17(5):717‐729. [DOI] [PubMed] [Google Scholar]
- 22. Novak ML, Koh TJ. Macrophage phenotypes during tissue repair. J Leukoc Biol. 2013;93(6):875‐881. [DOI] [PMC free article] [PubMed] [Google Scholar]
- 23. Soehnlein O, Lindbom L. Phagocyte partnership during the onset and resolution of inflammation. Nat Rev Immunol. 2010;10(6):427‐439. [DOI] [PubMed] [Google Scholar]
- 24. Shapouri‐Moghaddam A, Mohammadian S, Vazini H, et al. Macrophage plasticity, polarization, and function in health and disease. J Cell Physiol. 2018;233(9):6425‐6440. [DOI] [PubMed] [Google Scholar]
- 25. Cao S, Liu J, Song L, Ma X. The Protooncogene c‐Maf is an essential transcription factor for IL‐10 gene expression in macrophages. J Immunol. 2005;174(6):3484‐3492. [DOI] [PMC free article] [PubMed] [Google Scholar]
- 26. Zhao Y, Bao L, Chan LS, DiPietro LA, Chen L. Aberrant wound healing in an epidermal Interleukin‐4 transgenic mouse model of atopic dermatitis. PLoS One. 2016;11(1):e0146451. [DOI] [PMC free article] [PubMed] [Google Scholar]
- 27. Novak ML, Koh TJ. Phenotypic transitions of macrophages orchestrate tissue repair. Am J Pathol. 2013;183(5):1352‐1363. [DOI] [PMC free article] [PubMed] [Google Scholar]
- 28. Werner S, Richard G. Regulation of wound healing by growth factors and cytokines. Physiol Rev. 2003;83(3):835‐870. [DOI] [PubMed] [Google Scholar]
- 29. Liechty KW, Adzick NS, Crombleholme TM. Diminished interleukin 6 (IL‐6) production during scarless human fetal wound repair. Cytokine. 2000;12(6):671‐676. [DOI] [PubMed] [Google Scholar]
- 30. Zhang K, Garner W, Cohen L, Rodriguez J, Phan S. Increased types I and III collagen and transforming growth factor‐beta 1 mRNA and protein in hypertrophic burn scar. J Invest Dermatol. 1995;104(5):750‐754. [DOI] [PubMed] [Google Scholar]
- 31. Chalmers RL. The evidence for the role of transforming growth factor‐beta in the formation of abnormal scarring. Int Wound J. 2011;8(3):218‐223. [DOI] [PMC free article] [PubMed] [Google Scholar]
- 32. Grellner W, Georg T, Wilske J. Quantitative analysis of proinflammatory cytokines (IL‐1beta, IL‐6, TNF‐alpha) in human skin wounds. Forensic Sci Int. 2000;111(1–3):251‐264. [DOI] [PubMed] [Google Scholar]
- 33. Hernandez‐Quintero M, Kuri‐Harcuch W, Gonzalez Robles A, Castro‐Munozledo F. Interleukin‐6 promotes human epidermal keratinocyte proliferation and keratin cytoskeleton reorganization in culture. Cell Tissue Res. 2006;325(1):77‐90. [DOI] [PubMed] [Google Scholar]
- 34. Schmid P, Itin P, Cherry G, Bi C, Cox DA. Enhanced expression of transforming growth factor‐β type I and type 11 receptors in wound granulation tissue and hypertrophic scar. Am J Pathol. 1998;152(2):485‐493. [PMC free article] [PubMed] [Google Scholar]
- 35. Ghahary A, Shen YJ, Scott PG, Tredget EE. Immunolocalization of TGF‐beta 1 in human hypertrophic scar and normal dermal tissues. Cytokine. 1995;7(2):184‐190. [DOI] [PubMed] [Google Scholar]
- 36. Abdou AG, Maraee AH, Al‐Bara AM, Diab WM. Immunohistochemical expression of TGF‐β1 in keloids and hypertrophic scars. Am J Dermatopathol. 2011;33(1):84‐91. [DOI] [PubMed] [Google Scholar]
- 37. Suda S, Williams H, Medbury HJ, Holland AJ. A review of monocytes and monocyte‐derived cells in hypertrophic scarring post burn. J Burn Care Res. 2016;37(5):265‐272. [DOI] [PubMed] [Google Scholar]
- 38. Mosser DM, Edwards JP. Exploring the full spectrum of macrophage activation. Nat Rev Immunol. 2008;8(12):958‐969. [DOI] [PMC free article] [PubMed] [Google Scholar]