Abstract
There is a paucity of quantitative measures of microvascular perfusion values in the skin. Newly developed, handheld hyperspectral imaging devices identify unique spectral fingerprints of oxygenated and deoxygenated haemoglobin in the superficial microvasculature. Establishing value ranges for healthy patients without vascular complications will subsequently help standardise assessments for perfusion defects. In particular, diabetics who are prone to vascular calcifications and lower extremity wounds may benefit. A total of 73 subjects were enrolled in the study and split in two cohorts: 36 ‘non‐diabetic’ non‐vascularly compromised patients and 37 ‘diabetic’ patients with a formal diagnosis of diabetes but without history of pedal ulceration. Values of oxygenated haemoglobin (HT‐Oxy) and deoxygenated haemoglobin (HT‐DeOxy) from both devices are analysed.
Keywords: haemoglobin, hyperspectral imaging, microvasculature, perfusion assessment, tissue oxygenation
1. INTRODUCTION
The number of people who have been diagnosed with diabetes has nearly quadrupled in the past 25 years worldwide. 1 By 2045, an estimated 629 million people will be afflicted by the disease and nearly a quarter of these patients will develop diabetes‐related foot ulcerations (DFU). 2 , 3 DFU's contribute significantly to the risk for limb loss and even death and will be a major economic burden for US healthcare as prevalence increases. 4 , 5
The pathologic contributions of diabetes and its ability to initiate and progress DFU is multifaceted; however, vascular compromise plays a major role in the process. Valid measures of both the macro and microvasculature are a promising means of assessing tissue integrity and healing potential. Long‐standing tools such as ankle‐brachial index (ABI), Doppler‐based devices, and transcutaneous partial pressure of oxygen (TcPO2) are well established but have limitations and do not thoroughly assess microvascular perfusion. 6 , 7
Hyperspectral imaging is a novel imaging modality that evaluates levels of oxygenated and deoxygenated haemoglobin within a tissue plane to the depth of 1 to 2 mm beneath the surface of the skin (based on penetration of near‐infrared or visible light). Oxygenated and deoxygenated haemoglobin have unique spectral fingerprints that have been identified in the literature. 7 Capture and analysis of these reflected wavelengths can quantify bound haemoglobin giving this technology an advantage over Doppler ultrasonography and angiography.
The imaging devices, HyperView (HyperMed, Memphis) and KD203 (Kent, Calgary) are portable, non‐invasive cameras that combine light arrays, high pixel density photoreceptors, and analytical software to measure microvascular perfusion values. Device A (KD203), uses near‐infrared (near‐IR) light with wavelengths of approximately 830 and 760 nm to quantify oxygenated (HT‐Oxy) and deoxygenated haemoglobin (HT‐Deoxy) in the tissue. Device B, (Hyperview) utilises shorter wavelength photons for analysis. At approximately 542 nm and 578 nm for HT‐Oxy and 554 nm for HT‐DeOxy, these fall within the visual spectrum.
Both devices provide a quantitative measure of haemoglobin in a localised area of the body. The real‐time, visual representation of microvascular perfusion has extensive implications in medicine and surgery. This is especially true in the distal lower extremity, where vascular compromise and ischaemia routinely inhibit healing.
To date, few studies have evaluated hyperspectral imaging for its value in tissue assessment. Two reports found significant difference between wound healing potential utilising hyperspectral imaging in 10 patients. 8 , 9 Chin et al expanded on this and reported significant differences in hyperspectral fingerprints between patients with and without documented peripheral arterial disease. 10 Yudovski et al found hyperspectral changes that actually preceded tissue breakdown. 11
These findings were limited to associations with pathology and neglect to assess baseline values in healthy individuals. In order to evaluate this novel modality for clinical use, this study focuses on establishing normal values for non‐vascularly compromised, diabetic, and non‐diabetic subjects.
2. METHODS
The study was reviewed and approved by the Georgetown University Institutional Review Board (IRB) for Human Subjects. The study enrolled a total of 73 subjects with no signs or symptoms of peripheral arterial or venous disease and no history of lower extremity wounds. Study subjects were collected from the Georgetown University campus and hospital including the Student Health Center, Athletic Training Center, Center for Wound Care, Foot and Ankle Center, General Medicine and Endocrinology Center. All subjects consented to participation in this study. Only Device A required calibration. This was performed on initial startup and as required by device diagnostics.
Images of the bilateral feet were captured during a single encounter using both Device A and Device B. (1, 2) A total of six images per patient were captured; three per foot centred on the dorsal and plantar metatarsal head parabolas and the heel. Targeting lasers incorporated into each device controlled optimal focal distance. During image capture, a one‐page health history questionnaire covering tobacco history, recent intake of caffeine, chocolate and medications, activity level, medical diagnoses, duration of diabetes, and last A1C was completed by the patient. The ABI was assessed for each subject. Only individuals with an ABI between 0.90 and 1.40 were included.
IMAGE 1.
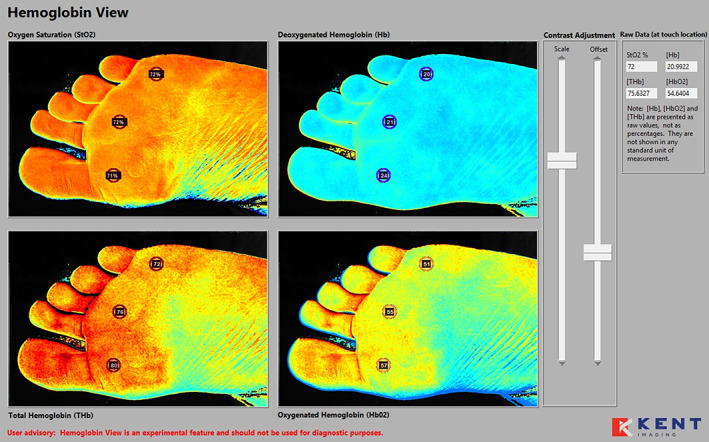
Device A hyperspectral collage of the plantar foot. L1M, L3M, and L5M marked with associated oxygenated/deoxygenated haemoglobin (HT‐Oxy/Deoxy) quantification in the non‐diabetic
IMAGE 2.
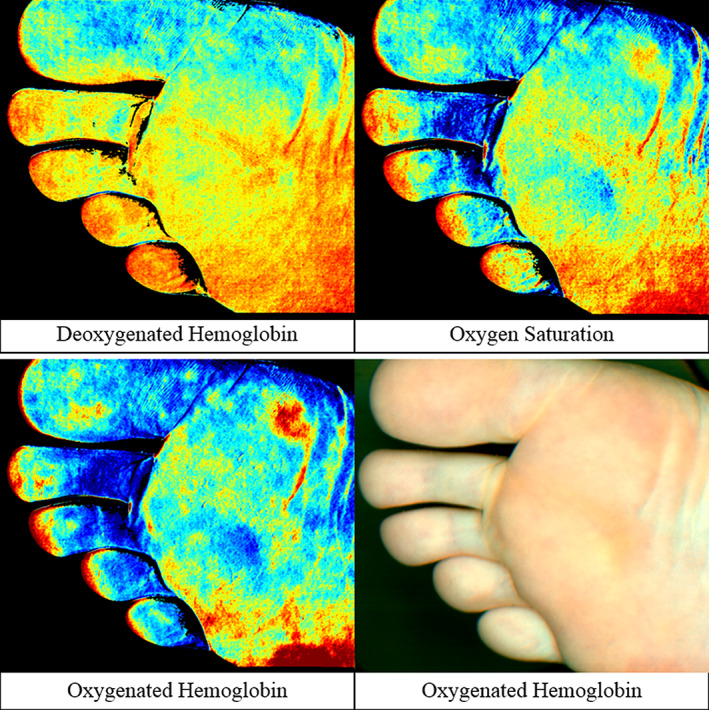
Device B hyperspectral collage of the plantar foot in the non‐diabetic
Oxygenated (HT‐Oxy) and deoxygenated (HT‐deoxy) haemoglobin values were calculated post capture. This was performed using the associated device software and drawing a 10 mm circle over specific high‐risk anatomical locations: the heel, plantar 1st, 3rd, and 5th metatarsophalangeal (MTP) joints, and the dorsal 3rd MTP joint.
Descriptive statistics were used to analyse the data collected from the study subjects. The dependent variables were continuous variables that were described by means and standard deviations whose outcomes were ABI, age, and HT‐Oxy and HT‐Deoxy values. The independent variables of primary interest were the anatomical sites. Pairwise differences were analysed using the t‐test to analyse differences between two average values. Significance was defined as P < .05.
3. RESULTS
Total enrolment for this study was 73 subjects with 36 non‐diabetic and 37 diabetic subjects. The diabetic group had a mean ABI of 1.23 ± 0.12 (0.96‐1.40). The non‐diabetic group had a mean ABI of 1.27 ± 0.09 (1.06‐1.40). Mean age was 59.73 ± 12.24 (31‐76) in the diabetic group and 41.17 ± 18.07 (19‐93) in the healthy normal group.
HT‐Oxy and HT‐Deoxy ranges and averages were determined across all measured areas of the feet and shown in units correlating the concentration of blood in the tissue (μmol/L). Values ranged widely with both the normal and diabetic subject groups (Figures 1 and 2). Using Device A, the normal group presented HT‐Oxy levels of 3 to 198 μmol/L and HT‐Deoxy levels between 4 and 57 μmol/L. The plantar foot showed higher levels of HT‐Oxy (77‐88 μmol/L) while dorsal regions showed lower values of approximately 45 μmol/L. The HT‐Deoxy average was more stable across the foot with values of 30 to 36 μmol/L measured on both the plantar and dorsal regions.
FIGURE 1.
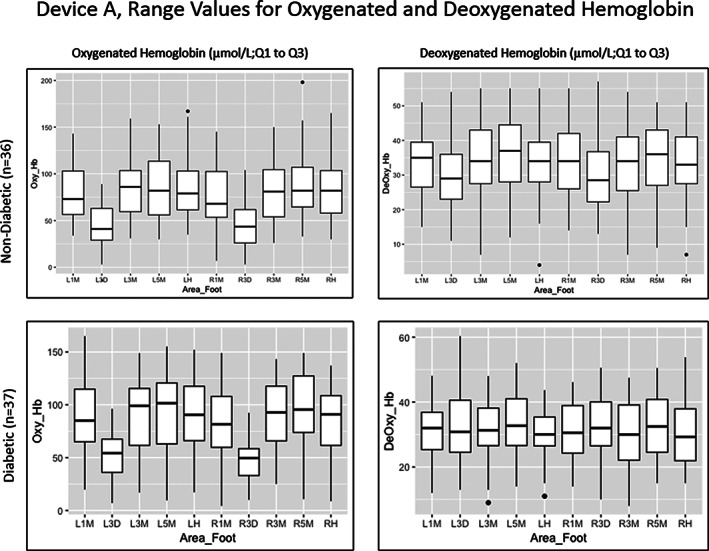
Range values for oxygenated and deoxygenated haemoglobin in both study groups using Device A. Left and right plantar 1st (L1M, R1M), 3rd (L3M, R3M), and 5th (L5M, R5M) metatarsophalangeal joints; left and right dorsal 3rd metatarsophalangeal joints (L3D, R3D) and the left and right heel (LH, RH)
FIGURE 2.
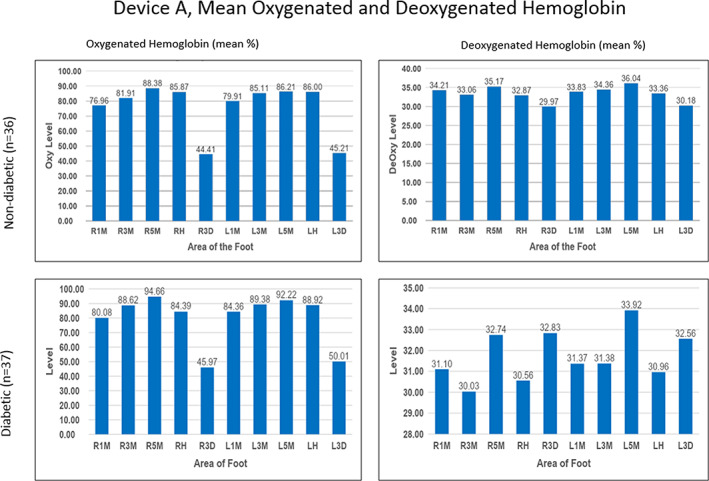
Mean oxygenated and deoxygenated haemoglobin in both study groups using Device A. Left and right plantar 1st (L1M, R1M), 3rd (L3M, R3M), and 5th (L5M, R5M) metatarsophalangeal joints; left and right dorsal 3rd metatarsophalangeal joints (L3D, R3D) and the left and right heel (LH, RH)
The diabetic group demonstrated similar value ranges. Device A values had HT‐Oxy levels ranging from 4.3 to 165 μmol/L and HT‐Deoxy levels ranging from 8 to 60.33 μmol/L. The mean HT‐Oxy values were approximately 81 to 96 μmol/L in the plantar region and 47 to 51 μmol/L in the dorsal region. The mean HT‐Deoxy values ranged from 30 to 33 μmol/L in both the plantar and dorsal regions of the foot. Noticeably, HT‐Oxy levels were higher than HT‐Deoxy values in both study groups in all measured points of the feet.
Device B also showed a wide range of values across all areas of the feet in both study groups (Figures 3 and 4). Levels of HT‐Oxy ranged from 3 to 146 μmol/L and HT‐Deoxy ranged from 1 to 189 μmol/L in the non‐diabetic group across all areas of the feet. In the diabetic group, HT‐Oxy levels ranged from 4 to 247 μmol/L and HT‐Deoxy levels ranged from 0 to 178 μmol/L across all areas of the feet. In addition, average levels of HT‐Oxy were approximately 76 μmol/L in the plantar region and 35 μmol/L in the dorsal region.
FIGURE 3.
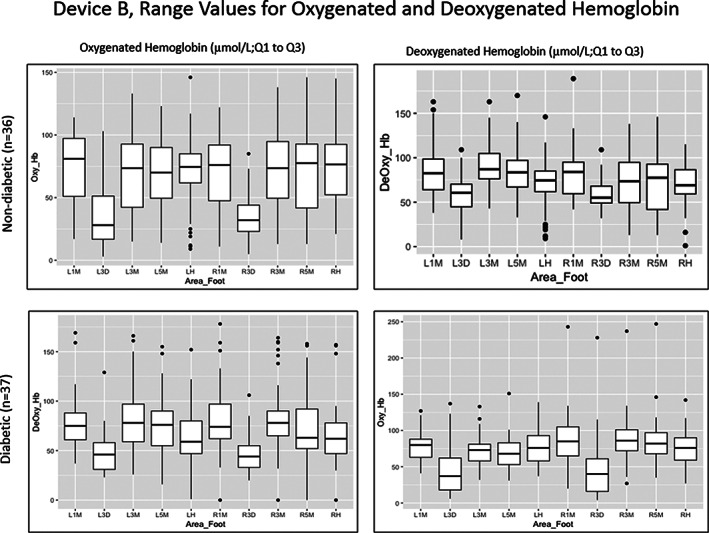
Range values for oxygenated and deoxygenated haemoglobin in both study groups using Device B . Left and right plantar 1st (L1M, R1M), 3rd (L3M, R3M), and 5th (L5M, R5M) metatarsophalangeal joints; left and right dorsal 3rd metatarsophalangeal joints (L3D, R3D) and the left and right heel (LH, RH)
FIGURE 4.
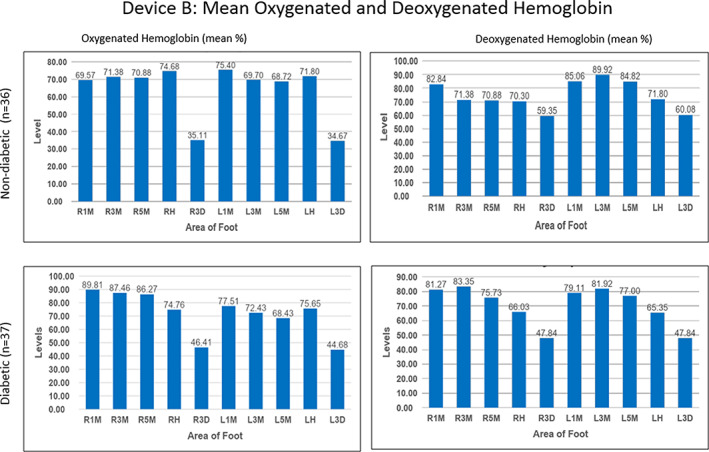
Mean oxygenated and deoxygenated haemoglobin in both study groups using Device B. Left and right plantar 1st (L1M, R1M), 3rd (L3M, R3M), and 5th (L5M, R5M) metatarsophalangeal joints; left and right dorsal 3rd metatarsophalangeal joints (L3D, R3D) and the left and right heel (LH, RH)
In contrast to Device A, HT‐Deoxy values calculated by Device B demonstrated a separation in average values between the plantar and dorsal regions of the feet with values between 70 and 90 μmol/L for the plantar region and 60 μmol/L for the dorsal region in the normal group. Similarly, the diabetic group had an average HT‐Oxy value of approximately 69 to 90 μmol/L in the plantar foot and 45 μmol/L in the dorsal region with the HT‐Deoxy average of approximately 66 to 83 μmol/L in the plantar and 48 μmol/L in the dorsal region.
Comparing Devices A and B, oxygenation values were significantly different (P < .05) across all areas of the feet for all HT‐Deoxy and some HT‐Oxy values (left 5th MTP joint in diabetics and right 5th MTP joint, left heel, left 3rd, and 5th MTP joint in normal).
Mean HT‐Oxy and HT‐Deoxy values were compared between both study groups to determine whether there were any unique differences across measured points of the feet. Device A showed no statistical difference between the two groups; however, Device B resulted in statistical differences in five areas of the feet. The left and right dorsal 3rd MTP joint showed a statistical difference in the HT‐Deoxy levels (P < .05) with a higher mean HT‐Deoxy level in the normal study group compared to the mean HT‐Deoxy level in the diabetic group. The right foot 1st, 3rd, and 5th MTP joint showed a statistical difference in the HT‐Oxy levels (P < .05) with a higher mean HT‐Oxy level in the diabetic group compared to the mean HT‐Oxy level in the non‐diabetic group. No adverse events were reported during this study.
4. DISCUSSION
Although hyperspectral imaging shows great promise in providing quantitative assessments for microvascular perfusion, both subject groups showed wide variability in their range of HT‐Oxy and HT‐Deoxy levels. Statistically significant differences between both subject groups were found in the HyperView data sets, but not in those of the KD203. Both devices provided statistically different mean values in HT‐Deoxy levels across all measured areas and in HT‐Oxy levels across some. A contributing factor may be the differences in wavelength that each device uses for image capture. Because the KD203 utilises near‐IR and the HyperView utilises visible light, the absorption coefficient for different biomolecular interferences may differ. A solution to directly compare these devices’ data sets would be to standardise the two values to each other, so that observed disparities and their contributing factors can be identified and analysed.
Other studies that have used this technology have noted a discrepancy in oxygenation values with those who have a higher melanin concentration in their skin. 12 , 13 Although melanin's coefficient of absorption in the electromagnetic spectrum is low relative to haemoglobin, these devices’ software algorithms are unable to exclude interference from the absorption of melanin, which may necessitate grouping subjects according to Fitzpatrick Skin Types in subsequent studies. 13 The KD203 gives an option to do a ‘melanin correction’ for the image; however, because not all images are corrected, the difference in values may be because of the ‘melanin correction’ option, and not because of any medical indications. HyperView tries to account for this issue by normalising for melanin absorption, however, study results show a notable difference between plantar and dorsal regions of the feet. Until software algorithms are further fine‐tuned, grouping between Fitzpatrick Skin Types I to IV and V to VI in standardising oxygenation values of skin perfusion is an alternative method when analysing data.
Although the study had completed a comparison of HT‐Oxy and HT‐Deoxy in diabetic and non‐diabetic groups, the results may not demonstrate an accurate representation of the clinical and physiological differences between both groups. The mean age between the two groups is statistically different and indicates that age may be a contributing factor for differences in skin oxygenation perfusion values. With age being an important risk factor for type II diabetes, it will be important to include non‐diabetic subjects who are older than 45 in order to control for age when continuing this study. 14
5. CONCLUSION
This study's methodology is novel in that it used two hyperspectral imaging modalities to quantitatively assess microvascular perfusion in diabetic and non‐diabetic patients and determine the validity of the devices' results. The results of the study show that the HyperView may be a more useful clinical device in the assessment of diabetic foot microvascular status, but also raise questions as to why there were no significant differences in the KD203 data sets. Further studies that include concurrent clinical outcomes; control for age, ambient and skin temperature, and Fitzpatrick skin type; and group diabetic subjects by The University of Texas Diabetic Foot Risk Classification System and their current HbA1c values are necessary to demonstrate the clinical use of hyperspectral imaging devices to effectively and consistently predict changes in diabetic patients’ microvascular blood flow prior to chronic wound development.
CONFLICT OF INTEREST
The authors declare no potential conflict of interest.
ACKNOWLEDGEMENT
Special thank you to GHUCCTS program director Jason Umans MD, PhD and administrative director and coordinator Cyndi Campbell and Rebecca Ho for their support. This study was supported by the Department of Plastic Surgery, MedStar Georgetown University Hospital. There are no financial disclosures, commercial associations, or any other conditions posing a conflict of interest to report.
Lee CJ, Walters E, Kennedy CJ, et al. Quantitative Results of Perfusion Utilising Hyperspectral Imaging on Non‐diabetics and Diabetics: A Pilot Study. Int Wound J. 2020;17:1809–1816. 10.1111/iwj.13469
Funding information Georgetown University
DATA AVAILABILITY STATEMENT
Data available on request from the authors.
REFERENCES
- 1. Diabetes . World Health Organization, www.who.int/news-room/fact-sheets/detail/diabetes.
- 2. IDF Diabetes Atlas Ninth Edition 2019. International Diabetes Federation, www.idf.org/aboutdiabetes/what-is-diabetes/facts-figures.html.
- 3. Pendsey SP. Understanding diabetic foot. Int J Diab Developing Countries. 2010;30(2):75‐79. [DOI] [PMC free article] [PubMed] [Google Scholar]
- 4. Margolis DJ, Malay DS, Hoffstad OJ, et al. Economic burden of diabetic foot ulcers and amputations: data points #3. Data Points Publication Series [Internet]. Rockville (MD): Agency for Healthcare Research and Quality (US); 2011. https://www.ncbi.nlm.nih.gov/books/NBK65152/. [PubMed] [Google Scholar]
- 5. National Diabetes Statistics Report. Centers for Disease Control and Prevention . (2017). Atlanta, GA: Centers for Disease Control and Prevention, US Department of Health and Human Services. [Google Scholar]
- 6. HyperMed. HyperView Product Overview [Brochure] . https://hypermed.com/wp-content/uploads/101-D077_Product-Overview_Rev.-B1-1.pdf 2017.
- 7. Rac‐Albu M, Iliuta L, Guberna SM, Sinescu C. The role of ankle‐brachial index for predicting peripheral arterial disease. Maedica. 2014;9(3):295‐302. [PMC free article] [PubMed] [Google Scholar]
- 8. Khaodhiar L, Dinh T, Schomacker KT. The use of medical hyperspectral technology to evaluate microcirculatory changes in diabetic foot ulcers and to predict clinical outcomes. Diabetes Care. 2007;30(4):903‐910. [DOI] [PubMed] [Google Scholar]
- 9. Nouvong A, Hoogwerf B, Mohler E, Davis B, Tajaddini A, Medenilla E. Evaluation of diabetic foot ulcer healing with hyperspectral imaging of oxyhemoglobin and deoxyhemoglobin. Diabetes Care. 2009;32(11):2056‐2061. [DOI] [PMC free article] [PubMed] [Google Scholar]
- 10. Chin JA, Wang EC, Kibbe MR. Evaluation of hyperspectral technology for assessing the presence and severity of peripheral artery disease. J Vasc Surg. 2011;54(6):1679‐1688. [DOI] [PubMed] [Google Scholar]
- 11. Yudovsky D, Nouvong A, Schomacker K, Pilon L. Assessing diabetic foot ulcer development risk with hyperspectral tissue oximetry. J Biomed Opt. 2011;16(2):026009. [DOI] [PMC free article] [PubMed] [Google Scholar]
- 12. Neville R, Gupta S. Establishment of normative perfusion values using Hyperspectral tissue oxygenation mapping technology. Vasc Dis Manage. 2009;6(5):156‐161. [Google Scholar]
- 13. Bowen RE, Treadwell GRN, Goodwin MRRT. Correlation of near infrared spectroscopy measurements of tissue oxygen saturation with transcutaneous pO2 in patients with chronic wounds. SM Vasc Med. 2016;1(2):1006. [Google Scholar]
- 14. Pippitt K, Li M, Gurgle HE. Diabetes mellitus: screening and diagnosis. Am Fam Physician. 2016;93(2):103‐109. [PubMed] [Google Scholar]
Associated Data
This section collects any data citations, data availability statements, or supplementary materials included in this article.
Data Availability Statement
Data available on request from the authors.


