

ABSTRACT
Background
Nonalcoholic fatty liver disease (NAFLD) is the most prevalent liver disease in the United States. Food-insecure individuals often depend on low-cost, energy-dense but nutritionally poor foods, resulting in obesity and chronic diseases related to NAFLD.
Objectives
To determine whether food insecurity is associated with NAFLD in a cohort of HIV and hepatitis C virus (HCV) infected and uninfected adults.
Methods
We conducted a cross-sectional analysis of low-income, middle-aged adults from the Miami Adult Studies on HIV (MASH) cohort without a history of excessive alcohol consumption. Food security was assessed with the USDA's Household Food Security Survey. MRIs were used to assess liver steatosis and fibrosis. Metabolic parameters were assessed from fasting blood, anthropometrics, and vitals.
Results
Of the total 603 participants, 32.0% reported food insecurity. The prevalences of NAFLD, fibrosis, and advanced fibrosis were 16.1%, 15.1%, and 4.6%, respectively. For every 5 kg/m2 increase in BMI, the odds of NAFLD increased by a factor of 3.83 (95% CI, 2.37–6.19) in food-insecure participants compared to 1.32 (95% CI, 1.04–1.67) in food-secure participants. Food insecurity was associated with increased odds for any liver fibrosis (OR, 1.65; 95% CI, 1.01–2.72) and advanced liver fibrosis (OR, 2.82; 95% CI, 1.22–6.54), adjusted for confounders. HIV and HCV infections were associated with increased risks for fibrosis, but the relationship between food insecurity and liver fibrosis did not differ between infected and uninfected participants.
Conclusions
Among low-income, middle-aged adults, food insecurity exacerbated the risk for NAFLD associated with a higher BMI and independently increased the risk for advanced liver fibrosis. People who experience food insecurity, particularly those vulnerable to chronic diseases and viral infections, may be at increased risk for liver-related morbidity and mortality. Improving access to adequate nutrition and preventing obesity among low-income groups may lessen the growing burden of NAFLD and other chronic diseases.
Keywords: food insecurity, NAFLD, liver fibrosis, HIV, MR elastography, magnetic resonance imaging, vulnerable populations, substance abuse
Introduction
Food insecurity (FI) is a socioeconomic condition in which households experience inadequate access to sufficient and nutritious foods (1). Individuals who experience FI often depend on low-cost, energy-dense but nutritionally poor foods, usually consisting of refined carbohydrates, added sugars, fats, and sodium (2). Food insecurity is also associated with overconsumption when food is available (3, 4), but not necessarily with lower energy intakes (5). These factors result in FI contributing to obesity and associated chronic diseases (6, 7). Food insecurity is reported by 14.3 million (11.1%) households in the United States, disproportionately affecting minorities and other marginalized groups (1, 8).
Nonalcoholic fatty liver disease (NAFLD) has become the most prevalent liver disease in the United States and other Western countries, with a rise in prevalence that parallels those of obesity (9) and metabolic syndrome (MetS) (10). Between a quarter and a third of all US adults (11–13) are estimated to have NAFLD, which encompasses nonalcoholic fatty liver (liver steatosis), nonalcoholic steatohepatitis (NASH), and cirrhosis in the absence of significant alcohol consumption or hereditary disorders (14). Chronic hepatocyte injury caused by hepatitis infection, heavy drinking, and NAFLD/NASH leads to liver fibrosis, or the scarring of liver tissue. Even after a sustained virological response to chronic hepatitis C, older age and a high BMI are associated with persisting fibrosis (15). Advanced liver fibrosis can result in liver failure, portal hypertension, and cirrhosis, which may require liver transplantation. While the relationship between FI and liver diseases has remained largely unexplored, Golovaty et al. (16) found an association between FI and increased risks of NAFLD and advanced liver fibrosis among low-income US adults.
People living with HIV (PLWH) are among those disproportionately affected by socioeconomic hardships and stigma (17), including FI (18–21). Additionally, PLWH are at increased risk for chronic diseases (22, 23), including liver diseases (24). Moreover, due to several compounding factors, liver disease progression is accelerated in PLWH (25). As viral hepatitis infections are increasingly treated, the burden of fatty liver disease among PLWH has garnered recognition (25). In PLWH, 30–65% are estimated to have NAFLD (26, 27) and 8–17% are estimated to have liver fibrosis (28, 29). Both in the general population (30, 31) and in PLWH (32, 33), FI has been linked to substance abuse, which in turn may result in an increased risk for liver disease (34). We have shown that cocaine use is a risk factor for liver fibrosis (35–37) and mortality in PLWH (36).
While liver biopsy is considered the gold standard for determining NAFLD and liver fibrosis, it is costly and invasive, with potential health complications in addition to high inter- and intra-observer variability (38). Magnetic resonance (MR)-based assessments, such as MRI-derived proton density fat fraction (PDFF) and MR elastography (MRE), are currently regarded as the most accurate, noninvasive techniques for assessments of liver steatosis and fibrosis, respectively (39–42). The objective of this study was to determine whether FI is associated with NAFLD using accurate, non-invasive MR technology in a cohort of HIV and/or hepatitis C virus (HCV) infected and uninfected adults.
Methods
Study subjects
The study consisted of a cross-sectional analysis of baseline data from the Miami Adult Studies on HIV (MASH) cohort, which follows people living with and without HIV for patterns of substance use and health disparities, with a focus on liver disease and related comorbidities. From October of 2016 through February of 2020, 1031 MASH cohort participants had completed a baseline assessment. Participants in the MASH cohort are 40 years of age or older and seronegative for hepatitis B virus. This study was approved by the Florida International University Institutional Review Board and all participants provided written consent for participation in the study, release of medical information, and MR assessments. The exclusion criteria consisted of contraindications for MR [e.g., claustrophobia, ferromagnetic implant, poor fit due to body size (waist circumference greater than ∼55 inches/140 cm)], self-reported current or prior alcohol consumption of more than 14 drinks per week for women and 21 for men (14), underweight, and documented inherited liver disease (e.g., Wilson's disease) from medical records.
Food insecurity
Food insecurity was determined with the USDA's 18-item Household Food Security Survey, which assesses a respondent's perceived food sufficiency and adequacy, food-related anxiety, and instances of hunger that occurred in the household during the past 12 months (43). The total sum of affirmative responses was used to categorize food security status as food-secure (scores 0−2) or food-insecure (scores ≥3). We further explored FI by levels of severity as follows: full food security (score of 0), marginal food security (scores 1−2), low food security (scores 3−7 for households with children and 3−5 for households without children), and very low food security (VLFS; scores ≥8 for households with children and ≥6 for households without children).
Outcomes
The primary endpoints of this study were the presence of nonalcoholic fatty liver (steatosis) and fibrosis. Liver fat content was assessed via MRI-PDFF. Liver fibrosis was assessed via liver stiffness (LS) measurement by MRE. These were conducted on a 3T Siemens MAGNETOM Prisma scanner. NAFLD was considered present if MRI-PDFF was >5% (14). Liver fibrosis was defined as LS ≥ 2.9 kPa, which is consistent with histologically proven liver fibrosis Stage 1 or higher, and advanced fibrosis was defined as LS ≥ 3.8 kPa, consistent with histologically proven liver fibrosis Stage 3 or higher (44).
Covariates
Demographic data were self-reported. Substance use was determined by self-report and urine drug screen, including use of tobacco, marijuana, cocaine, methamphetamines, and opiates. Alcohol consumption was determined as drinks per week from self-report. Anthropometrics and blood pressure were measured by trained research staff. Fasting blood samples were used to evaluate serum concentrations of glucose, triglycerides (TGs), and liver enzymes. Insulin resistance was measured with the triglyceride and glucose (TyG) index (45, 46), calculated as: Ln[fasting triglycerides (mg/dL) × fasting glucose (mg/dL)/2].
HIV and HCV viral loads and CD4 cell counts were abstracted from medical records. HIV viral suppression was defined as a plasma HIV RNA level < 200 copies/mL. BMI was calculated and expressed in 5 kg/m2 increments. Obesity was defined as having a BMI ≥ 30 kg/m2. The criteria for MetS consisted of the presence of any 3 out of the following: abdominal obesity (waist circumference ≥35 inches for women and ≥40 inches for men), hypertriglyceridemia (TG ≥ 150 mg/dL), reduced high-density lipoprotein (HDL) cholesterol (≤50 mg/dL for women and ≤40 mg/dL for men), hypertension (≥130 mm Hg systolic or ≥85 mm Hg diastolic blood pressure), or hyperglycemia (fasting plasma glucose level ≥ 100 mg/dL) (47).
Statistical analysis
Descriptive statistics consisted of chi-square tests for categorical variables and a t-test (or nonparametric Wilcoxon rank-sum test) for continuous variables; data were reported as n (%), mean ± SD, or median (IQR). Univariate and multivariable binary logistic regressions were performed for NAFLD, any liver fibrosis, and advanced fibrosis; estimates are reported as ORs or adjusted odds ratios (AORs) and 95% CIs. Candidates for multivariable regression models included HIV infection, HCV infection, substance use, and metabolic risk factors. Variables with P < 0.25 in univariate analyses were selected for multivariable analyses. MetS and TyG index score, if significant in univariate analyses, were included in separate multivariable models in order to avoid multicollinearity, since these are composites of other confounders. In multivariable analyses, variables were removed from the model until only those factors with P < 0.05 remained. Potential interactions between FI and other confounders were explored by including interaction terms in the multivariable models. Potentially important sociodemographic confounders and alcohol consumption were retained in the models to obtain estimates adjusted for these confounders. All data analyses were generated using SAS software, Version 9.4. Results were considered statistically significant at P < 0.05 (2-sided).
Results
Study population
The characteristics of the study population are shown in Table 1, consisting of 603 adults. Out of the total 1031 MASH cohort participants at the time this analysis was conducted, 428 were excluded for MR scan ineligibility (n = 354), excessive alcohol consumption (n = 52), being underweight (n = 17), or missing important data (n = 5; Supplemental Figure 1). Excluded participants were less likely to be male and infected with HIV or HCV (P < 0.05), but no other characteristics significantly differed, including FI. Participants were 55.2 ± 6.2 years old and predominantly male (56.0%) and black non-Hispanic (60.7%). Most were unmarried (89.4%) and without children (91.7%), with 1.8 ± 1.3 members per household. In total, 51.4% of participants were disabled and 36.0% were otherwise unemployed. Accordingly, 76.6% of participants lived in households that fell under the Federal Poverty Level, with 92.5% falling under 185% and all below 200% of poverty.
TABLE 1.
Sample characteristics by food security status
| Total | Food secure | Food insecure | |||
|---|---|---|---|---|---|
| n = 603 | n = 410 | n = 193 | |||
| n (%) | n (%) | n (%) | |||
| Characteristics | Category | Mean ± SD | Mean ± SD | Mean ± SD | P value |
| Age, years | — | 55.5 ± 6.2 | 55.6 ± 6.2 | 55.2 ± 6.0 | 0.39 |
| Gender | Male | 338 (56.0) | 234 (57.1) | 104 (53.9) | 0.46 |
| Race/ethnicity | Black non-Hispanic | 366 (60.7) | 256 (62.4) | 110 (57.0) | 0.35 |
| White Hispanic | 130 (21.6) | 86 (21.0) | 44 (22.8) | ||
| White non-Hispanic | 55 (9.1) | 32 (7.8) | 23 (11.9) | ||
| Multiracial/other | 52 (8.6) | 36 (8.8) | 16 (8.3) | ||
| Marital status | Married | 64 (10.6) | 45 (11.0) | 19 (9.8) | 0.53 |
| Widowed, divorced, or separated | 203 (33.7) | 132 (32.2) | 71 (36.6) | ||
| Single | 336 (55.7) | 233 (56.8) | 103 (53.4) | ||
| Household size | — | 1.8 ± 1.3 | 1.8 ± 1.3 | 1.7 ± 1.2 | 0.46 |
| Children in household | — | 50 (8.3) | 32 (7.8) | 18 (9.3) | 0.53 |
| Education | Less than high school | 240 (39.8) | 169 (41.2) | 71 (36.8) | 0.24 |
| High school or GED | 173 (28.7) | 109 (26.6) | 64 (33.2) | ||
| Some college or more | 190 (31.5) | 132 (32.2) | 58 (30.1) | ||
| Employment | Employed | 76 (12.6) | 59 (14.4) | 17 (8.8) | 0.11 |
| Disabled | 310 (51.4) | 202 (49.3) | 108 (56.0) | ||
| Otherwise unemployed | 217 (36.0) | 149 (36.3) | 68 (35.2) | ||
| Income | Less than $10,000 | 336 (55.7) | 213 (52.0) | 123 (63.4) | 0.01 |
| $10,000–$20,000 | 164 (27.2) | 118 (28.8) | 46 (23.8) | ||
| $20,000–$30,000 | 56 (9.3) | 38 (9.3) | 18 (9.3) | ||
| $30,000 or more | 47 (7.8) | 41 (10.0) | 6 (3.1) | ||
| Poverty | Below federal poverty level | 462 (76.6) | 303 (73.9) | 159 (82.4) | 0.02 |
| Substance use | Tobacco | 298 (49.4) | 193 (47.1) | 105 (54.4) | 0.09 |
| Alcohol, drinks/week | 0 (0–1)1 | 0 (0–1)1 | 1 (1–2)1 | 0.45 | |
| Cocaine | 225 (37.3) | 143 (34.9) | 82 (42.5) | 0.07 | |
| Cannabis | 166 (27.5) | 108 (26.3) | 58 (30.1) | 0.34 | |
| Opiates | 64 (10.6) | 43 (10.5) | 21 (10.8) | 0.89 | |
| Infection | HIV | 263 (43.6) | 185 (45.1) | 78 (40.4) | 0.28 |
| ART | 259 (98.5) | 183 (98.9) | 76 (97.4) | 0.58 | |
| HIV viral load < 200 copies/mL | 222 (84.7) | 160 (87.0) | 62 (79.5) | 0.12 | |
| CD4, cells/mL | 597.8 ± 368.0 | 610.5 ± 384.0 | 566.6 ± 326.3 | 0.42 | |
| HCV | 144 (23.9) | 94 (22.9) | 50 (25.9) | 0.42 | |
| Metabolic | BMI, kg/m2 | 29.5 ± 6.1 | 29.6 ± 6.2 | 29.2 ± 6.0 | 0.55 |
| Obese, BMI ≥ 30 kg/m2 | 250 (41.5) | 174 (42.4) | 76 (39.4) | 0.48 | |
| MetS | 127 (21.1) | 89 (21.7) | 38 (19.7) | 0.57 | |
| Hyperglycemia | 133 (22.1) | 89 (21.7) | 44 (22.8) | 0.76 | |
| Hypertriglyceridemia | 140 (23.2) | 89 (21.7) | 51 (26.4) | 0.20 | |
| Hypertension | 331 (54.9) | 228 (55.6) | 103 (53.4) | 0.60 | |
| Reduced HDL | 63 (10.5) | 45 (11.0) | 18 (9.3) | 0.53 | |
| Abdominal obesity | 317 (52.6) | 210 (51.2) | 107 (55.4) | 0.33 | |
| TyG index score | 8.5 ± 0.6 | 8.5 ± 0.6 | 8.5 ± 0.6 | 0.59 | |
| Hepatic | ALT | 18 (14–27)1 | 19 (14–27)1 | 18 (14–27)1 | 0.83 |
| AST | 22 (17–29)1 | 22 (17–29)1 | 21 (17–27)1 | 0.55 | |
| AST/ALT | 1.23 ± 0.4 | 1.24 ± 0.4 | 1.22 ± 0.4 | 0.49 |
Median (interquartile range).
Tests for group differences were performed with the chi-square test for categorical outcomes and a t-test (or Wilcoxon rank-sum) for continuous outcomes.
Abbreviations: ALT, alanine aminotransferase; ART, antiretroviral therapy; AST, aspartate aminotransferase; HCV, hepatitis C virus; HDL, high-density lipoprotein; MetS, metabolic syndrome; TyG, triglyceride and glucose.
A total of 263 (43.6%) participants were living with HIV, 144 (23.9%) were seropositive for HCV, 64 (10.6%) were coinfected with both HIV and HCV, and 260 (43.1%) were HIV/HCV uninfected. Of those participants living with HIV, 98.5% reported using antiretroviral therapy and 84.7% were virally suppressed.
Food insecurity, metabolic parameters, and liver outcomes
A third of participants (32.0%) reported FI, with 87 (14.4%) and 106 (17.6%) having low and very low food security, respectively, and an additional 107 (17.7%) reporting marginal food security. Food-insecure participants had lower incomes than those who were food secure. Higher proportions of food-insecure participants than of food-secure participants tended to be smokers (P = 0.09) and cocaine users (P = 0.07). Participants with VLFS were more likely to use more than 1 illicit substance than food-secure participants (OR = 1.63; 95% CI, 1.11–2.39; P = 0.013). No other characteristic significantly differed between the 2 groups (Table 1). Most of the participants were overweight (33.6%) or obese (41.5%), and 21.1% met the criteria for MetS. No significant difference was observed between food-secure and food-insecure individuals in any of the metabolic parameters evaluated.
There were 96 (16.1%) participants with NAFLD, 91 (15.1%) with liver fibrosis, and 28 (4.6%) with advanced fibrosis. As shown in Figure 1, food-insecure individuals had higher proportions of advanced fibrosis (7.8 vs. 3.2%, respectively; P = 0.01), as well as a tendency for any liver fibrosis (19.2 vs. 13.2%, respectively; P = 0.06), compared to food-secure individuals, but the frequency of NAFLD did not significantly differ between groups (16.0 vs. 16.1%, respectively; P = 0.97). However, FI was associated with a slightly higher but significant mean liver fat content among obese participants (4.8 ± 2.0 vs. 3.8 ± 1.9% for food insecure and secure, respectively; P = 0.03) but not among nonobese participants [2.5 ± 1.5 vs. 2.8 ± 1.8% for the food insecure and secure, respectively (P = 0.18); P = 0.001 for FI–obesity interaction]. No significant differences were observed in serum values for aspartate aminotransferase (AST), alanine aminotransferase (ALT), and the AST/ALT ratio between food-secure and -insecure participants or by levels of FI.
FIGURE 1.

Comparison of liver parameters by food security status. Of the 603 MASH cohort participants, 97 (16.1%) had nonalcoholic fatty liver, 91 (15.1%) had liver fibrosis, and 28 (4.6%) had advanced fibrosis. Liver fat content was assessed via MRI-PDFF. Liver fibrosis was assessed via LS measurement by MRE. These were conducted on a 3T Siemens MAGNETOM Prisma scanner. Nonalcoholic fatty liver was considered present if the MRI-PDFF was >5%. Liver fibrosis was defined as LS ≥ 2.9 kPa, which is consistent with liver fibrosis Stage 1 or higher, and advanced fibrosis was defined as LS ≥ 3.8 kPa, which is consistent with liver fibrosis Stage 3 or higher. Chi-square tests were performed to test for differences between food-secure and food-insecure participants. *P < 0.05; ^P < 0.1. Abbreviations: LS, liver stiffness; MRE, magnetic resonance elastography; NAFLD, nonalcoholic fatty liver disease; PDFF, proton density fat fraction.
Nonalcoholic fatty liver
Univariate analyses for NAFLD risk are reported in Table 2. Food insecurity was not independently associated with NAFLD. The use of tobacco, cocaine, and cannabis were significantly associated with decreased odds for NAFLD. People living with HIV or HCV showed tendencies for lower odds of steatosis compared to uninfected individuals. Of the metabolic risk factors, BMI and obesity, MetS, hyperglycemia, hypertriglyceridemia, abdominal obesity, and TyG index were associated with NAFLD. Hypertension and reduced HDL were not significantly associated with NAFLD.
TABLE 2.
Univariate analyses
| NAFLD, n = 96 | Any fibrosis, n = 91 | Advanced fibrosis, n = 28 | |||||
|---|---|---|---|---|---|---|---|
| Parameter | Category | OR (95% CI) | P value | OR (95% CI) | P value | OR (95% CI) | P value |
| Food insecurity | Food insecure vs. secure | 0.99 (0.62–1.58) | 0.97 | 1.56 (0.99–2.47) | 0.06 | 2.57 (1.20–5.52) | 0.02 |
| Marginal vs. full security | 0.92 (0.50–1.70) | 0.79 | 0.55 (0.18–1.73) | 0.31 | 1.81 (0.58–5.65) | 0.31 | |
| Low vs. full security | 0.67 (0.33–1.39) | 0.29 | 1.51 (0.45–5.13) | 0.51 | 2.73 (0.92–8.10) | 0.07 | |
| Very low vs. full security | 1.28 (0.73–2.26) | 0.39 | 1.89 (0.61–5.85) | 0.27 | 3.42 (1.29–9.11) | 0.01 | |
| Substance use | Tobacco | 0.47 (0.30–0.74) | 0.001 | 0.95 (0.61–1.49) | 0.83 | 0.76 (0.35–1.63) | 0.48 |
| Alcohol, drinks/week | 1.03 (0.97–1.09) | 0.40 | 0.97 (0.91–1.05) | 0.45 | 1.01 (0.90–1.12) | 0.93 | |
| Cocaine | 0.50 (0.30–0.81) | 0.006 | 0.85 (0.53–1.35) | 0.49 | 0.93 (0.42–2.05) | 0.86 | |
| Cannabis | 0.51 (0.29–0.88) | 0.02 | 1.21 (0.74–1.96) | 0.45 | 0.87 (0.36–2.09) | 0.76 | |
| Opiates | 0.84 (0.40–1.76) | 0.65 | 1.34 (0.69–2.63) | 0.39 | 1.43 (0.48–4.26) | 0.52 | |
| Infection | HIV | 0.73 (0.47–1.14) | 0.16 | 1.71 (1.09–2.68) | 0.02 | 1.31 (0.61–2.80) | 0.49 |
| HCV | 0.81 (0.48–1.38) | 0.44 | 4.84 (3.03–7.72) | <0.0001 | 13.62 (5.40–34.32) | <0.0001 | |
| Metabolic | BMI, per 5 kg/m2 | 1.75 (1.46–2.09) | <0.0001 | 0.90 (0.75–1.09) | 0.28 | 0.79 (0.56–1.10) | 0.16 |
| Obesity | 3.71 (2.33–5.89) | <0.0001 | 0.82 (0.52–1.29) | 0.39 | 0.78 (0.35–1.71) | 0.53 | |
| MetS | 3.95 (2.49–6.28) | <0.0001 | 1.33 (0.79–2.23) | 0.29 | 1.02 (0.41–2.58) | 0.97 | |
| Hyperglycemia | 2.92 (1.84–4.63) | <0.0001 | 1.62 (0.98–2.67) | 0.06 | 2.04 (0.92–4.54) | 0.08 | |
| Hypertriglyceridemia | 2.64 (1.67–4.18) | <0.0001 | 0.99 (0.58–1.68) | 0.97 | 0.54 (0.18–1.58) | 0.26 | |
| Abdominal obesity | 3.47 (2.11–5.71) | <0.0001 | 0.82 (0.53–1.28) | 0.38 | 0.66 (0.31–1.43) | 0.29 | |
| Hypertension | 1.41 (0.91–2.20) | 0.13 | 1.24 (0.79–1.95) | 0.36 | 1.10 (0.51–2.37) | 0.81 | |
| Reduced HDL | 1.42 (0.74–2.72) | 0.28 | 1.91 (1.02–3.58) | 0.04 | 1.94 (0.71–5.29) | 0.19 | |
| TyG index | 2.72 (1.95–3.79) | <0.0001 | 1.45 (1.03–2.03) | 0.03 | 1.28 (0.72–2.26) | 0.39 | |
Data are for NAFLD (liver fat > 5% via MRI-PDFF), fibrosis (LS ≥ 2.9 kPa via MRE), and advanced fibrosis (LS ≥ 3.8 kPa via MRE; n = 603). Statistical tests were performed using univariate logistic regressions and reported as ORs with 95% CIs. Abbreviations: HCV, hepatitis C virus; HDL, high-density lipoprotein; LS, liver stiffness; MetS, metabolic syndrome; MRE, magnetic resonance elastography; NAFLD, nonalcoholic fatty liver disease; PDFF, proton density fat fraction; TyG, triglyceride and glucose.
Multivariable analyses, shown in Table 3, revealed a significant interaction effect between FI and BMI on the risk for NAFLD (P < 0.0001). For every 5-unit increase in BMI, the odds of NAFLD were 3.83 (95% CI, 2.37–6.19; P < 0.0001) times higher in food-insecure participants compared to 1.32 (95% CI, 1.04–1.67; P = 0.02) times higher in food-secure participants. This is visually represented in Figure 2, which compares the probability for NAFLD between food-secure and food-insecure individuals; FI was associated with reduced odds for NAFLD at lower BMIs and with increased odds for NAFLD at higher BMIs. To better illustrate the relationship between FI and NAFLD given the interaction with BMI, Table 3 also shows results stratified by the presence of obesity (P = 0.003 for interaction). Food insecurity, compared to food security, was associated with significantly lower odds of NAFLD in nonobese participants (AOR, 0.30; 95% CI, 0.11–0.83; P = 0.02), and a trend was observed for higher odds of liver steatosis in obese participants (AOR, 1.85; 95% CI, 0.98–3.53; P = 0.06).
TABLE 3.
Multivariable analyses
| Parameter | Condition | AOR (95% CI)1 | P value |
|---|---|---|---|
| Hyperglycemia | — | 2.48 (1.46–4.20) | 0.0008 |
| Hypertriglyceridemia | — | 2.18 (1.29–3.67) | 0.004 |
| MetS2 | — | 3.20 (1.92–5.32) | <0.0001 |
| TyG index2 | — | 2.57 (1.78–3.71) | <0.0001 |
| Alcohol, drinks/week | — | 1.06 (0.99–1.13) | 0.08 |
| BMI, per 5 kg/m2 | × Food insecurity | (interaction) | <0.0001 |
| Food-secure | 1.32 (1.04–1.67) | 0.02 | |
| Food-insecure | 3.83 (2.37–6.19) | <0.0001 | |
| Food insecurity | BMI = 25.0 kg/m2 | 0.20 (0.07–0.57) | 0.002 |
| BMI = 30.0 kg/m2 | 0.59 (0.31–1.14) | 0.12 | |
| BMI = 35.0 kg/m2 | 1.91 (1.02–3.59) | 0.04 | |
| × Obesity, BMI ≥ 30 3 | (interaction) | 0.003 | |
| Nonobese | 0.30 (0.11–0.83) | 0.02 | |
| Obese | 1.85 (0.98–3.53) | 0.06 |
Data are for NAFLD (liver fat > 5%), determined by MRI-PDFF (n = 603). Abbreviations: AOR, adjusted odds ratio; MetS, metabolic syndrome; NAFLD, nonalcoholic fatty liver disease; PDFF, proton density fat fraction; TyG, triglyceride and glucose.
The multivariable logistic regression model examined the relationship between food insecurity, BMI, and NAFLD, adjusting for age, sex, race/ethnicity, household size, hyperglycemia, and hypertriglyceridemia, and included an interaction term for food insecurity and BMI. Estimates for the effect of food insecurity on NAFLD were obtained for BMIs of 25, 30, and 35 kg/m2, which correspond to the cutoffs for overweight, obesity Class I, and obesity Class II, respectively.
Due to multicollinearity, separate models were used to obtain estimates for MetS and TyG, adjusting for age, sex, race/ethnicity, household size, BMI, alcohol consumption, and food insecurity.
The multivariable logistic regression model examined the relationship between food insecurity and NAFLD among obese and nonobese participants, adjusting for age, sex, race/ethnicity, household size, hyperglycemia, hypertriglyceridemia, and included obesity (BMI ≥ 30 kg/m2), as well as an interaction term for food insecurity and obesity.
FIGURE 2.
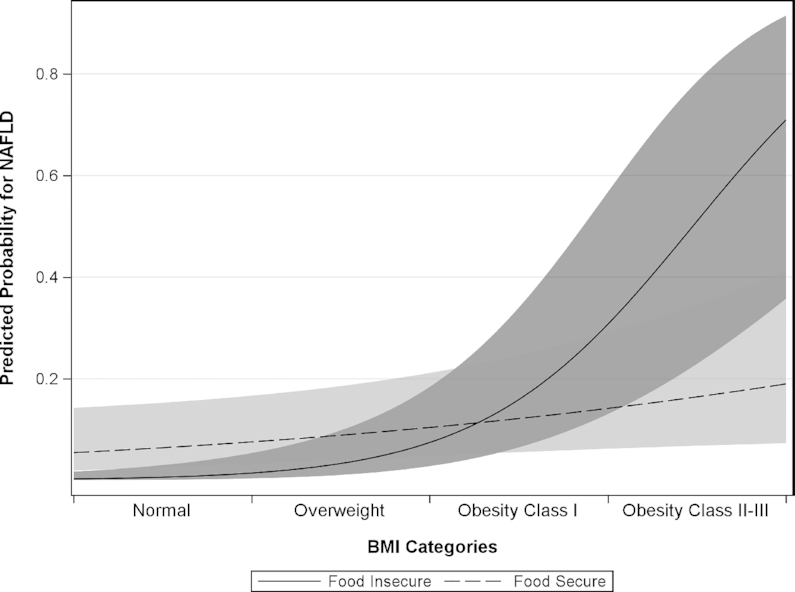
Predicted probability plot for NAFLD by BMI in food-secure versus food-insecure participants (n = 603). A multivariable logistic regression model was used to examine the relationship between food insecurity and NAFLD, adjusting for age, sex, race/ethnicity, household size, hyperglycemia, hypertriglyceridemia, and included BMI, as well as an interaction term for food insecurity and BMI (see Table 3). There was a significant interaction effect between FI and BMI (P < 0.0001). In other words, the effect of FI on NAFLD was dependent on BMI, and vice versa. Estimates for the effects of food insecurity on NAFLD were obtained for BMIs of 25, 30, and 35 kg/m2, which correspond to the cutoffs for overweight, obesity Class I, and obesity Class II, respectively. For every 5-unit increase in BMI, the odds of NAFLD were 3.83 (95% CI, 2.37–6.19; P < 0.0001) times higher in food-insecure participants (solid line) compared to 1.32 (95% CI, 1.04–1.67; P = 0.02) times higher in food-secure participants (dotted line). Likewise, compared to food-secure participants, the odds for NAFLD in food-insecure participants were: 0.20 (95% CI, 0.07–0.57) at 25.0 kg/m2; 0.59 (95% CI, 0.31–1.14) at 30.0 kg/m2; and 1.91 (95% CI, 1.02–3.59) at 35.0 kg/m2. Abbreviations: FI, food insecurity; NAFLD, nonalcoholic fatty liver disease.
We further explored the FI–BMI interaction effect on the NAFLD risk by levels of FI and 5-unit increases in BMI (see Supplementary Table 1). Compared to full food security, VLFS was associated with increased risks for NAFLD at BMIs of 35 and 40 kg/m2, which correspond to the cutoffs for Class II and Class III obesity, respectively.
In addition to these findings, hyperglycemia (AOR, 2.48; 95% CI, 1.46–4.20; P = 0.0008), hypertriglyceridemia (AOR, 2.18; 95% CI, 1.29–3.67; P = 0.004), MetS (AOR, 3.20; 95% CI, 1.92–5.32; P < 0.0001), and TyG index (AOR, 2.57; 95% CI, 1.78–3.71; P < 0.0001) were significantly associated with NAFLD. The use of tobacco, cocaine, and cannabis were no longer significant in multivariable analyses.
Liver fibrosis
In univariate analyses for liver fibrosis (Table 2), FI was independently associated with increased odds for advanced fibrosis (OR, 2.57; 95% CI, 1.20–5.52; P = 0.02) and showed a trend in association with any liver fibrosis (OR, 1.56; 95% CI, 0.99–2.47; P = 0.06). Additionally, a trend was seen for a dose-response effect between the severity of FI and the risk for advanced fibrosis (P = 0.08 for trend). Marginal, low, and VLFS were associated with 1.81, 2.73, and 3.42 times the risk for advanced liver fibrosis, respectively, compared to full food security. Of the metabolic risk factors, reduced HDL and insulin resistance, determined with TyG index, were significantly associated with any liver fibrosis. Hyperglycemia showed trends in association with any fibrosis and advanced liver fibrosis (P < 0.1). No other metabolic parameter was significantly associated with liver fibrosis or advanced fibrosis. HIV and HCV infections were significantly associated with increased odds for any liver fibrosis, but only HCV was significantly associated with advanced fibrosis.
In multivariable analyses (Table 4), FI (AOR, 1.65; 95% CI, 1.01–2.72; P = 0.048), HIV infection (AOR, 2.07; 95% CI, 1.25–3.44; P = 0.005), HCV infection (AOR, 5.05; 95% CI, 3.07–8.32; P < 0.0001), hyperglycemia (AOR, 1.86; 95% CI, 1.07–3.22; P = 0.03), and TyG index (AOR, 1.59; 95% CI, 1.09–2.32; P = 0.02) were significantly associated with any fibrosis after adjustment for confounders. Food insecurity was also associated with advanced fibrosis (AOR, 2.82; 95% CI, 1.22–6.54; P = 0.02), as was HCV infection, but HIV infection and hyperglycemia were no longer significant. No significant interaction effects were identified for liver fibrosis. Furthermore, a sensitivity analysis excluding HCV-positive participants showed that food insecurity remained significantly associated with advanced liver fibrosis (OR, 5.23; 95% CI, 1.34–20.48; P = 0.02).
TABLE 4.
Multivariable analyses
| Any fibrosis1 | Advanced fibrosis2 | |||
|---|---|---|---|---|
| Parameter | AOR (95% CI) | P value | AOR (95% CI) | P value |
| HIV | 2.07 (1.25–3.44) | 0.005 | 1.79 (0.73–4.40) | 0.20 |
| HCV | 5.05 (3.07–8.32) | <0.0001 | 12.56 (4.83–32.64) | <0.0001 |
| Hyperglycemia | 1.86 (1.07–3.22) | 0.03 | — | |
| TyG index3 | 1.59 (1.09–2.32) | 0.02 | — | |
| Alcohol, drinks/week | 0.99 (0.92–1.06) | 0.69 | 1.00 (0.73–1.11) | 0.95 |
| Food insecurity | 1.65 (1.01–2.72) | 0.048 | 2.82 (1.22–6.54) | 0.02 |
Data are for any liver fibrosis (LS ≥ 2.9 kPa) and advanced liver fibrosis (LS ≥ 3.8 kPa) determined by MRE (n = 603). Abbreviations: AOR, adjusted odds ratio; HCV, hepatitis C virus; MetS, metabolic syndrome; MRE, magnetic resonance elastography; TyG, triglyceride and glucose.
The multivariable logistic regression model examined the relationship between food insecurity and any liver fibrosis, adjusting for age, sex, race/ethnicity, household size, HIV, HCV, hyperglycemia, and alcohol consumption.
The multivariable logistic regression model examined the relationship between food insecurity and advanced liver fibrosis, adjusting for age, sex, race/ethnicity, household size, HIV, HCV, and alcohol consumption.
Due to multicollinearity, a separate model was used to obtain estimates for TyG, adjusting for age, sex, race/ethnicity, household size, alcohol consumption, and food insecurity.
Discussion
This report describes a unique study using noninvasive, MR-based, direct measures of liver steatosis and fibrosis to determine whether FI is associated with biomarkers of liver disease among a cohort of low-income, minority, middle-aged adults living with and without HIV and HCV infections. Food insecurity was associated with NAFLD, depending on BMI; FI was associated with greater liver fat content only among obese participants. Food insecurity was also an independent risk factor for liver fibrosis, particularly advanced fibrosis. Additionally, the risk for advanced liver fibrosis correlated with the severity of FI. These findings are highly relevant for the food-insecure population, particularly those living with HIV and/or HCV, since they already have increased risks of liver-related morbidity and mortality and suffer from disproportionately high rates of FI. However, our findings did not show a cumulative effect of FI and viral infections on liver disease, therefore indicating that FI may be a clinically relevant, independent risk factor for liver disease.
Nearly a third of our participants reported FI, which is consistent with the 29% prevalence among US households with incomes below 185% of the federal poverty level (1). Using MRI-PDFF, our findings suggest a NAFLD prevalence of 16% within the cohort. The low prevalence of NAFLD, compared to the prevalence of 25–33% in the general US population (11–13), might be related to the high proportion of black non-Hispanic males in the MASH cohort (8, 11), as well as increased accuracy from MRI-PDFF compared to other noninvasive measures of liver steatosis (40).
To the best of our knowledge, only 1 study has previously explored the relationship between FI and NAFLD. Using NHANES data, Golovaty et al. (16) estimated that 32% of US adults living under 200% of the federal poverty level had NAFLD and 5% had advanced fibrosis. Similar to our results, FI was associated with more than double the odds for advanced liver fibrosis, determined with the NAFLD Fibrosis Score, a noninvasive index that does not provide a direct measurement of fibrosis, but uses age, BMI, AST/ALT ratio, platelets, and albumin (48). In contrast to our findings, Golovaty et al. (16) also found that FI was independently associated with increased odds of NAFLD using the US Fatty Liver Index, also not a direct measure, but an algorithm incorporating race/ethnicity, age, waist circumference, glucose, and insulin levels (49). We have utilized MRE and MRI-PDFF, which represent valid and highly reproducible measurements of liver stiffness and liver fat (39, 40). In addition, the participants in the Golovaty et al. (16) study were younger and had larger proportions of females and white non-Hispanics. Further, many of the participants in our study used tobacco, cocaine, or cannabis, all of which were significantly associated with decreased odds for liver steatosis. We also observed trends towards higher rates of smoking and cocaine use in food-insecure than food-secure participants, and VLFS was associated with increased polysubstance use. Nicotine, cocaine, and cannabis may lead to lower body weight through several mechanisms, including a decreased appetite and an altered metabolism (50). By decreasing body adiposity, substance abuse may partially explain the low prevalence of NAFLD in the cohort, as well as the decreased risk for NAFLD associated with FI among nonobese participants.
There are several potential explanations for the effects of FI on liver disease observed in this study. Food insecurity is associated with inadequate dietary intakes; limited food choices; poor diet quality with low-cost, high-fat, high-sugar, calorie-dense foods; and disrupted eating patterns that contribute to obesity (3, 4). Moreover, FI often forces individuals to make tradeoffs between buying food or obtaining medical care and medications (51, 52). Consequently, food-insecure individuals are at increased risk for metabolic conditions, such as obesity and type 2 diabetes (7), which have bidirectional relationships with NAFLD (53, 54). In this study, hyperglycemia and insulin resistance were associated with NAFLD and liver fibrosis. Food insecurity may lead to poor glycemic control and insulin resistance through increased stress (55, 56) and poor adherence to medical recommendations (57). Indeed, type 2 diabetes and its precursor, insulin resistance, are key pathogenic mechanisms of NAFLD (58), promoting progression to NASH, advanced liver fibrosis (59–61), hepatocellular carcinoma (62), and mortality (63, 64).
The strengths of this study include the large sample of participants with outcome measures obtained with accurate, noninvasive MR technology, and a balanced study design that included PLWH, people infected or coinfected with HCV, and HIV/HCV uninfected participants with similar sociodemographic characteristics. The use of MRI-PDFF and MRE provides a high level of accuracy compared to other noninvasive tests (40). Several limitations in this study should be noted. While the study included a large sample size, the relatively low frequency of advanced liver fibrosis warrants caution in the interpretation of the results. Alcohol consumption was self-reported; thus, it is subject to underreporting. It is also possible that some of the effect of FI on liver fibrosis seen in this study may not be metabolic- or NAFLD-related; however, the association between FI and advanced liver fibrosis was significant while controlling for and excluding HCV infection. Lastly, the cross-sectional design does not allow for temporality to be established. Indeed, it is possible that the association between FI and liver fibrosis seen in this study may be related to reverse causation. For example, HIV/HCV infection may result in liver fibrosis and lead to psychosocial factors such as poverty and drug use, which then contribute to FI. Decompensated cirrhosis may also result in hepatic encephalopathy with behavioral changes that contribute to FI; however, none of the participants in this study had decompensated cirrhosis. Therefore, longitudinal studies are needed to better comprehend the potential role of FI in the development and progression of liver diseases.
Our findings provide further evidence that FI is a social determinant of health that contributes to the prevalence of liver disease (16). The burden of NAFLD is only expected to rise (65), and extrahepatic manifestations of NAFLD may promote the development or aggravation of other chronic comorbidities (66). The fact that FI was independently associated with more than twice the risk for advanced liver fibrosis is particularly relevant to clinical outcomes since fibrosis stage, not NASH, predicts mortality in NAFLD patients (67).
In conclusion, among low-income, middle-aged minorities living with and without HIV and/or HCV in the MASH cohort, FI was associated with increased liver fat content among obese participants and an increased risk for advanced liver fibrosis. People who experience FI, particularly those vulnerable to chronic diseases and viral infections, may be at increased risk for advanced liver disease, which in turn is associated with greater morbidity and mortality. Improving access to adequate nutrition and preventing obesity among low-income groups in the United States may lessen the growing burden of NAFLD and other metabolic chronic diseases.
Supplementary Material
ACKNOWLEDGEMENTS
The authors’ responsibilities were as follows – JAT, MKB, AC, SSM: designed the research; JAT, CT, JH, JC: conducted the research; JAT, TL: performed statistical analysis; RNM, RLE, JC, KES: critically revised the manuscript; JAT, MKB: wrote the paper; MKB: had primary responsibility for the final content; and all authors: read and approved the final manuscript. The authors report no conflicts of interest.
Notes
This work was supported by the National Institute on Drug Abuse at the National Institutes of Health under Grant U01-DA040381 and partially supported by R37-EB001981.
The content of this manuscript is solely the responsibility of the authors and does not necessarily represent the official views of the National Institutes of Health.
Supplemental Figure 1 and Supplemental Table 1 are available from the “Supplementary data” link in the online posting of the article and from the same link in the online table of contents at https://academic.oup.com/ajcn/.
Abbreviations used: ALT, alanine aminotransferase; AOR, adjusted odds ratio; AST, aspartate aminotransferase; FI, food insecurity; HCV, hepatitis C virus; HDL, high-density lipoprotein; LS, liver stiffness; MASH, Miami Adult Studies on HIV; MetS, metabolic syndrome; MR, magnetic resonance; MRE, magnetic resonance elastography; NAFLD, nonalcoholic fatty liver disease; NASH, nonalcoholic steatohepatitis; PDFF, determined proton density fat fraction; PLWH, people living with HIV; TG, triglyceride; TyG, triglyceride and glucose; VLFS, very low food security.
Contributor Information
Javier A Tamargo, Florida International University, Miami, FL, USA.
Kenneth E Sherman, University of Cincinnati College of Medicine, Cincinnati, OH, USA.
Adriana Campa, Florida International University, Miami, FL, USA.
Sabrina S Martinez, Florida International University, Miami, FL, USA.
Tan Li, Florida International University, Miami, FL, USA.
Jacqueline Hernandez, Florida International University, Miami, FL, USA.
Colby Teeman, Florida International University, Miami, FL, USA.
Raul N Mandler, National Institutes of Health, Bethesda, MD, USA.
Jun Chen, Department of Radiology, Mayo Clinic, Rochester, MN, USA.
Richard L Ehman, Department of Radiology, Mayo Clinic, Rochester, MN, USA.
Marianna K Baum, Florida International University, Miami, FL, USA.
Data Availability
Data described in the manuscript, code book, and analytic code will be made available upon request pending application and approval by the principal investigator (baumm@fiu.edu).
References
- 1. Coleman-Jensen A, Rabbitt MP, Gregory CA, Singh A. Household food security in the United States in 2018. U.S. Department of Agriculture, Economic Research Service; 2019[Internet]. Available from: https://www.ers.usda.gov/publications/pub-details/?pubid=94848.
- 2. Seligman HK, Schillinger D. Hunger and socioeconomic disparities in chronic disease. N Engl J Med. 2010;363(1):6–9. [DOI] [PubMed] [Google Scholar]
- 3. Butcher LM, Ryan MM, O'Sullivan TA, Lo J, Devine A. Food-insecure household's self-reported perceptions of food labels, product attributes and consumption behaviours. Nutrients. 2019;11(4):828. [DOI] [PMC free article] [PubMed] [Google Scholar]
- 4. Begley A, Paynter E, Butcher LM, Dhaliwal SS. Examining the association between food literacy and food insecurity. Nutrients. 2019;11(2):445. [DOI] [PMC free article] [PubMed] [Google Scholar]
- 5. Zizza CA, Duffy PA, Gerrior SA. Food insecurity is not associated with lower energy intakes. Obesity. 2008;16(8):1908–13. [DOI] [PubMed] [Google Scholar]
- 6. Gundersen C, Ziliak JP. Food insecurity and health outcomes. Health Aff. 2015;34(11):1830–9. [DOI] [PubMed] [Google Scholar]
- 7. Gregory CA, Coleman-Jensen A. Food insecurity, chronic disease, and health among working-age adults, ERR-235. U.S. Department of Agriculture, Economic Research Service, Service ER; 2017. Available from: https://purl.fdlp.gov/GPO/gpo83486.
- 8. Rich NE, Oji S, Mufti AR, Browning JD, Parikh ND, Odewole M, Mayo H, Singal AG. Racial and ethnic disparities in nonalcoholic fatty liver disease prevalence, severity, and outcomes in the United States: A systematic review and meta-analysis. Clin Gastroenterol Hepatol. 2018;16(2):198–210. [DOI] [PMC free article] [PubMed] [Google Scholar]
- 9. Younossi ZM. Non-alcoholic fatty liver disease–A global public health perspective. J Hepatol. 2019;70(3):531–44. [DOI] [PubMed] [Google Scholar]
- 10. Katsiki N, Perez-Martinez P, Anagnostis P, Mikhailidis DP, Karagiannis A. Is nonalcoholic fatty liver disease indeed the hepatic manifestation of metabolic syndrome?. Curr Vasc Pharmacol. 2018;16(3):219–27. [DOI] [PubMed] [Google Scholar]
- 11. Le MH, Yeo YH, Cheung R, Wong VW, Nguyen MH. Ethnic influence on nonalcoholic fatty liver disease prevalence and lack of disease awareness in the United States, 2011–2016. J Intern Med. 2020;287(6):711–22. [DOI] [PubMed] [Google Scholar]
- 12. Ruhl CE, Everhart JE. Fatty liver indices in the multiethnic United States National Health and Nutrition Examination Survey. Aliment Pharmacol Ther. 2015;41(1):65–76. [DOI] [PubMed] [Google Scholar]
- 13. Younossi ZM, Koenig AB, Abdelatif D, Fazel Y, Henry L, Wymer M. Global epidemiology of nonalcoholic fatty liver disease-meta-analytic assessment of prevalence, incidence, and outcomes. Hepatology. 2016;64(1):73–84. [DOI] [PubMed] [Google Scholar]
- 14. Chalasani N, Younossi Z, Lavine JE, Charlton M, Cusi K, Rinella M, Harrison SA, Brunt EM, Sanyal AJ. The diagnosis and management of nonalcoholic fatty liver disease: Practice guidance from the American Association for the Study of Liver Diseases. Hepatology. 2018;67(1):328–57. [DOI] [PubMed] [Google Scholar]
- 15. Hedenstierna M, Nangarhari A, El-Sabini A, Weiland O, Aleman S. Cirrhosis, high age and high body mass index are risk factors for persisting advanced fibrosis after sustained virological response in chronic hepatitis C. J Viral Hepatol. 2018;25(7):802–10. [DOI] [PubMed] [Google Scholar]
- 16. Golovaty I, Tien PC, Price JC, Sheira L, Seligman H, Weiser SD. Food insecurity may be an independent risk factor associated with nonalcoholic fatty liver disease among low-income adults in the United States. J Nutr. 2020;150(1):91–8. [DOI] [PMC free article] [PubMed] [Google Scholar]
- 17. Pellowski JA, Kalichman SC, Matthews KA, Adler N. A pandemic of the poor: Social disadvantage and the U.S. Am Psychol. 2013;68(4):197–209. [DOI] [PMC free article] [PubMed] [Google Scholar]
- 18. Weiser SD, Bangsberg DR, Kegeles S, Ragland K, Kushel MB, Frongillo EA. Food insecurity among homeless and marginally housed individuals living with HIV/AIDS in San Francisco. AIDS Behav. 2009;13(5):841–8. [DOI] [PMC free article] [PubMed] [Google Scholar]
- 19. Kalichman SC, Hernandez D, Cherry C, Kalichman MO, Washington C, Grebler T. Food insecurity and other poverty indicators among people living with HIV/AIDS: Effects on treatment and health outcomes. J Community Health. 2014;39(6):1133–9. [DOI] [PMC free article] [PubMed] [Google Scholar]
- 20. Anema A, Vogenthaler N, Frongillo EA, Kadiyala S, Weiser SD. Food insecurity and HIV/AIDS: current knowledge, gaps, and research priorities. Curr HIV/AIDS Rep. 2009;6(4):224–31. [DOI] [PMC free article] [PubMed] [Google Scholar]
- 21. Ivers LC, Cullen KA, Freedberg KA, Block S, Coates J, Webb P. HIV/AIDS, undernutrition, and food insecurity. Clin Infect Dis. 2009;49(7):1096–102. [DOI] [PMC free article] [PubMed] [Google Scholar]
- 22. Patel P, Rose CE, Collins PY, Nuche-Berenguer B, Sahasrabuddhe VV, Peprah E, Vorkoper S, Pastakia SD, Rausch D, Levitt NSet al. Noncommunicable diseases among HIV-infected persons in low-income and middle-income countries: A systematic review and meta-analysis. AIDS. 2018;32:S5–S20. [DOI] [PMC free article] [PubMed] [Google Scholar]
- 23. Yang HY, Beymer MR, Suen SC. Chronic disease onset among people living with HIV and AIDS in a large private insurance claims dataset. Sci Rep. 2019;9(1):18514. [DOI] [PMC free article] [PubMed] [Google Scholar]
- 24. Sherman KE, Rockstroh J, Thomas D. Human immunodeficiency virus and liver disease: An update. Hepatology. 2015;62(6):1871–82. [DOI] [PMC free article] [PubMed] [Google Scholar]
- 25. Sherman KE, Peters MG, Thomas D. Human immunodeficiency virus and liver disease: A comprehensive update. Hepatol Commun. 2017;1(10):987–1001. [DOI] [PMC free article] [PubMed] [Google Scholar]
- 26. Lemoine M, Serfaty L, Capeau J. From nonalcoholic fatty liver to nonalcoholic steatohepatitis and cirrhosis in HIV-infected patients: Diagnosis and management. Curr Opin Infect Dis. 2012;25(1):10–16. [DOI] [PubMed] [Google Scholar]
- 27. Sterling RK, Smith PG, Brunt EM. Hepatic steatosis in human immunodeficiency virus a prospective study in patients without viral hepatitis, diabetes, or alcohol abuse. J Clin Gastroenterol. 2013;47(2):182–7. [DOI] [PMC free article] [PubMed] [Google Scholar]
- 28. DallaPiazza M, Amorosa VK, Localio R, Kostman JR, Lo Re V. Prevalence and risk factors for significant liver fibrosis among HIV-monoinfected patients. BMC Infect Dis. 2010;10:116. [DOI] [PMC free article] [PubMed] [Google Scholar]
- 29. Price JC, Seaberg EC, Badri S, Witt MD, D'Acunto K, Thio CL. HIV monoinfection is associated with increased aspartate aminotransferase-to-platelet ratio index, a surrogate marker for hepatic fibrosis. J Infect Dis. 2012;205(6):1005–13. [DOI] [PMC free article] [PubMed] [Google Scholar]
- 30. Baer TE, Scherer EA, Fleegler EW, Hassan A. Food insecurity and the burden of health-related social problems in an urban youth population. J Adolesc Health. 2015;57(6):601–7. [DOI] [PubMed] [Google Scholar]
- 31. Bergmans RS, Coughlin L, Wilson T, Malecki K. Cross-sectional associations of food insecurity with smoking cigarettes and heavy alcohol use in a population-based sample of adults. Drug Alcohol Depend. 2019;205:107646. [DOI] [PMC free article] [PubMed] [Google Scholar]
- 32. Campa A, Yang Z, Lai S, Xue L, Phillips JC, Sales S, Page JB, Baum MK. HIV-related wasting in HIV-infected drug users in the era of highly active antiretroviral therapy. Clin Infect Dis. 2005;41(8):1179–85. [DOI] [PubMed] [Google Scholar]
- 33. Whittle HJ, Sheira LA, Frongillo EA, Palar K, Cohen J, Merenstein D, Wilson TE, Adedimeji A, Cohen MH, Adimora AAet al. Longitudinal associations between food insecurity and substance use in a cohort of women with or at risk for HIV in the United States. Addiction. 2019;114(1):127–36. [DOI] [PMC free article] [PubMed] [Google Scholar]
- 34. Pateria P, de Boer B, MacQuillan G. Liver abnormalities in drug and substance abusers. Best Pract Res Clin Gastroenterol. 2013;27(4):577–96. [DOI] [PubMed] [Google Scholar]
- 35. Sherman KE, Abdel-Hameed EA, Ehman RL, Rouster SD, Campa A, Martinez SS, Huang Y, Zarini GG, Hernandez J, Teeman Cet al. Validation and refinement of noninvasive methods to assess hepatic fibrosis: Magnetic resonance elastography versus enhanced liver fibrosis index. Dig Dis Sci. 2020;65(4):1252–7. [DOI] [PMC free article] [PubMed] [Google Scholar]
- 36. Campa A, Martinez SS, Sherman KE, Greer JP, Li Y, Garcia S, Stewart T, Ibrahimou B, Williams OD, Baum MK. Cocaine use and liver disease are associated with all-cause mortality in the Miami Adult Studies in HIV (MASH) cohort. J Drug Abuse. 2016;2(4):27. [DOI] [PMC free article] [PubMed] [Google Scholar]
- 37. Zarini G, Sales Martinez S, Campa A, Sherman K, Tamargo J, Hernandez Boyer J, Teeman C, Johnson A, Degarege A, Greer Pet al. Sex differences, cocaine use, and liver fibrosis among African Americans in the Miami Adult Studies on HIV Cohort. J Womens Health. 2020;29(9):1176–83. [DOI] [PMC free article] [PubMed] [Google Scholar]
- 38. Rockey DC, Caldwell SH, Goodman ZD, Nelson RC, Smith AD. Liver biopsy. Hepatology. 2009;49(3):1017–44. [DOI] [PubMed] [Google Scholar]
- 39. Venkatesh SK, Ehman RL. Magnetic resonance elastography of liver. Magn Reson Imaging Clin N Am. 2014;22(3):433–46. [DOI] [PMC free article] [PubMed] [Google Scholar]
- 40. Dulai PS, Sirlin CB, Loomba R. MRI and MRE for non-invasive quantitative assessment of hepatic steatosis and fibrosis in NAFLD and NASH: Clinical trials to clinical practice. J Hepatol. 2016;65(5):1006–16. [DOI] [PMC free article] [PubMed] [Google Scholar]
- 41. Gu J, Liu S, Du S, Zhang Q, Xiao J, Dong Q, Xin Y. Diagnostic value of MRI-PDFF for hepatic steatosis in patients with non-alcoholic fatty liver disease: A meta-analysis. Eur Radiol. 2019;29(7):3564–73. [DOI] [PubMed] [Google Scholar]
- 42. Yokoo T, Serai SD, Pirasteh A, Bashir MR, Hamilton G, Hernando D, Hu HH, Hetterich H, Kuhn JP, Kukuk GMet al. Linearity, bias, and precision of hepatic proton density fat fraction measurements by using MR imaging: A meta-analysis. Radiology. 2018;286(2):486–98. [DOI] [PMC free article] [PubMed] [Google Scholar]
- 43. Bickel G, Nord M, Price C, Hamilton W, Cook J. Guide to measuring household food security, revised 2000. Alexandria, VA: US Department of Agriculture, Food and Nutrition Service; 2000. Available from:https://www.fns.usda.gov/guide-measuring-household-food-security-revised-2000. [Google Scholar]
- 44. Singh S, Venkatesh SK, Keaveny A, Adam S, Miller FH, Asbach P, Godfrey EM, Silva AC, Wang Z, Murad MHet al. Diagnostic accuracy of magnetic resonance elastography in liver transplant recipients: A pooled analysis. Ann Hepatol. 2016;15(3):363–76. [DOI] [PMC free article] [PubMed] [Google Scholar]
- 45. Zhang SJ, Du TT, Zhang JH, Lu HM, Lin X, Xie JH, Yang Y, Yu XF. The triglyceride and glucose index (TyG) is an effective biomarker to identify nonalcoholic fatty liver disease. Lipids Health Dis. 2017;16(1):15. [DOI] [PMC free article] [PubMed] [Google Scholar]
- 46. Salazar J, Bermudez V, Calvo M, Olivar LC, Luzardo E, Navarro C, Mencia H, Martinez M, Rivas-Rios J, Wilches-Duran Set al. Optimal cutoff for the evaluation of insulin resistance through triglyceride-glucose index: A cross-sectional study in a Venezuelan population. F1000Research. 2018;6:1337. [DOI] [PMC free article] [PubMed] [Google Scholar]
- 47. Grundy SM, Cleeman JI, Daniels SR, Donato KA, Eckel RH, Franklin BA, Gordon DJ, Krauss RM, Savage PJ, Smith SCet al. Diagnosis and management of the metabolic syndrome. Circulation. 2005;112(17):2735–52. [DOI] [PubMed] [Google Scholar]
- 48. Angulo P, Hui JM, Marchesini G, Bugianesi E, George J, Farrell GC, Enders F, Saksena S, Burt AD, Bida JPet al. The NAFLD fibrosis score: A noninvasive system that identifies liver fibrosis in patients with NAFLD. Hepatology. 2007;45(4):846–54. [DOI] [PubMed] [Google Scholar]
- 49. Bedogni G, Bellentani S, Miglioli L, Masutti F, Passalacqua M, Castiglione A, Tiribelli C. The Fatty Liver Index: A simple and accurate predictor of hepatic steatosis in the general population. BMC Gastroenterol. 2006;6(1):33. [DOI] [PMC free article] [PubMed] [Google Scholar]
- 50. Crossin R, Lawrence AJ, Andrews ZB, Duncan JR. Altered body weight associated with substance abuse: A look beyond food intake. Addict Res Theory. 2019;27(2):76–84. [Google Scholar]
- 51. Herman D, Afulani P, Coleman-Jensen A, Harrison GG. Food insecurity and cost-related medication underuse among nonelderly adults in a nationally representative sample. Am J Public Health. 2015;105(10):e48. [DOI] [PMC free article] [PubMed] [Google Scholar]
- 52. Weinfeld NS, Mills G, Borger C, Gearing M, Macaluso T, Montaquila J, Zedlewski S. Hunger in America 2014. Chicago, IL: Feeding America; 2014 [Internet]. Available from: http://help.feedingamerica.org/. [Google Scholar]
- 53. Cotter TG, Rinella M. Nonalcoholic fatty liver disease 2020: The state of the disease. Gastroenterology. 2020;158(7):1851–64. [DOI] [PubMed] [Google Scholar]
- 54. Grgurevic I, Podrug K, Mikolasevic I, Kukla M, Madir A, Tsochatzis EA. Natural history of nonalcoholic fatty liver disease: Implications for clinical practice and an individualized approach. Can J Gastroenterol Hepatol. 2020;2020:1. [DOI] [PMC free article] [PubMed] [Google Scholar]
- 55. Walker RJ, Williams JS, Egede LE. Pathways between food insecurity and glycaemic control in individuals with type 2 diabetes. Public Health Nutr. 2018;21(17):3237–44. [DOI] [PMC free article] [PubMed] [Google Scholar]
- 56. Bermudez-Millan A, Wagner JA, Feinn RS, Segura-Perez S, Damio G, Chhabra J, Perez-Escamilla R. Inflammation and stress biomarkers mediate the association between household food insecurity and insulin resistance among Latinos with type 2 diabetes. J Nutr. 2019;149(6):982–8. [DOI] [PMC free article] [PubMed] [Google Scholar]
- 57. Heerman WJ, Wallston KA, Osborn CY, Bian A, Schlundt DG, Barto SD, Rothman RL. Food insecurity is associated with diabetes self-care behaviours and glycaemic control, Diabet Med. 2016;33(6):844–50. [DOI] [PMC free article] [PubMed] [Google Scholar]
- 58. Buzzetti E, Pinzani M, Tsochatzis EA. The multiple-hit pathogenesis of non-alcoholic fatty liver disease (NAFLD). Metabolism. 2016;65(8):1038–48. [DOI] [PubMed] [Google Scholar]
- 59. Labenz C, Huber Y, Kalliga E, Nagel M, Ruckes C, Straub BK, Galle PR, Worns MA, Anstee QM, Schuppan Det al. Predictors of advanced fibrosis in non-cirrhotic non-alcoholic fatty liver disease in Germany. Aliment Pharmacol Ther. 2018;48(10):1109–16. [DOI] [PubMed] [Google Scholar]
- 60. Pais R, Charlotte F, Fedchuk L, Bedossa P, Lebray P, Poynard T, Ratziu V, Group LS. A systematic review of follow-up biopsies reveals disease progression in patients with non-alcoholic fatty liver. J Hepatol. 2013;59(3):550–6. [DOI] [PubMed] [Google Scholar]
- 61. Alexander M, Loomis AK, van der Lei J, Duarte-Salles T, Prieto-Alhambra D, Ansell D, Pasqua A, Lapi F, Rijnbeek P, Mosseveld Met al. Risks and clinical predictors of cirrhosis and hepatocellular carcinoma diagnoses in adults with diagnosed NAFLD: Real-world study of 18 million patients in four European cohorts. BMC Med. 2019;17(1):95. [DOI] [PMC free article] [PubMed] [Google Scholar]
- 62. Kanwal F, Kramer JR, Mapakshi S, Natarajan Y, Chayanupatkul M, Richardson PA, Li L, Desiderio R, Thrift AP, Asch SMet al. Risk of hepatocellular cancer in patients with non-alcoholic fatty liver disease. Gastroenterology. 2018;155(6):1828–37. [DOI] [PMC free article] [PubMed] [Google Scholar]
- 63. Stepanova M, Rafiq N, Makhlouf H, Agrawal R, Kaur I, Younoszai Z, McCullough A, Goodman Z, Younossi ZM. Predictors of all-cause mortality and liver-related mortality in patients with non-alcoholic fatty liver disease (NAFLD). Dig Dis Sci. 2013;58(10):3017–23. [DOI] [PubMed] [Google Scholar]
- 64. Zoppini G, Fedeli U, Gennaro N, Saugo M, Targher G, Bonora E. Mortality from chronic liver diseases in diabetes. Am J Gastroenterol. 2014;109(7):1020–5. [DOI] [PubMed] [Google Scholar]
- 65. Estes C, Razavi H, Loomba R, Younossi Z, Sanyal AJ. Modeling the epidemic of nonalcoholic fatty liver disease demonstrates an exponential increase in burden of disease. Hepatology. 2018;67(1):123–33. [DOI] [PMC free article] [PubMed] [Google Scholar]
- 66. Mikolasevic I, Milic S, Turk Wensveen T, Grgic I, Jakopcic I, Stimac D, Wensveen F, Orlic L. Nonalcoholic fatty liver disease–A multisystem disease?. World J Gastroenterol. 2016;22(43):9488–505. [DOI] [PMC free article] [PubMed] [Google Scholar]
- 67. Hagström H, Nasr P, Ekstedt M, Hammar U, Stål P, Hultcrantz R, Kechagias S. Fibrosis stage but not NASH predicts mortality and time to development of severe liver disease in biopsy-proven NAFLD. J Hepatol. 2017;67(6):1265–73. [DOI] [PubMed] [Google Scholar]
Associated Data
This section collects any data citations, data availability statements, or supplementary materials included in this article.
Supplementary Materials
Data Availability Statement
Data described in the manuscript, code book, and analytic code will be made available upon request pending application and approval by the principal investigator (baumm@fiu.edu).