Dear Editors,
We were interested in experimentally evaluating the sensitivity and laboratory performances of a second‐generation design of a new sub‐epidermal moisture (SEM) measurement device (SEM‐2) that is able to identify localised fluid content changes in skin and sub‐dermally, which may precede a pressure ulcer (PU)/injury (Provizio SEM Scanner, Bruin Biometrics LLC, Los Angeles, CA). Two laboratory phantoms, of the heel and facial cheek/chin tissues, which were described in our published work,1 were used here for a systematic comparison of the SEM‐2 with the first‐generation device (SEM‐1),2, 3 which was used in reported large clinical studies, that is, the SEM Scanner (model 200 of the aforementioned manufacturer).4
PUs are localised damage to skin and/or underlying tissues resulting from sustained pressure and shear.5, 6 These wounds impose risks of infections, sepsis, osteomyelitis, and organ failure, and they leave significant scars with psychological consequences and lengthen hospital stays at high treatment costs.7 Accordingly, prevention of PUs is where the majority of health care resources should be invested, considering that most PUs are avoidable if detected in their early phase of development.8 The early damage phase, where a forming PU is still microscopic, would involve a localised inflammatory increase in fluid content within the interstitial space, termed SEM, because of leaky and dilated blood vessels.5, 6 Multiple published studies established the strong association between elevated SEM readings detected by the SEM‐1 through non‐invasive measurements of localised tissue biocapacitance and the risk of developing visible PUs afterwards.4, 8, 9 The Etiology Chapter of the International Guideline5 explains the use of the biocapacitance marker (by the SEM‐1 and SEM‐2 devices) in more detail (see also cited References 2, 3 for technical and non‐technical reviews, respectively).
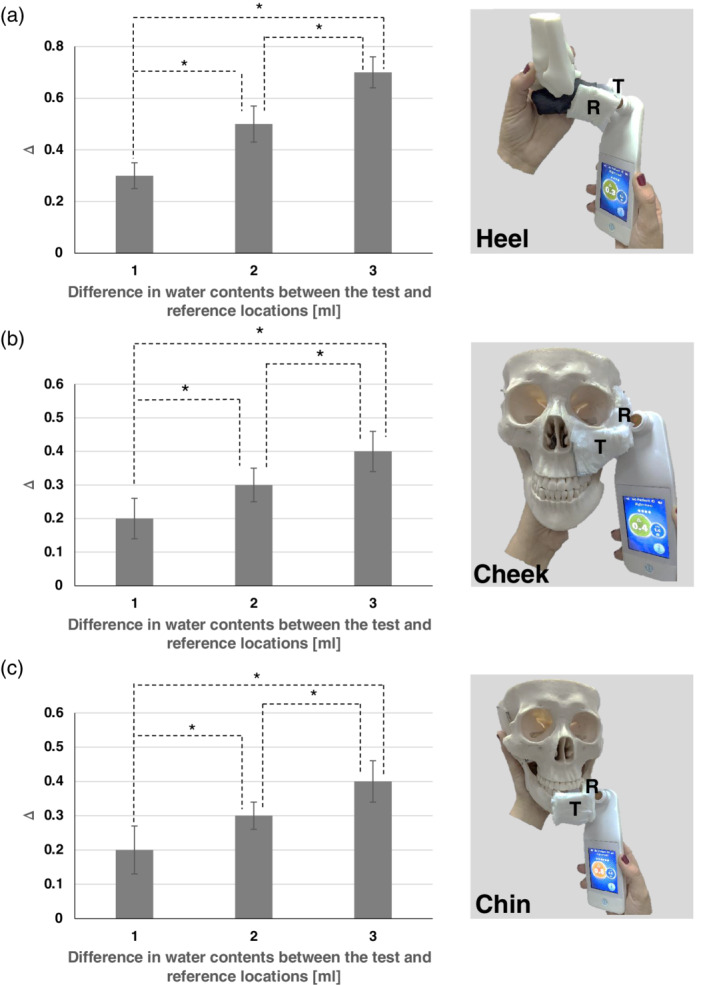
Here, we tested the SEM‐2 using two physical phantoms of human anatomy: (a) the posterior heel and (b) left cheek and chin; both were the same, as we have previously reported in Reference 1. Following the experimental protocol detailed in Reference 1, we injected 1 mL (“reference”) and 2, 3, and 4 mL of water into the “soft tissue” substitutes in each phantom and location. Next, we calculated the corresponding SEM‐Δ, a dimensionless difference between the biocapacitance properties of the “soft tissues” at the reference (1 mL) site vs each of the 2, 3, and 4 mL sites, simulating inflammatory oedema, as per manufacturer instructions for use.1, 2, 3 Finally, we conducted Bland‐Altman (B&A) statistical analyses to determine the levels of agreement between the SEM‐2 and SEM‐1 device readings for each phantom type and location.
Consistent with our published work concerning the SEM‐1, the SEM‐2 device was shown to be sensitive enough to detect water content variations that were as small as 1 mL. Furthermore, the induced gradual “soft tissue” water content rise at 1 mL‐increments resulted in a monotonous, statistically significant, corresponding rise of SEM‐Δ readings of the SEM‐2 device in all phantom types and locations (Figure 1).
Figure 1.

Means and SDs of sub‐epidermal moisture (SEM)‐Δ values, calculated as a difference between SEM measurement device readings at the reference sample (loaded with 1 mL water) and test sample (loaded with 2, 3, or 4 mL water) for the heel phantom A, and for the skull/face phantom at the left cheek B, and the chin C, (left column). Images of the corresponding experimental phantom models and measurement technique are shown in the right column. The statistically significant differences marked by asterisks on the bar graphs were P < .001 for all the phantom test types (A, B, C). R, reference samples; T, test
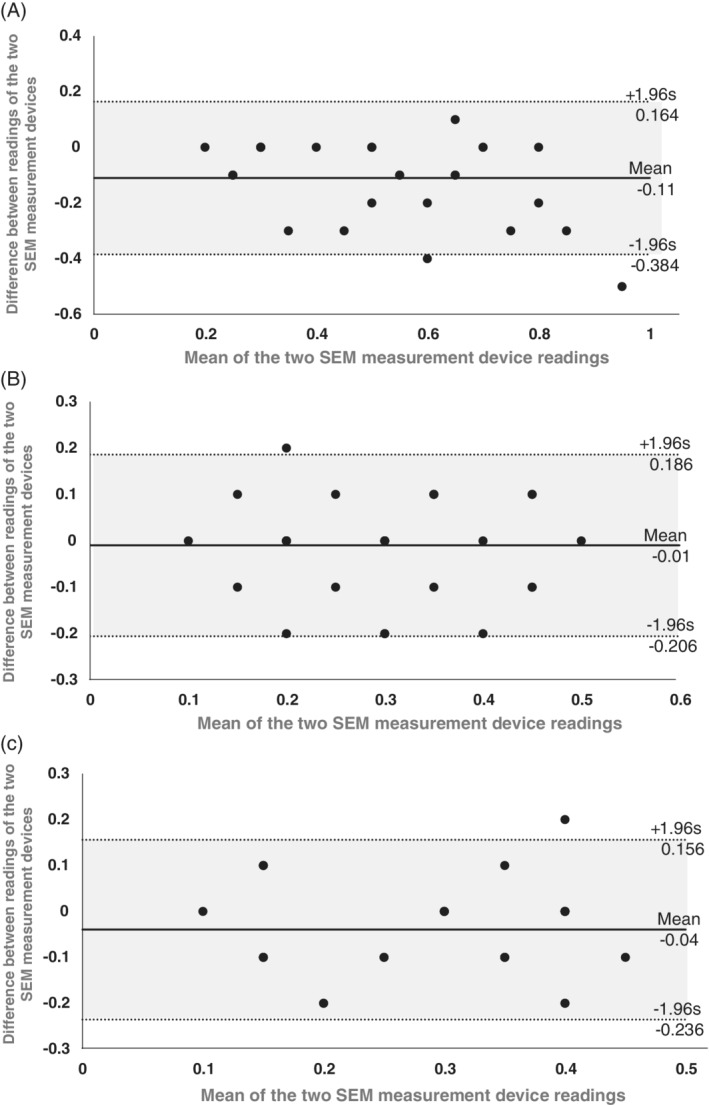
The B&A analyses (Figure 2) evaluated the discrepancy between SEM‐Δ readings of the SEM‐2 and SEM‐1 devices, which were −0.11, −0.01, and −0.04 for the heel, left cheek, and chin of our phantom models (Figure 1; right column), respectively. Approximately 40% of the aforementioned data point differences between the SEM‐2 and SEM‐1 readings were zero, in both phantom configurations and two facial sites (Figure 2). Approximately 95% of the data point differences between the SEM‐Δ readings of the two devices were within the 95% confidence intervals, for both phantom types and the two facial locations, which is clinically insignificant (Figure 2).
Figure 2.

Bland‐Altman (mean difference) plots for the heel phantom A, and for the skull/face phantom at the left cheek B, and chin C,. These plots show the differences between the readings of a second‐generation design of a sub‐epidermal moisture (SEM) measurement device (SEM‐2) and corresponding readings of the first‐generation device (SEM‐1) (on the y‐axis) against the mean of the two device readings (x‐axis). The mean difference between the SEM‐2 and SEM‐1 device readings is depicted by a solid line, and the 95% confidence interval on the mean difference is marked by dotted lines
Our present findings thus demonstrate and confirm that the SEM‐2 device is sensitive in detecting fluid content changes of 1 mL (Figure 1), similar to the SEM‐1 device.1 In addition, the B&A analyses of the present laboratory data established that any differences between the SEM‐Δ readings of the SEM‐2 and SEM‐1 devices were clinically negligible. In addition, and importantly, the differences between the new and older SEM measurement devices did not tend to become larger as the mean of the two device readings increased (Figure 2), which indicates stability and precision of both devices. Moreover, as 40% of the calculated data point differences between the SEM‐2 and SEM‐1 readings were, in fact, zero, it is concluded that the two devices consistently and affirmatively record the same physiological phenomenon of rise in SEM‐Δ with increased fluid content,1, 2, 3 in a similar precision and sensitivity.
In conclusion, from a clinical precision‐practical perspective, the SEM‐2 device performs identically to the older SEM‐1 model in bioengineering laboratory tests, which evaluated its sensitivity to small water content variations within physical phantoms representing human heel and facial tissues. By monitoring these small fluid content changes in tissues, which cannot be detected via traditional visual skin assessments or by other modalities,1, 2, 3 the SEM‐2 device provides caregivers the ability to timely acquire physiologically/clinically relevant tissue health information from persons at risk. This allows risk determination and/or early detection of forming PUs, which then reduces the overall cost of PU care.7 Not only were the readings of the SEM‐2 device found to be consistent with those of the previous SEM‐1 model,1 the SEM‐2 is also substantially more compact and user‐friendly, has a smaller sensor that facilitates easier access to small/curved body sites (and smaller patients), and features improved connectivity with other medical data systems in hospital settings.
ACKNOWLEDGEMENTS
Dr Gefen acts as a scientific advisor to multiple companies in the field of pressure ulcer/injury prevention, including Bruin Biometrics LLC, whose SEM Scanner technology is evaluated in this publication. This had no influence on the study design or conclusions from the analysis of laboratory test data presented here.
REFERENCES
- 1. Peko Cohen L, Gefen A. Phantom testing of the sensitivity and precision of a sub‐epidermal moisture scanner. Int Wound J. 2019;16(4):979‐988. [DOI] [PMC free article] [PubMed] [Google Scholar]
- 2. Ross G, Gefen A. Assessment of sub‐epidermal moisture by direct measurement of tissue biocapacitance. Med Eng Phys. 2019;73:92‐99. [DOI] [PubMed] [Google Scholar]
- 3. Gefen A, Ross G. The subepidermal moisture scanner: the technology explained. J Wound Care. 2020; 29(sup2c):S10‐S16. [DOI] [PubMed] [Google Scholar]
- 4. Okonkwo H, Bryant R, Milne J, et al. A blinded clinical study using a sub‐epidermal moisture biocapacitance measurement device for early detection of pressure injuries. Wound Repair Regen. 2020; (in press). 10.1111/wrr.12790 [DOI] [PMC free article] [PubMed] [Google Scholar]
- 5. European Pressure Ulcer Advisory Panel , National Pressure Injury Advisory Panel , Pan‐Pacific Pressure Injury Alliance . Prevention and Treatment of Pressure Ulcers/Injuries: Clinical Practice Guideline. 3rd ed. Westford, MA: EPUAP‐NPIAP‐PPPIA; 2019. [Google Scholar]
- 6. Gefen A. How medical engineering has changed our understanding of chronic wounds and future prospects. Med Eng Phys. 2019;72:13‐18. [DOI] [PubMed] [Google Scholar]
- 7. Gefen A, Kolsi J, King T, Grainger S, Burns M. Modelling the cost‐benefits arising from technology‐aided early‐detection of pressure ulcers. Wounds Int. 2020; 11(1):22‐29. [Google Scholar]
- 8. Black JM, Edsberg LE, Baharestani MM, et al.; National Pressure Ulcer Advisory PanelPressure ulcers: avoidable or unavoidable? Results of the National Pressure Ulcer Advisory Panel Consensus Conference. Ostomy Wound Manage. 2011;57(2):24‐37. [PubMed] [Google Scholar]
- 9. Bates‐Jensen BM, McCreath HE, Nakagami G, Patlan A. Subepidermal moisture detection of heel pressure injury: the pressure ulcer detection (PUD) study outcomes. Int Wound J. 2018;15(2):297‐309. [DOI] [PMC free article] [PubMed] [Google Scholar]


