Abstract
The aim of this study was to study the role of Th1/Th2 cell‐associated chemokines in the formation of hypertrophic scars in rabbit ears. Twenty‐six New Zealand white rabbits were used to establish the hypertrophic scar model of rabbit ear and the normal scar model of rabbit's back. Two rabbits were sacrificed on days 0 and 21, 28, 35, 42, 49, 56, and 63 after operation. The specimens were stained with haematoxylin‐eosin (HE). Scar elevation index (SEI) was used to detect the expression of 10 chemokines related to Th1/Th2 cells in both scar formation expressions. Real‐time polymerase chain reaction (PCR) results showed that two chemokines (CXCL10, CXCL12) were highly expressed during the formation of normal scar, and there was almost no expression during the formation of hypertrophic scar (*P < 0.05). The chemokines (CCL2, CCL3, CCL4, CCL5, CCL7, CCL13, CX3CL1) were almost non‐expressed in the formation of normal scars but were expressed for a long time in the formation of hypertrophic scars. The four chemokines, CCL2, CCL4, CCL5, and CX3CL1, maintained a long‐term high expression level during the formation of hypertrophic scars (P < 0.01). There were also three chemokines (CCL14, CCL19, CCL21) that were almost undetectable in normal scarring, but there was transiently low‐level expression (P < 0.05) only during the peak proliferative phase in proliferative scarring. Th1/Th2 cell‐associated chemokines are different in the type, quantity and expression, and maintenance time of rabbit ear hypertrophic scars.
Keywords: chemokines, hypertrophic scar, imbalance, Th1/Th2 cell
1. INTRODUCTION
Hypertrophic scar is a common disease in plastic surgery, often accompanied by appearance damage, itching and painful swelling, affecting the patient's physical and mental health. Currently, the pathogenesis of hypertrophic scars is not clear, and the treatment methods are varied, but so far, there is no effective solution for the prevention and treatment of hypertrophic scar and no targeted programmes to resolve the patient's pain. Studies have confirmed that immune factors in the formation and development of scar cannot be ignored.1 Among them, T lymphocyte population is an important group in the body's immune system and is a major immune cell in the process of scar hyperplasia.2 The major subsets of Th1 and Th2 cells are closely related to the formation of scar fibrosis. Th1 cells play a role in reducing fibrosis,3 while Th2 cells have a strong role in promoting fibrosis.4 Studies have shown that5 chemokines produced by local tissues play an important role in the recruitment and invasion of Th1 and Th2 cells to the reaction site. Our experiment was conducted from the chemokine point of view in hypertrophic scar formation during Th1/Th2 cell‐related chemokine expression changes.
2. EXPERIMENTAL MATERIALS AND METHODS
2.1. Animal preparation
Sixteen adult New Zealand white rabbits were selected, and their body weight was 2.5 to 3.0 kg. The animals were prepared as follows:
Establishing hyperplastic scar model on the rabbit's ear and normal scar model on the rabbit's back.
Preoperative removal of rabbit hair using Na2S solution, 1% sodium pentobarbital intravenous injection under general anaesthesia (4 mL/kg), and iodophor disinfection for rabbit ears and the surgery area of the back.
Establishing rabbit ear ventral hypertrophic scar model: According to the reported methods of Morris,6 we make some improvement to avoid obvious visible blood vessels. First, each rabbit ear was made circular 4 cm diameter with methylene blue mark. The lines were arranged in two rows at a distance of about 1.5 cm each, and lidocaine was injected subcutaneously into the circle to form a hillock (to facilitate dissection of the tissue). The skin was cut along a circular line with a 15‐round blade. Then, skin, subcutaneous tissue, and perichondrium was removed for the formation of a 1 cm circular wound. Four wounds were made on the left and right ears. In case of small bleeding, haemostasis or bipolar haemostasis was carried out (Figure 1).
Establishing a model of normal scars on the back of rabbits: In the same way, six circular methylene blue lines of a diameter of 1 cm were made in the middle part of the rabbit's back and arranged in two rows at a distance of about 2 cm. Then, lidocaine was injected, and the hypothalamus was formed (for tissue separation); the circular line was cut with a 15‐round blade, and the whole skin and dermis were removed until the fascia was exposed. Six circular wounds of a diameter of 1 cm were made. In case of small bleeding, haemostasis or bipolar haemostasis was carried out (Figure 1).
All wounds were exposed after the operation, and the iodophor disinfection was treated daily for the first 3 days until the wounds healed by themselves. A total of 14 rabbits were modelled. There were 112 wounds in the Hypertrophic Scar group (HS group) and 84 wounds in the Normal Scar group (NS group).
Postoperative wound healing, scar epithelialization, scar morphological changes, and pictures were recorded.
Figure 1.
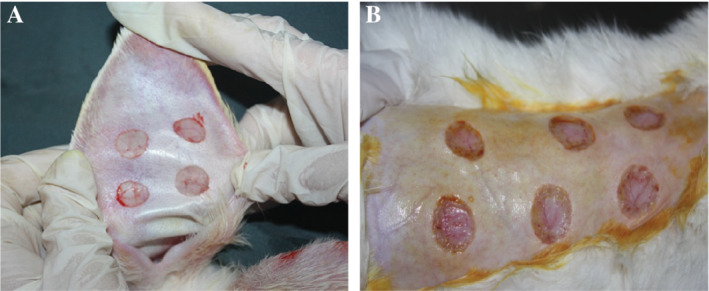
Surgical wound: rabbit ear (A) and rabbit's back (B) round full‐thickness skin defect
2.2. Collecting scar specimens
Two healthy rabbits were sacrificed at random, and the normal rabbit ears and the backs of rabbits were excised as normal tissue control (day 0). At the 21st, 28th, 35th, 42th, 49th, 56th, and 63th days after operation, two experimental animals were randomly sacrificed by air embolisation, and around the periphery of each scar was excised by about 0.5 cm to collect the scar tissue and place markers. Each scar specimen along the straight line was halved.
The normal rabbit ear and back scar tissues were cut, and each half was immediately placed in 4% paraformaldehyde solution; after 48 hours, the alcohol was dehydrated, and paraffin was embedded immediately, and then, the tissue was placed in a refrigerator at −80°C for sparing until all specimens were collected. RNA was extracted for the real‐time polymerase chain reaction (PCR) test.
In order to more accurately compare the two groups of scar proliferation, the fixed paraffin specimens were sent to the Department of Pathology for haematoxylin‐eosin (HE) staining.
Scar hyperplasia index measurement: The scar on the back of the rabbits was a normal scar, so we only measured and calculated the scar hyperplasia index (SEI) of rabbit ear hypertrophic scars. As the rate of hypertrophic scar formation in rabbit ears is only about 70% to 80%,6 not all of the wounds develop hypertrophic scars, and therefore, not all wounds require inclusion and exclusion criteria. Methods: The HE‐stained sections of 16 wound tissues at each time point were placed under a microscope, photographed, and measured using the IPP software, and the SEI was calculated using the formula shown in Figure 2. Scar index and the degree of scar hyperplasia is proportional to the general values. For an SEI ≥1.6, significant scar hyperplasia can be considered. The incidence of scar at each time point was calculated. According to the results of SEI, 8 of the 16 wound tissue specimens at each time point (4 each) were chosen as the experimental specimens in order to carry out the next experiment.
Figure 2.

Scar elevation index (SEI) calculation
2.3. Real‐time PCR detection
Specimen inclusion criteria: The −80°C frozen tissue specimens used for real‐time PCR experiments must be numbered in accordance with the conditions for inclusion in the SEI.
Primer Design
RNA extraction
Reverse transcription
Ordinary PCR and agarose gel electrophoresis
Real‐time PCR reaction
2.4. Statistical analysis
SEI results was analysed using SPSS 16.0 statistical software, using variance analysis and t‐test methods. Real‐time PCR results of the data of the HS and NS groups of two experimental animals were detected at each time point (three scars of each group were randomly selected) using the mean ± SD (± s). Data were also processed using SPSS 16.0 statistical software. One‐way analysis of variance (ANOVA) and SNK methods were used to compare data. Significant differences at *P < 0.05 and **P < 0.01 were considered statistically significant.
3. RESULTS
3.1. Scar model general observation
Varying degrees of change with time in the postoperative HS and NS groups were observed (Figure 3). At 21 days after operation, the HS group had been completely epithelialised; the thickening scar was obvious; and the red colour, the toughening scar, and the hyperplasia of the centre of the wound were serious. The degree of scar hyperplasia peaked at 28 to 35 days in the HS group. After the scarring degree gradually declined, we could still achieve more obvious, hard hyperplastic scar tissue. At 56 days, scar growth was not obvious; at about 63 days, most of the scar tissue had shrunk, and the scar colour and hardness were almost similar to the surrounding skin, so the experimental observation of time points was up to 63 days. In the NS group, the wound healed well by 21 days, and the surface was not obviously uplifted. Soft touch and pink scar colour were almost similar to the surrounding skin. In the NS group, the scars gradually became linear scars and faded away with time, eventually forming a normal scar similar to the surrounding tissue.
Figure 3.
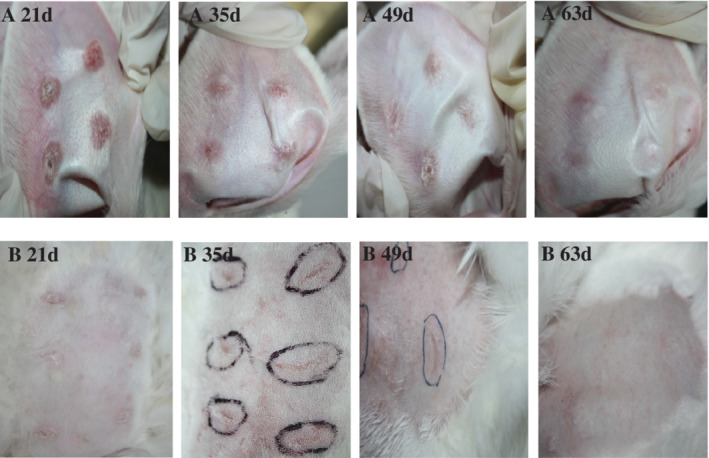
Gross morphology observation of scar tissue at two postoperative time points (A, HS group; B, NS group)
3.2. HE staining results
3.2.1. HE staining showed two groups of scar morphology results
Compared with normal skin, the two kinds of scar tissue showed different HE staining at different time points (Figure 4). In the HS group, the epidermis thickened on the 21st day, and the dermis layer proliferated obviously. The dermis contained several dense and thick collagen fibres arranged in disorder. In the meantime, inflammatory cells and neovasculature were seen, and a large amount of extracellular matrix was deposited, showing similar pathology to human hypertrophic scar. On the 49th day, the degree of scar hyperplasia had declined, but obvious red collagen fibre arrangement and extracellular matrix deposition were still visible in the dermis. The level of scar hyperplasia decreased significantly, the collagen fibres decreased, and the extracellular matrix decreased at 63 days. In the NS group, the dermis hyperplasia was insignificant at 21 days, the extracellular matrix was less precipitated, the structure was loose, collagen fibres were mostly arranged in parallel, and the number of fibroblasts were fewer similar to the normal performance of the scar. At days 49 and 63, the microscopic appearance gradually turned to the dorsal tissue of normal rabbits.
Figure 4.
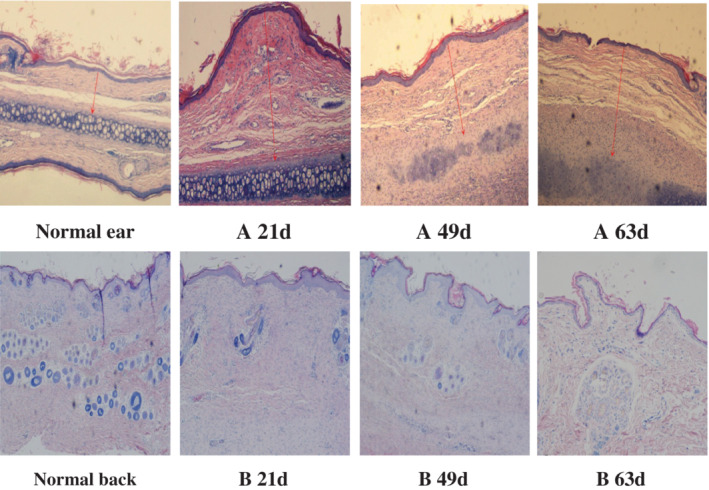
Comparison of two microstructures of scar tissue at different time points (×40‐fold) (A: HS group; B: NS group) (red arrow in the figure is the vertical distance from the highest point of scar marked to the cartilage surface when measuring scar elevation index [SEI])
3.2.2. HE staining showed inflammatory cell infiltration
Inflammatory cell infiltration at each time point in HS group showed (Figure 5) that the wound tissue inflammatory response was obvious at 21 days after operation. Visible dense proliferation of fibrous connective tissue was found. Lymphocytes and macrophages displayed diffuse infiltration, which was rich in blood vessels. In the experiment, at 35 days, the wound tissue had been characterised by chronic inflammatory reaction; loose fibrous tissue distribution with obvious proliferation; scattered, varying numbers of lymphocytes; and a small amount of plasma cell infiltration. At 63 days, the wound tissue had no obvious inflammatory reaction. However, a small number of scattered lymphocytes was still observed, and the scar tissue was obviously degenerated. In the NS group, there was only a small amount of lymphocytes infiltration at 21 days, after which there was no significant inflammatory cell infiltration. It was suggested that there was a long‐term chronic inflammation microenvironment during the process of hypertrophic scar formation.
Figure 5.
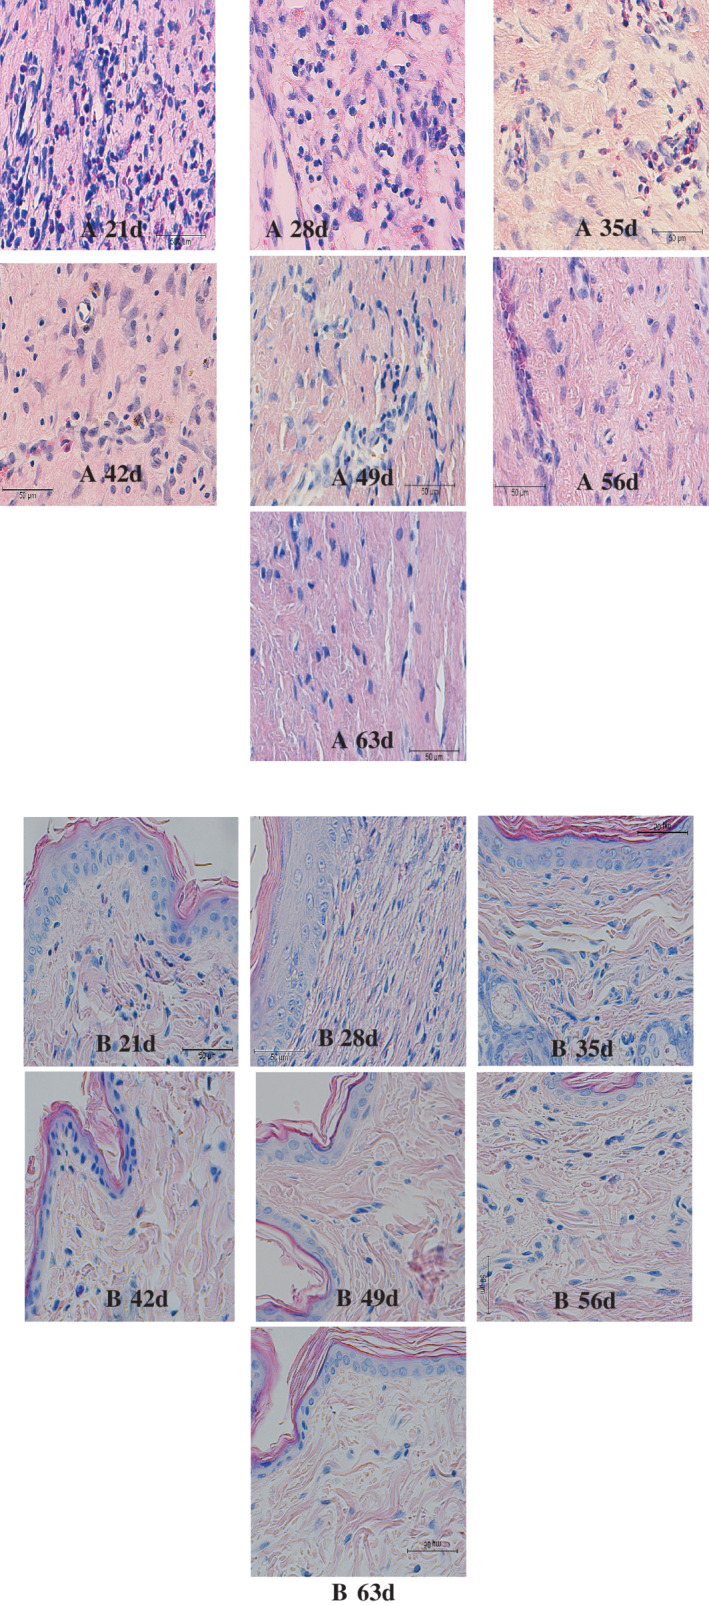
Inflammatory cell infiltration of two kinds of scar tissue under microscope (×400) (A, HS group; B, NS group)
3.3. SEI results
SEI results are shown for each time point (Table 1 and Figure 6): the HS group reached the peak value of SEI on the 28th day after operation, and it had no significant proliferation at the 56th day after operation. The scar had shrunk after 63 days, SEI < 1.6.
Table 1.
Scar elevation index (SEI) results
| 21d | 28d | 35d | 42d | 49d | 56d | 63d | |
|---|---|---|---|---|---|---|---|
| HS:SEI | 1.86 ± 0.14 | 2.67 ± 0.15 | 2.58 ± 0.14 | 1.96 ± 0.14 | 1.77 ± 0.13 | 1.62 ± 0.14 | 1.42 ± 0.11 |
| Rate of scar (%) | 68.8 (11/16) | 93.8 (15/16) | 93.8 (15/16) | 81.3 (13/16) | 75 (12/16) | 62.5 (10/16) | 43.8 (7/16) |
Note: n = 16, ± s.
Figure 6.
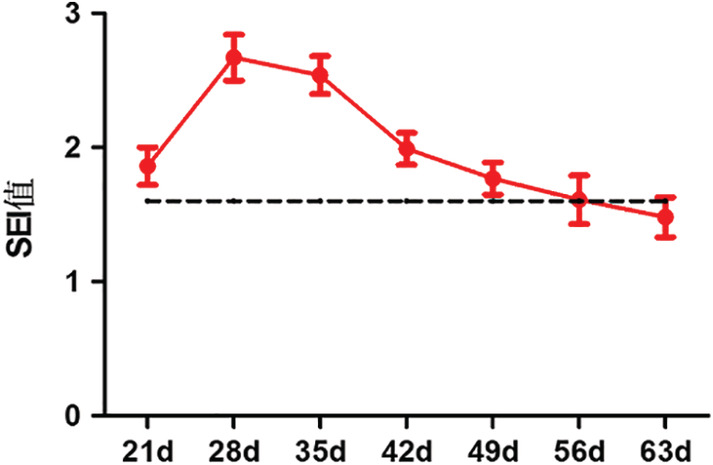
HS index at each time point of scarring
Calculation of scar incidence: According to the data of HE staining under microscope and using IPP software, the percentage of SEI ≥ 1.6 (regarded as hypertrophic scars) in 16 wound tissues at each time point was calculated.
3.4. Ordinary PCR and agarose gel electrophoresis results
3.4.1. Real‐time PCR results
Real‐time PCR results showed that two chemokines (CXCL10 and CXCL12) were expressed at a relatively high level for a long time in the formation of normal scars, and there was almost no expression in hypertrophic scars (P < 0.05) (Figure 7). Seven chemokines (CCL2, CCL3, CCL4, CCL5, CCL7, CCL13, CX3CL1) in the HS group were expressed for a long time, but basically, there was no expression in the NS group. The four chemokines, CCL2, CCL4, CCL5, and CX3CL1, maintained a long‐term high level of expression during the development of hypertrophic scars (P < 0.01). There were also three chemokines (CCL14, CCL19, CCL21) expressing for only a short term and at a low level at the peak of hyperplasia in HS group; in the late proliferative phase, these three factors had almost no expression. In the NS group, the three factors were almost not expressed (P < 0.05) (Figure 8).
Figure 7.
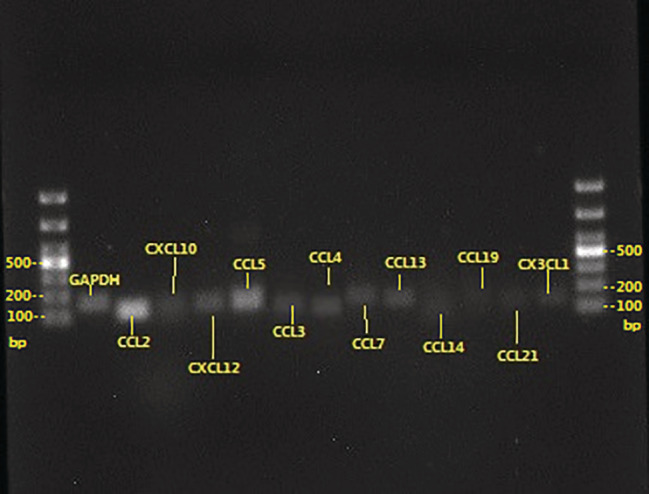
The expression of each primer: clear expression, single band
Figure 8.
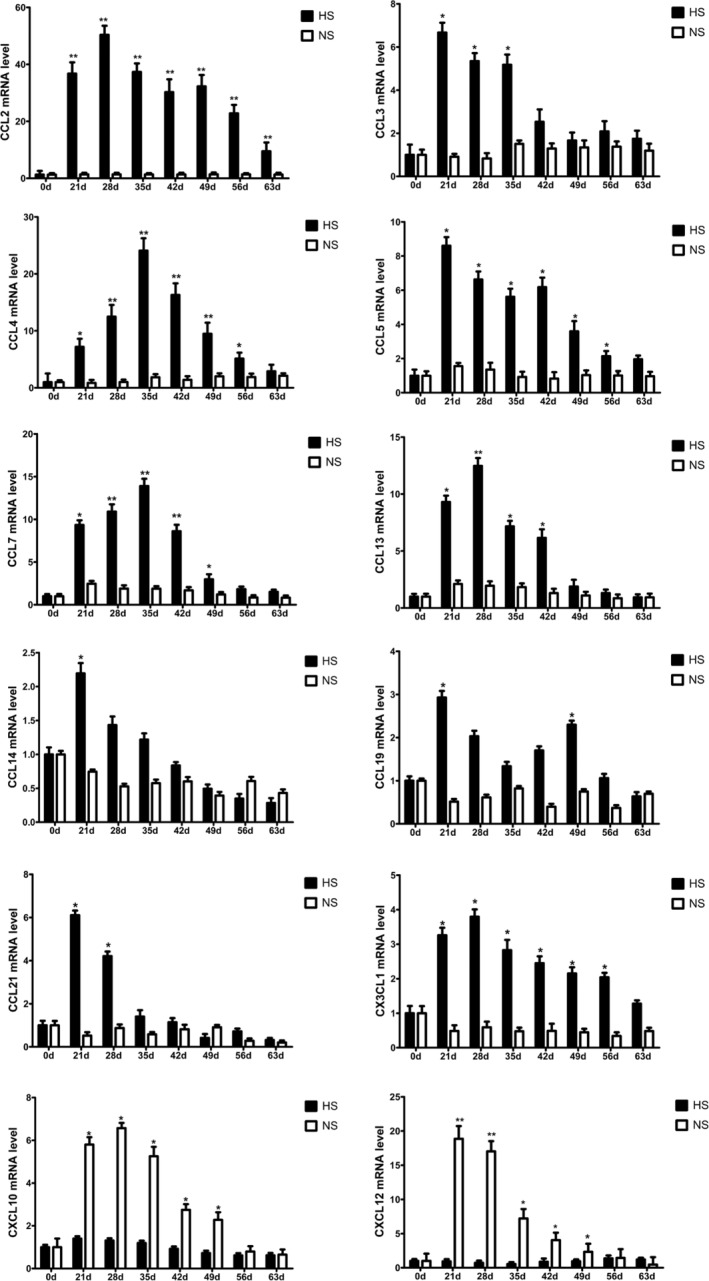
Expression of Th1/Th2 cell‐associated chemokines in HS and NS groups
4. DISCUSSION
Pathological scar is a common human pathology, which is rare in animals, and become a barrier to the further development of scar mechanisms. Many scholars have conducted many studies to find a suitable scar animal model. In a study of animal models of scarring, Morris et al6 first found that the phenomenon of similar human hypertrophic scars can be formed on the ventral side of the rabbit ear in 1997. After years of research and improvement by many scholars, Morris et al6 have now developed a more mature, widely used hypertrophic scar model. This experiment used the rabbit ear ventral hypertrophic scar model for the experimental group. In the same body, on different parts, the same trauma occurs with different types of healing; then, the two parts of the healing process of changes in the level of various factors must be different. Therefore, in this experiment, we avoided the early stage of trauma and chose to observe the expression changes of various factors in these two parts through long‐term and continuous study after the hyperplasia stage of hypertrophic scar to explore the mechanism of occurrence.
So far, the exact pathogenesis of scar hyperplasia remains unclear, so there is still a lack of safe and effective treatment, which has been one of the focuses and problems of plastic surgery. Now, many scholars have noticed that immune factors play an important role in this process. The occurrence of a pathological scar is not only a local problem but is also regulated by immune cells from the whole body.1 It has been reported that2 helper T lymphoid (Th) cells are the major immune cells in a pathological scar. Th cell subsets include Th1 cells, Th2 cells, Th3 cells, Th9 cells, and so on. Among them, Th1 and Th2 cells and scar fibrosis have a close relationship3, 4 Th1 cells have the role of reducing fibrosis,3 while Th2 cells have a strong role in promoting fibrosis.4 Th1 cells predominantly produce IFN‐γ and IL‐12. IFN‐γ inhibits collagen synthesis, increasing collagenase expression and activity, thereby promoting collagen remodelling. Th1 cells also secrete cytokines and activate nitric oxide synthase (NOS), and NOS promotes collagenase activity and matrix degradation. Therefore, in the Th1 cell‐based immune response, a large number of apoptosis and extracellular matrix degradation phenomena often occur.3 Studies have shown that, in keloid tissue, collagenase activity decreased, accompanied by reduced production of nitric oxide, and NOS activity decreased. In keloids, local Th1 cell function decreases and cannot produce the anti‐fibrosis cytokine IFN‐γ.7 Th2 cells produce a variety of cytokines including IL‐4, IL‐5, IL‐6, IL‐10, IL‐13, and the like. Among them, IL‐4 and IL‐13 are potent fibrotic factors.4, 8 Tredget et al9 found that the formation of hypertrophic scars after burn injury was associated with an over‐enhanced Th2 response. Serum levels of IL‐4, IL‐6, and IL‐10 were elevated, whereas the levels of Th1 cytokines IFN‐ IL‐12 decreased. Some investigators have tried to find ways to treat and prevent recurrence by altering cytokine levels, such as local injection of IFN‐γ and IFN‐γ into the scar. This suggests that the alteration of the levels of certain cytokines alone does not allow for the treatment and prevention of scarring.10, 11, 12 Therefore, it is difficult to achieve the treatment of a scar with the simple treatment of local fibroblasts or cytokines levels and only reduce or block the peripheral blood‐derived immune cells, and the local cells of the lesion interaction may bring more hope of achieving the desired effect.
Chemokines play an important role because of their unique chemotactic properties in the recruitment of immune cells in the peripheral blood of scars to diseased local tissues.5 Chemokines are a class of small molecule proteins with chemotactic activity produced by local tissues. Tissue after trauma can produce a variety of chemokines locally, and the immune cells to the corresponding chemokine receptor effects signal transmission to strengthen the adhesion between immune cells and endothelial cells to promote immune cells from the blood to local tissue infiltration and activation. Immune cells infiltrate the target tissue; realise the concentration of local chemokines gradient chemotaxis to inflammatory sites; and then secrete a series of inflammatory cytokines involved in the process of pathological damage, finally forming a normal or pathological scar. As chemokines and chemokine receptors are not one‐to‐one correspondence, a variety of chemokines have a chemotactic effect on Th1 and Th2 cells but eventually lead to normal and pathological scars, two types of healing. Did the abnormal expression of chemokines eventually lead to local scar tissue levels of Th1 and Th2 cells and then to the formation of a pathological scar? Therefore, in this experiment, a series of chemokines (CXCL10, CXCL12, CCL2, CCL3, CCL4, CCL5, CCL7, CCL13, CCL4, CCL3,CCL19, CCL21, CX3CL1) in normal scar and hypertrophic scar tissue were detected by RT‐PCR to further explore the mechanism of scarring.
Chemokines, such as CCL3, CCL4, CCL5, CCL7, CXCL12, and CX3CL1, are mainly involved in Th1 and Th2 cell chemotaxis in the local microenvironment while the expression of the other cell was inhibited. In summary, CXCL10 and CXCL12 are the Th1 cell‐associated chemokines, and CCL2, CCL3, CCL4, CCL5, CCL7, CCL13, and CX3CL1 tend to be Th2 cell‐associated chemokines in the process of hypertrophic scars. There are some types of chemokines in local tissues during the process of hypertrophic scars, such as the expression of chemokines; the quantity and the maintenance time; the low expression of CXCL10 and CXCL12; and the expressions of Th2 cell chemokines CCL2, CCL3, CCL4, and CCL5. The long‐term expression of CCL7, CCL13, and CX3CL1, especially the high expression of CCL2, CCL4, CCL5, and CX3CL1, led to the differential recruitment of Th1 and Th2 cells locally, presenting the polarisation of Th2 and triggering a series of fibrosis cascade reactions, eventually leading to the pathological changes of hypertrophic scars. The experimental results further elucidate the possible pathogenesis of pathological scar, suggesting that we can regulate the body's immune pathway of Th1; Th2 cell‐related chemokine expression levels such as the use of small molecule chemokine receptor blockers; and antibodies, immunomodulators, and other new ways to play to regulate the immune cells and local fibroblasts interaction to achieve prevention and treatment of scars. Currently, small molecule chemokine receptor antagonists, neutralising antibodies, and immunosuppressive agents show a good application prospect because of the more precise target of action.13, 14
This experiment provides ideas and a theoretical basis for drugs in the treatment of pathological scar. With regard to the expression of chemokines in pathological scar, most of the existing studies focus on a single‐factor or cross‐sectional study of several factors, and no long‐term dynamic continuity test has been reported yet. However, in this study, the dynamic expression curves of 12 chemokines related to Th1/Th2 cells were continuously drawn throughout the growth of rabbit ear hypertrophic scars to make up for this gap and were the first reports locally and globally. The experimental results have a positive impact on further elucidating the role of T‐cell‐derived signals in scar hyperplasia and provide much data and a research background for the treatment modalities of the intervention of chemotaxis and activation of T lymphocytes in scar prevention and control methods. Further studies are necessary.
CONFLICT OF INTEREST
The authors declare no potential conflict of interest.
Chen B, Li H, Xia W. The role of Th1/Th2 cell chemokine expression in hypertrophic scar. Int Wound J. 2020;17:197–205. 10.1111/iwj.13257
REFERENCES
- 1. Wilgus TA. Immune cells in the healing skin wound: influential players at each stage of repair. Pharmacol Res. 2008;58:112‐116. [DOI] [PubMed] [Google Scholar]
- 2. Wong VW, Paterno J, Sorkin M, et al. Mechanical force prolongs acute inflammation via T‐cell‐dependent pathways during scar formation. FASEB J. 2011;25(12):4498‐4510. [DOI] [PubMed] [Google Scholar]
- 3. Wang R, Ghahary A, Shen Y, Scott PG, Tredget EE. Human dermal fibroblasts produce nitric oxide and express both constitutive and inducible nitric oxide synthase isoforms. J Invest Dermatol. 1996;106:419‐427. [DOI] [PubMed] [Google Scholar]
- 4. Fujitsu Y, Fukuda K, Kumagai N, Nishida T. IL‐4‐induced cell proliferation and production of extracellular matrix proteins in human conjunctival fibroblasts. Exp Eye Res. 2003;76(1):107‐114. [DOI] [PubMed] [Google Scholar]
- 5. Marshall BG, Shaw RJ. T cells and fibrosis. Chem Immunol. 2000;78:148‐158. [DOI] [PubMed] [Google Scholar]
- 6. Morris DE, Wu I, Zhao LL, et al. Acute and chronic animal models for excessive dermal scarring: quantitative studies. Plast Reconstr Surg. 1997;100(3):674‐681. [DOI] [PubMed] [Google Scholar]
- 7. McCauley R, Chopra V, Li Y. Altered cytokine production in black patients with keloids. J Clin Immunol. 1992;12:300‐308. [DOI] [PubMed] [Google Scholar]
- 8. Fichtner‐Feigl S, Strober W, Kawakami K, Puri RK, Kitani A. IL‐13 signaling through the IL‐13alpha2 receptor is involved in induction of TGF‐beta1 production and fibrosis. Nat Med. 2006;12(1):99‐106. [DOI] [PubMed] [Google Scholar]
- 9. Tredget EE, Yang L, Delehanty M, Shankowsky H, Scott PG. Polarized Th2 cytokine production in patients with hypertrophic scar following thermal injury. J Interferon Cytokine Res. 2006;26(3):179‐189. [DOI] [PubMed] [Google Scholar]
- 10. Al‐Khawajah M. Failure of interferon‐alpha 2b in the treatment of mature keloids. Inter J Dermatol. 1996;35(7):515‐517. [DOI] [PubMed] [Google Scholar]
- 11. Wong TW, Chiu HC, Yip KM. Intralesional interferon alpha‐2b has no effect in the treatment of keloids. Br J Dermatol. 1994;130(5):683‐685. [DOI] [PubMed] [Google Scholar]
- 12. Hasegawa T, Nakao A, Sumiyoshi K, Tsuboi R, Ogawa H. IFN‐gamma fails to antagonize fibrotic effect of TGF‐beta on keloid‐derived dermal fibroblasts. J Dermatol Sci. 2003;32(1):19‐24. [DOI] [PubMed] [Google Scholar]
- 13. Yoshie O. Chemokine receptors as therapeutic targets. Nihon Rinsho Meneki Gakkai Kaishi. 2013;36(4):189‐196. [DOI] [PubMed] [Google Scholar]
- 14. Prado A, Andrades P, Benitez S, Umana M. Scar management after breast surgery: preliminary results of a prospective, randomized, and double‐blind clinical study with aldara cream 5% (imiquimod). Plast Reconstr Surg. 2005;115(3):966‐972. [DOI] [PubMed] [Google Scholar]


