

Abstract
Noninvasive estimation of mean axon diameter presents a new opportunity to explore white matter plasticity, development, and pathology. Several diffusion-weighted MRI (DW-MRI) methods have been proposed to measure the average axon diameter in white matter, but they typically require many diffusion encoding measurements and complicated mathematical models to fit the signal to multiple tissue compartments, including intra- and extra-axonal spaces. Here, Monte Carlo simulations uncovered a straightforward DW-MRI metric of axon diameter: the change in radial apparent diffusion coefficient estimated at different effective diffusion times, ΔD⊥. Simulations indicated that this metric increases monotonically within a relevant range of effective mean axon diameter while being insensitive to changes in extra-axonal volume fraction, axon diameter distribution, g-ratio, and influence of myelin water. Also, a monotonic relationship was found to exist for signals coming from both intra- and extra-axonal compartments. The slope in ΔD⊥ with effective axon diameter increased with the difference in diffusion time of both oscillating and pulsed gradient diffusion sequences.
Keywords: Diffusion, MRI, Oscillating gradient, Pulsed gradient, White matter, Axon, Diameter, Monte Carlo
1. Introduction
Axon diameter is one important characteristic of white matter, as it correlates with the conduction velocity of action potentials—a regulated process that is important for brain function (Seidl, 2014) and potentially a source of white matter plasticity (Sampaio-Baptista and Johansen-Berg, 2017). A number of diffusion-weighted MRI (DWI) techniques have been proposed to measure axon diameter in vivo (Alexander et al., 2010; Assaf et al., 2008; Veraart et al., 2020; Xu et al., 2014). In these methods, the estimate of axon diameter relies primarily on sensitivity to time dependent changes of water diffusion in the direction orthogonal to the axon orientation. As the diffusion time increases, water interacts with lipid bilayers and other barriers, reducing the radial diffusion coefficient (D⊥), which is an apparent measure of water diffusion orthogonal to axon orientation provided by diffusion tensor analysis.
A variety of temporally varying gradient waveforms may be used to encode water diffusion, which differ in their sensitivities to the effects of restriction. Pulsed-gradient or bipolar waveforms (Stejskal and Tanner, 1965) are used most commonly; however, the minimum diffusion time that can be probed with commonly available hardware is long compared to the time water diffuses across axons in the brain. Oscillating-gradient waveforms (Schachter et al., 2000; Stepinik, 1981) can achieve shorter diffusion times, but also require strong, fast switching gradients. Optimization of diffusion-encoding gradient waveforms for axon diameter measurement remains an active area of investigation (Drobnjak et al., 2016; Nilsson et al., 2017).
There are also open questions on how water diffusion in white matter should be modeled mathematically. In most current models, the diffusion-weighted signal originates from multiple compartments (Panagiotaki et al., 2012), primarily intra-axonal and extra-axonal spaces. Whereas several analytic models are available to approximate intra-axonal water diffusion in terms of axon diameter, extra-axonal water diffusivity is less well characterized. Many models have assumed that extra-axonal water diffusion is approximately constant with diffusion time, and that diffusion-time dependent changes in D⊥ result from only intra-axonal water, although this assumption has been subsequently challenged (Burcaw et al., 2015; Grussu et al., 2019; Lam et al., 2014; Novikov and Kiselev, 2010; Veraart et al., 2019; Xu et al., 2014).
A recent imaging study reported sex and age differences between radial diffusivity values measured with oscillating gradient vs pulsed-gradient DWI acquisitions (Tétreault et al., 2020). These results were interpreted through a limited set of simulations of water diffusion, which suggested that the changes in D⊥ correlated strongly with axon diameter, and were primarily due to diffusion-time dependent changes in extra-axonal water. Here we report findings from a more comprehensive set of Monte Carlo simulations, aimed at more closely examining these findings. Diffusion-weighted signals were simulated in arenas of axons covering extremes in extra-axonal volume fraction, axon g-ratio, compartmental water exchange, the free diffusion coefficient of water, and axon packing heterogeneity. The findings showed that while D⊥ strongly depends upon several tissue characteristics, the change in D⊥ with diffusion time (ΔD⊥) robustly correlates with axon diameter, and the slope of ΔD⊥ vs. axon diameter increases with a difference in diffusion times probed by the diffusion-weighted gradient waveforms.
2. Methods
Similar to previous work (Harkins and Does, 2016; Tétreault et al., 2020), Monte Carlo simulations of water diffusion were used to compute D⊥ for various tissue characteristics and experimental parameters. Simulations were performed in periodic 2D arenas of axons, where concentric circles defined the spatial boundary between intra-axonal space, myelin, and extra-axonal space. Individual axons were parameterized with an inner diameter, d, and g-ratio, g. Individual axon diameters were randomly drawn from a log-normal probability density (Buzsáki and Mizuseki, 2014), which was characterized by the arithmetic mean axon diameter, , and standard deviation of the log-spaced diameters, σ. (The common log-normal parameter, μ, was related to and σ as , where ln(·) indicates the natural logarithm). For each simulation, a square arena was randomly filled with 500 non-overlapping axons using a previously-described procedure (Hall and Alexander, 2009) at a prescribed extra-axonal volume fraction, ve. The length of the square arena was . Four example arenas are given in Fig. 1, with: ve = 0.3, g = 0.7, and σ = 0.0, 0.3, 0.5, & 0.7.
Fig. 1.

(top) Axon diameter distributions with σ = 0.0, 0.3 0.5, and 0.7, and (bottom) corresponding example simulation geometries for ve = 0.5. The effective mean axon diameter, 〈d〉eff (defined in Section 2.1), is larger than the arithmetic mean axon diameter and varies with the heterogeneity of axon diameter.
For all simulations, a total of 125000 spin particles were placed into intra-axonal space, extra-axonal space, and—when not being neglected—myelin. Particle diffusion was simulated from excitation (t = 0) to the echo time (t = 100ms) with a constant time step of Δt = 0.01ms. Diffusion-weighted signals were calculated from the accumulated phases of the diffusing spins imparted by the diffusion-weighted gradient waveform. Both pulsed gradient (with gradient duration δ, gradient separation Δ, and effective diffusion time, teff = Δ − δ/3) and cosine modulated oscillating gradient (with duration T, N cycles, teff = T/4 N, and frequency f0 = N/T) waveforms were evaluated. D⊥ was calculated from signals simulated with b-values of 0 and 0.3ms/μm2. D⊥ was also independently calculated from spins residing in intra-axonal and extra-axonal compartments, resulting in Di⊥ and De⊥, respectively. ΔD⊥ was defined as the difference in D⊥ resulting from diffusion waveforms with different teff, including oscillating gradient and pulse gradient diffusion encoding. Simulations were implemented in CUDA, wrapped into MATLAB, and performed on a Linux workstation with a GeForce GTX Titan GPU. As previously published (Harkins and Does, 2016), the simulation framework has been validated with tests to the physics of particle interactions (including jump tests for permeable & impermeable geometries, and stability of particle density over time) as well as comparison to models with known solution (including free diffusion, T2 relaxation, and low b-value approximated solutions to diffusion inside impermeable cylinders Vangelderen et al. (1994)). The software used to perform these simulations is available from the corresponding author upon direct request.
2.1. The effective inner axon diameter
Given a distribution of axon sizes, several scalar measures of the average axon diameter have been published as relevant for water diffusion in white matter. Considering these measures, a family of possible effective inner axon diameters (〈d〉eff) has been previously defined (Burcaw et al., 2015) as
| (1) |
where p and q are natural numbers, and p ≥ q + 1. For water diffusion inside axons, some previous works have used the area-weighted mean axon diameter (p = 3 & q = 2)(Alexander et al., 2010; Harkins et al., 2012), while others have proposed sequence-dependent measures, using p = 4 & q = 2 for narrow pulsed gradient DWI and p = 6 & q = 2 for both wide pulsed gradient and oscillating gradient DWI (Burcaw et al., 2015; Novikov et al., 2019). Note that our previous study (Tétreault et al., 2020) defined d as the outer diameter. Here, 〈d〉eff was defined as the inner diameter with p = 4 and q = 2, but different measures are considered in Appendix A. As shown in Fig. 1, 〈d〉eff increases with σ, since it is weighted towards larger axon diameters.
2.2. Simulation sets
Seven independent sets of simulations were performed to investigate how tissue characteristics and experimental parameters affect D⊥ and ΔD⊥. Unless otherwise specified, each simulation set was repeated with mean inner axon diameters, , 1.0, 1.5, 2.0, 3.0, & 4.0 μm and axon diameter distributions, σ = 0.3, 0.5, & 0.7. Default tissue characteristics were as follows: axons were uniformly placed in the simulation arena; ve = 0.3; g = 0.7 (constant for all axons); myelin water was neglected (i.e. no water in myelin, and no exchange of water between compartments); intra- & extra-axonal spaces used equal values for water density; the free water diffusion coefficient was the same in both intra-axonal and extra-axonal space (D0,ie = 3.0 μm2/ms); and the transverse relaxation time-constant was the same in both intra-axonal and extra-axonal space (T2,ie = 80 ms). Unless otherwise specified, diffusion weighting was imparted with both a cosine modulated oscillating gradient (OG: N = 4, T = 40ms, teff = 2.5ms, Gmax = 207mT/m) and a pulsed gradient pair (PG: Δ = 62ms, δ = 6ms, teff = 60ms, Gmax = 44mT/m).
Set I: Exploring D⊥ and ΔD⊥ The first set of simulations evaluated D⊥ and ΔD⊥ in geometries with uniform axon diameter, σ = 0, and ve = 0.5 over an extreme range of axon diameter, , 0.5, 0.75, 1.0, 1.5, 2.0, 3.0, 4.0, 6.0, 8.0, 10, 12, 15, 20, 30, 40, 50, 80, & 100 μm.
Set II: simulation precision Simulations over a limited set of were repeated 4× to evaluate the run-to-run variations in D⊥, ΔD⊥, and 〈d〉eff due to selecting a finite number of axons from the distribution (500) from a given axon diameter distribution and a finite number of spin particles (125000). ΔD⊥ vs. 〈d〉eff was fitted to a 2nd order polynomial, and the standard deviation of the simulation measures of ΔD⊥ was estimated as the root-mean-squared residual.
Set III: extra-axonal volume fraction Simulations were performed to investigate how D⊥ and ΔD⊥ change over a wide range of extra-axonal volume fractions, ve = 0.3, 0.4, 0.5, 0.6, & 0.7. Additional simulations were included with σ = 0; however, due to limitations in packing density, ve was limited to 0.5, 0.6, & 0.7.
Set IV: myelin This set of simulations aimed to test the influence of myelin and myelin water. Simulations were performed over a wide range of g-ratios, g = 0.6, 0.7, 0.8, 0.9, 0.99, where g remained constant for all axons within a simulation arena. Also, since g-ratio is known to vary with axon diameter, an additional simulation was performed with g = 0.5 + 0.02d (Berthold et al., 1983). To test if myelin water would influence the simulation results,each simulation was performed twice—once neglecting myelin water, and again incorporating myelin water and myelin water exchange. Here we defined myelin water as having one-half the density of intra- and extra-axonal spaces (pm/pie = 0.5) (van der Knaap and Valk, 2005), T2,m = 15ms (MacKay et al., 1994; Stewart et al., 1993); and D0,m = 0.001μm2/ms (Harkins et al., 2012). Water exchange was governed by the the difference in radial diffusivities and water densities across a compartment boundary, such that intra- or extra-axonal water crossed into myelin with a probability, . For an example axon with d = 1 μm and g = 0.7, this is equivalent to a myelin water lifetime of ≈ 25 ms.
Set V: diffusion time In addition to the PG (teff = 60ms) and OG (teff = 2.5ms) diffusion weighting schemes defined above, simulation set I was repeated with 3 additional short teff schemes. The OG waveform was repeated with N = 8 (teff = 1.25ms, Gmax = 410mT/m) and N = 2 (teff = 5ms, Gmax = 105mT/m), and the PG gradients were repeated with Δ = 12ms (teff = 10ms, Gmax = 108mT/m).
Set VI: D0,ie This simulation set aimed at testing the influence of the free diffusion coefficient of intra- and extra-axonal water. Simulations were performed with σ = 0.5, and D0,ie = 0.5, 1.0, 1.5, 2.0, 2.5, & 3.0μm2/ms.
Set VII: heterogeneous axon packing Finally, simulations were run to test how variations in axon packing affect the observed relationship between ΔD⊥ and 〈d〉eff. The approach was to vary the axon density between ve = 0.3 in the center of the arena and ve = 1.0 at the extremes of the arena, with a linear transition in axon density between the two extremes, creating a trapezoid-like distribution of axons spatially. The length of the transition was given by ΔL. For ΔL = 0, the all the axons were packed into the center half of the arena, with axon density resembling a rectangle function, while if ΔL = L/2, axon density was triangular. To achieve such distributions, a simulation arena was initially seeded with 1500 axons at ve = 0.3, σ = 0.5, and . Then, axons were selectively pruned from the arena, where the probability of pruning was calculated from the spatial trapezoidal density based upon the location of the axon in both x and y, and evaluated with a random number generator (rand in MATLAB). Simulations were run in arenas with 11 linear spaced values of ΔL between 0 and L/2.
3. Results
Set I: D⊥ and ΔD⊥ Fig. 2 shows D⊥ and ΔD⊥ from intra-axonal, extra-axonal, and total water signal over a broad range in axon diameter. Note that since σ = 0, . The top panel shows D⊥ from oscillating gradient diffusion encoding, the top middle from pulsed-gradient diffusion, and the bottom middle is the difference in D⊥ from the two encoding methods. While D⊥ increases monotonically with 〈d〉eff for both the oscillating and pulsed gradient diffusion waveforms, ΔD⊥ peaks at 〈d〉eff between 10 and 20 μm. The exact shape and range of ΔD⊥ will depend upon the diffusion gradient waveforms being used. Since axons in the brain are relatively small compared to the range explored in this simulation set, the black box highlights the range in 〈d〉eff explored in the elaborated simulation sets given below. This range of axon diameter is expanded in the bottom panel of the figure.
Fig. 2.

Simulation set I. D⊥ and ΔD⊥ from oscillating (OG) and pulsed-gradient (PG) diffusion encoding in axon geometries with ve = 0.5 and σ = 0. Intra-axonal water (red), extra-axonal water (yellow), and total water (blue) D⊥ increase monotonically with 〈d〉eff, while ΔD⊥ peaks between 10 and 20 μm. The black box outlines the range in 〈d〉eff investigated for the remainder of the simulations, which is highlighted in the bottom panel. Over this subset of axon diameters, ΔD⊥ monotonically increases with 〈d〉eff.
Set II: simulation precision Fig. 3 shows simulation results from nine different axon diameter distributions, each repeated four times with an independently generated collection of 500 axons. The OG and PG D⊥ measures and the corresponding ΔD⊥ values are plotted vs 〈d〉eff. These results show some variations in D⊥ and ΔD⊥ for a given 〈d〉eff, particularly at low values of 〈d〉eff (square blue markers, for example), but the variations are small compared to the observed trends with 〈d〉eff, particularly for ΔD⊥. The gray line shows a second order polynomial fit of ΔD⊥ vs 〈d〉eff. From this regression, the standard deviation of ΔD⊥ was estimated to be 0.007 μm2/ms, which is much smaller than the range in ΔD⊥ observed. Thus, we concluded that the number of axons and the number of spin particles used in the simulation was sufficient for the evaluations of ΔD⊥ as a measure of 〈d〉eff.
Fig. 3.

Simulation set II. Simulations were repeated 4× for each combination of mean inner axon diameter (, 1.0, and 2.0 μm) and axon diameter distributions (σ = 0.3, 0.5, and 0.7). The left and middle column show the simulated radial apparent diffusion coefficient (D⊥) for oscillating gradient and pulsed gradient diffusion experiments respectively. The right panel shows the difference in D⊥ measured by the two sequences (ΔD⊥). The standard deviation of ΔD⊥ with 〈d〉eff was estimated from the residual of a second order polynomial fit.
Set III: extra-axonal volume fraction Simulation results from a large set of axon diameter distributions and extra-axonal volume fractions are summarized in Fig. 4. The top row shows example simulation arenas with varying ve. The middle row shows OG (teff = 2.5ms) and PG (teff = 60ms) measures of D⊥ for different distributions and ve. In all cases, OG measures of D⊥, but not the PG measures, are noticeably sensitive to 〈d〉eff, but looking from left (ve = 0.3) to right (ve = 0.7) it is also clear that for both OG and PG D⊥ is heavily influenced by ve. Interestingly though, the dispersion between OG and PG measures of D⊥ with 〈d〉eff was similar for each case of ve and apparently independent of distribution shape, σ. This is made more clear in the lower panel, which shows that ΔD⊥ increases monotonically over this range in 〈d〉eff, while roughly independent of ve and σ. These observations are consistent with the recently presented preliminary studies (Tétreault et al., 2020).
Fig. 4.

Simulation set III. (top row) Example simulation arenas with identical axon diameter distributions but varied extra-axonal volume fraction. Red bars = 10 μm. (middle) Apparent radial diffusion coefficients (D⊥) calculated with different tissue and experimental parameters, demonstrating the dominant effect of ve on D⊥. (bottom) In contrast, the difference between D⊥ acquired with oscillating- and pulsed-gradients (ΔD⊥) is relatively independent of ve and increases with the effective inner axon diameter.
To investigate the intra- and extra-axonal contributions to ΔD⊥, Fig. 5 shows ΔDi⊥ and ΔDe⊥ vs 〈d〉eff from simulation set III. Here and below, results from all distribution shapes (i.e. σ = 0.3, 0.5, 0.7) were plotted identically as dots. Note that ΔDe⊥ ≈ ΔDi⊥ near 〈d〉eff = 4 μm. Below this diameter, ΔDe⊥ > ΔDi⊥, and extra-axonal water dominates the relationship between ΔD⊥ with 〈d〉eff. Above this diameter, ΔDe⊥ < ΔDi⊥, and intra-axonal water dominates the trend between ΔD⊥ with 〈d〉eff. Regardless of the domain, both ΔDi⊥ and ΔDe⊥ increase monotonically with 〈d〉eff, and, therefore, an increase in ΔD⊥ can be interpreted as an increase in axon size, independent of the underlying compartmental contribution.
Fig. 5.

Intra- (top) and extra-axonal (bottom) contributions to ΔD⊥ with 〈d〉eff, taken from simulation set III. For smaller axon diameters, ΔDe⊥ > ΔDi⊥. For larger axon diameters, ΔDe⊥ < ΔDi⊥.
Set IV: myelin The evaluations of the role of myelin on ΔD⊥ are summarized in Fig. 6. These data show that the trend in ΔD⊥ with 〈d〉eff is largely independent of the presence and relative thickness of myelin, including when g varies as a function of axon size. Also, comparing the left and right panels, inclusion of myelin water and diffusion of water between compartments has little effect on ΔD⊥.
Fig. 6.

Simulation set IV. ΔD⊥ simulated over a wide range in myelination and myelin water. All distribution shapes (i.e. σ = 0.3, 0.5, and 0.7) are plotted as dots. The trend in ΔD⊥ with 〈d〉eff is consistent over a wide range in g-ratio, and is not impacted by the inclusion of myelin water and water exchange between compartments.
Set V: teff Results from simulations using various OG and PG diffusion encoding waveforms is shown in Fig. 7. In all cases, the relationship between ΔD⊥ and 〈d〉eff remains, but the slope at any 〈d〉eff increases with the difference in teff.
Fig. 7.

Simulation set V. The magnitude of the slope in ΔD⊥ with 〈d〉eff increases with difference in effective diffusion time of the diffusion encoding waveforms.
Set VI: D0,ie Results from simulations varying D0,ie is shown in Fig. 8. The relationship between ΔD⊥ and 〈d〉eff is mostly independent of D0,ie, except at D0,ie = 0.5 μm2/ms, where ΔD⊥ values are lower at larger axon sizes.
Fig. 8.

Simulation set VI. The value of the free diffusion coefficient of intra- and extra-axonal water, D0,ie, significantly impacts the radial diffusivity simulated with oscillating gradient (OG, top) and pulsed gradient (PG, middle) diffusion waveforms. However, the relationship between ΔD⊥ and 〈d〉eff (bottom) is consistent over a wide range in D0,ie. Only in the lowest value of D0,ie are the values of ΔD⊥ reduced for large axon sizes.
Set VII: heterogeneous axon packing Results from simulations with variations in axon packing axons are shown in Fig. 9. The top row shows three example spatial distributions of axon density with ΔL = 0, L/4, and L/2, while the middle row shows axon distributions after pruning based upon the spatial distribution. In the bottom panel, simulations over a wide of ΔL indicated that ΔD⊥ was sensitive to variations in axon packing heterogeneity, which may bias measurements of axon diameter based upon this metric.
Fig. 9.

Simulation set VII: To create spatial variations in axon packing density, axons within a simulation arena generated with ve = 0.3, σ = 0.5 and μm were selectively pruned based upon a trapezoid packing density with a variable transition width, given by ΔL. Example distributions are shown in the top row, and resulting simulation arenas are shown in the middle row. Simulations indicate that variations in packing density do influence ΔD⊥, and could bias estimates of axon diameter.
4. Discussion
This work suggests a robust metric of axon diameter can be obtained from relatively simple diffusion measurements: the difference in the radial apparent diffusion, ΔD⊥, collected at two different, appropriate diffusion times. Simulations demonstrated that ΔD⊥, for our selected gradient waveforms, depends primarily on effective inner axon diameter, 〈d〉eff, and is largely independent of extra-axonal volume fraction, axon diameter distribution, free diffusion coefficient, and myelin characteristics. The magnitude of ΔD⊥ with 〈d〉eff increases with the difference in diffusion time between the DW-MRI acquisitions, at least over the range of times investigated. Further, the relationship between ΔD⊥ and 〈d〉eff has contributions from both intra- and extra-axonal water signals, allowing it to be sensitive to smaller axons than could be probed with an intra-axonal contrast alone.
This study builds upon several recent studies. One recent study involving pulsed- and oscillating-gradient experiments and numerical simulations interpreted differences in D⊥ with diffusion time to be roughly proportional to axon diameter (Tétreault et al., 2020). Whereas the simulations in that work were limited to investigating changes with ve with the specific diffusion waveforms that were performed experimentally, the present work provides a more complete evaluation of ΔD⊥, including sensitivity over several tissue characteristics and diffusion weighting waveforms. Two other recent in vivo human brain studies each reported a diffusion-time difference measure, similar to ΔD⊥, noting that it highlighted white matter tracts known to have larger diameter axons (Dell’Acqua et al., 2019; Padron et al., 2019), which is consistent with the simulation results here. Another study looked at the difference in D⊥ between PG and OG as reporting on microstructure, but not specifically axon diameter (Arbabi et al., 2020). That study also noted that ΔD⊥ can be calculated from only two acquisitions when the b-value is the same between two acquisitions, removing the need to acquire a separate b=0 scan. Also, one prior study proposed the diffusion dispersion rate with OG frequency (essentially ΔD⊥ divided by frequency difference between two OG measures) as a measure of axon diameter (Xu et al., 2016). In that case, as in other prior axon diameter mapping methods, the relationship between D⊥ and axon diameter was based on the intra-axonal water signal only.
While ΔD⊥ increases monotonically with axon diameter, intra- and extra-axonal water contribute differently to this relationship. In regions with small axons, ΔD⊥ depends primarily on extra-axonal water and increases approximately linear with 〈d〉eff. With larger axons, intra-axonal water contributes more to ΔD⊥ and results in a more quadratic increase with 〈d〉eff. Also, note that where extra-axonal water signal dominates, it makes sense that ΔDapp is reporting on outer axon diameters (i.e., outside the myelin) rather than inner-axon diameter. Here, 〈d〉eff was defined as the inner diameter, and Appendix A provides more discussion how the definition of 〈d〉eff affects the relationship with ΔDapp.
Of course, several studies have noted that extra-axonal water significantly contributes to diffusion measured in the brain (Lam et al., 2014; Novikov and Kiselev, 2010; Veraart et al., 2019). Some studies have even noted a relationship between diffusion characteristics of extra-axonal space and axon diameter. One study found differences in the radial diffusion and kurtosis coefficients of extra-axonal water with diffusion time and axon diameter (Grussu et al., 2019). Another study, found a relationship between the correlation time of extra-axonal water and axon diameter (Burcaw et al., 2015), and subsequent studies have reported correlation lengths that compare with axon diameter (Fieremans et al., 2016; Lee et al., 2018).
An interesting consequence of finding that extra-axonal space can also report on axon diameter is that this may in fact have influenced prior axon diameter mapping studies. In some studies involving tissues with large axons and/or using systems with strong gradients, it may be that much of the sensitivity to axon diameter was derived primarily from intra-axonal water diffusion characteristics (Assaf et al., 2008; Barazany et al., 2009; Huang et al., 2020; Ong and Wehrli, 2010; Stanisz et al., 1997; Veraart et al., 2020; Xu et al., 2014). However, for the majority of in vivo human brain studies, gradient strength will only be sufficient to attenuate intra-axonal signals from the largest axons, and so axon diameter measures will tend to be high (Alexander et al., 2010; Huang et al., 2015). In these cases, axon diameters may also be overestimated because the contribution from extra-axonal space is neglected in the analysis. It is likely that inclusion of extra-axonal water signal in such models could improve the sensitivity to smaller axon diameters.
The ΔD⊥ presented in this work was sensitive to a single metric of axon diameter, 〈d〉eff, even while the underlying distribution of axon sizes may be somewhat broad. Since 〈d〉eff is weighted towards larger diameters in the distribution, it includes contribution both from the mean and the variance of the diameter distribution. Still, it might be possible for advanced diffusion encoding schemes to estimate more complex characteristics of axons in tissue. Some recent studies have also characterized the distribution of axon diameter as a single representative value (Veraart et al., 2020), while other recent studies have looked to estimate the distribution of axon diameters (Anaby et al., 2019; Romascano et al., 2020). Since intra- and extra-axonal water diffusion is sensitive to different measures of axon diameter (see the Appendix), and given the near linear dependence of ΔDe⊥ on axon size and the near quadratic dependence of ΔDi⊥, it may be possible to incorporate multiple oscillating gradient, pulsed gradient and/or double diffusion encoding schemes to estimate parameters like the variance of the axon diameter distribution, extra-axonal volume fraction, and/or g-ratio, (Ianu et al., 2017; Kakkar et al., 2018; Shemesh, 2018). We note that, in some regions of white matter, the distribution of axon diameter may not be well represented by the log-normal distribution used in this and previous studies, and the single-parameter measure for diameter may break down in tissues with axon diameter distributions that are multimodal.
There are several limitations to this study. First, while the simple 2D geometry allows simulation of water diffusion over such a broad range of tissue properties in a reasonable computation time, the model of white matter consists of only axons within the arena, and neglects signal from other possible compartments (glial cell bodies, blood, CSF, etc.) that could influence D⊥. Further, the simulation ignores potential dispersion of axons along white matter fiber bundles, which is also present in white matter (Zhang et al., 2012). Future studies can explore these relationships in more realistic geometries of white matter, such as recently developed methods using synthetic (Ginsburger et al., 2019; 2018; Palombo et al., 2019) and histology based geometries (Lee et al., 2020; 2019).
Second, the diffusion experiments simulated in this work were not optimally designed for either human or small animal imaging systems. Sensitivity of ΔD⊥ to axon diameter depends on the difference in diffusion times (as illustrated in Fig. 7) but also on the image signal-to-noise ratio (SNR). For D⊥ = 0.5μm2/ms and b = 0.3ms/μm2, we used a z-score threshold method (Nilsson et al., 2017) to compute the number of voxels needed within a region of interest (ROI) to detect a given ΔD⊥ for a given SNR—see Table 1. For example, to detect ΔD⊥ = 0.1μm2/ms, which corresponds to 〈d〉eff ≈3μm, 11 voxels are required when SNR = 20 and only 2 voxels are needed when SNR = 50. In practice, gradient strength and slew rate will affect both diffusion time and SNR (through its effect on echo time). Similar to previous work (Drobnjak et al., 2016; Nilsson et al., 2017), gradient waveforms can be optimized by considering contributions of both intra- and extra-axonal water, including effects of transverse relaxation. Also, instead of sinusoidal oscillating gradients, trapezoid-based oscillating gradient gradient waveform and tensor encoding using 2 gradient channels simultaneously can provide more efficient diffusion encoding (Baron and Beaulieu, 2014). Ultimately, the practical limits of using ΔD⊥ to measure axon diameter in the presence of noise remains to be determined.
Table 1.
Number of voxels in an ROI necessary to detect ΔD⊥ for a given signal-to-noise ratio (SNR), using the z-score threshold method outlined in Nilsson et al. (2017).
| ΔD⊥ (μm2/ms) | ||||
|---|---|---|---|---|
| 0.05 | 0.10 | 0.20 | ||
| SNR | 20 | 41 | 11 | 3 |
| 50 | 7 | 2 | 1 | |
Lastly, the trends in ΔD(t) with 〈d〉eff, g and ve have not been validated. Future studies should be aimed at validating these studies in animal models. Further, studies should be aimed at bridging the gap between the simple metrics outlined here and previously published theoretical studies of diffusion in extra-axonal water.
5. Conclusion
In this work, Monte Carlo simulations were used to show that the difference in the radial diffusivity measured at multiple diffusion times can be used as a metric of axon diameter in white matter, being relatively independent of extra-axonal volume fraction, g-ratio, heterogeneity of axon size, and water exchange.
Funding
This work was supported by NIH grant R01EB019980. CB salary support from Canada Research Chairs.
Appendix A. Effective diameters of intra- and extra-axonal water
Data from the simulation sets in this manuscript were used to analyze the appropriate effective measure of axon diameter for intra- and extra-axonal compartments individually and collectively for the trend in ΔD⊥. Considering the effective diameter defined in Eq. (1), all relevant values of p ≤ 6 were analyzed.
Fig. A1.
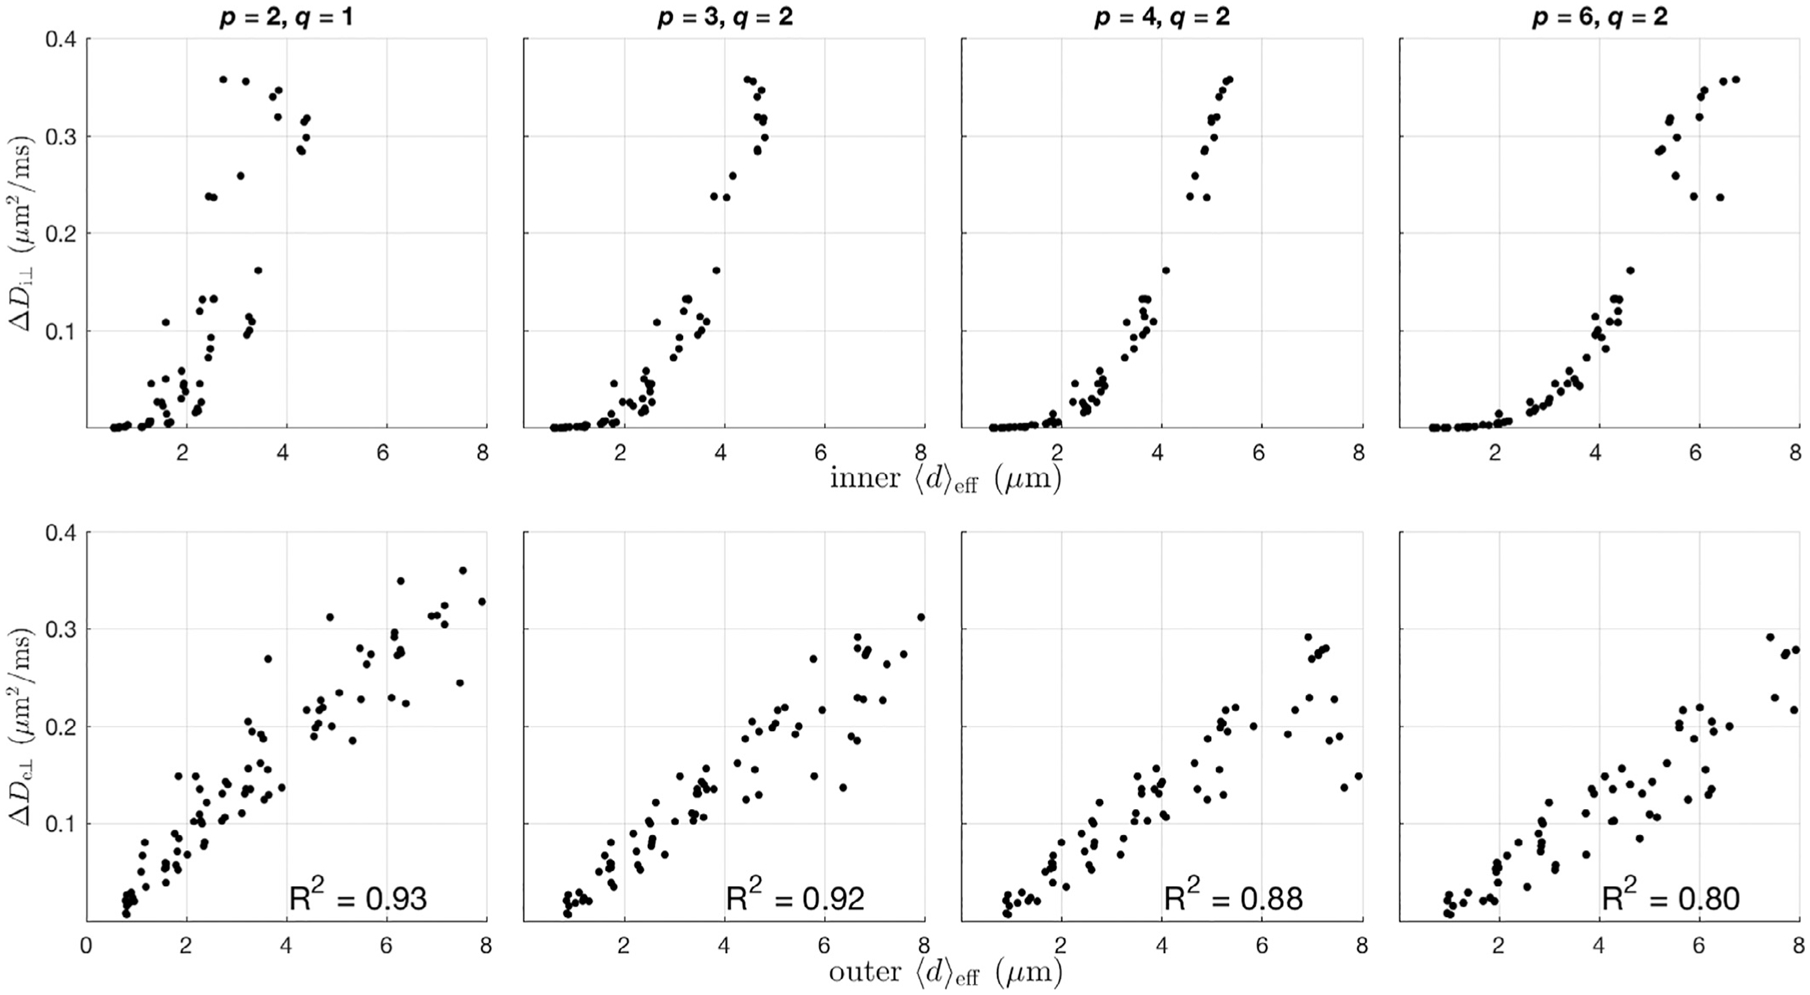
Data from simulation set III was used to investigate the appropriate index of axon diameter appropriate for diffusion in intra- and extra-axonal water diffusion. Top: ΔDi⊥ vs inner 〈d〉eff for notable combinations of p, and q as defined in Eq. (1). Bottom: ΔDe⊥ vs outer 〈d〉eff. Intra-axonal water best corresponds to 〈d〉eff defined with p =4 & q = 2, while extra-axonal water best corresponds to an outer effective diameter with p = 2 & q = 1.
Fig. A2.

Data from simulation set IV was used to investigate the best index of axon diameter of the simulated ΔD⊥, plotted as a function of inner 〈d〉eff (top) and outer 〈d〉eff (bottom). Note that at larger axon diameters, the variance of ΔD⊥ is smaller when defining 〈d〉eff as the inner diameter compared to the outer diameter. Similarly, at smaller axon diameters, the variance of ΔD⊥ is smaller when defining 〈d〉eff as the outer diameter compared to the inner diameter.
Simulation set III was used to analyze the relationship between intra- and extra-axonal compartmental diffusion with 〈d〉eff, as this simulation set provides both a wide variety for the extra-axonal volume fraction, and intra-axonal size and size distribution. Fig. A1 shows ΔDi⊥ vs inner 〈d〉eff (top) and ΔDe⊥ vs outer 〈d〉eff (bottom) for notable combinations of p and q. Note that the variance in ΔDi⊥ appears to be minimized with p = 4 & q = 2—a value that has previously been used as an axon diameter index for diffusion imaging (Burcaw et al., 2015). For extra-axonal diffusion, the linear correlation coefficient is highest for ΔDe⊥ when p = 2 & q = 1, although the trend is similar for all cases shown.
Simulation set IV was used to analyze the relationship between total water diffusion with 〈d〉eff because the variation in g-ratio uncouples the inner and outer axon diameters. From simulation set IV, Fig. A2 shows ΔD⊥ vs inner 〈d〉eff (top) and outer 〈d〉eff (bottom). Note that when axon diameters are small, there is less variation in ΔD⊥ when plotted vs outer 〈d〉eff, while at larger axon diameters, there is less variation in ΔD⊥ when plotted vs inner 〈d〉eff. Therefore, the appropriate definition of d—being inner vs outer diameter—in the calculation of 〈d〉eff may depend upon the axon size being probed. Throughout this work, 〈d〉eff was defined as the inner diameter with p = 4 and q = 2, as that provided the clearest relationship with ΔD⊥ over the entire range of axon diameters studied.
Footnotes
Declaration of Competing Interest
None
References
- Alexander DC, Hubbard PL, Hall MG, Moore E.a., Ptito M, Parker GJM, Dyrby TB, 2010. Orientationally invariant indices of axon diameter and density from diffusion MRI.. NeuroImage 52 (4), 1374–1389. doi: 10.1016/j.neuroimage.2010.05.043. [DOI] [PubMed] [Google Scholar]
- Anaby D, Morozov D, Seroussi I, Hametner S, Sochen N, Cohen Y, 2019. Single- and double-Diffusion encoding MRI for studying ex vivo apparent axon diameter distribution in spinal cord white matter. NMR Biomed. 32 (12), 1–17. doi: 10.1002/nbm.4170. [DOI] [PubMed] [Google Scholar]
- Arbabi A, Kai J, Khan AR, Baron CA, 2020. Diffusion dispersion imaging: mapping oscillating gradient spin-echo frequency dependence in the human brain. Magn. Reson. Med 83 (6), 2197–2208. doi: 10.1002/mrm.28083. [DOI] [PubMed] [Google Scholar]
- Assaf Y, Blumenfeld-Katzir T, Yovel Y, Basser PJ, 2008. AxCaliber: a method for measuring axon diameter distribution from diffusion MRI.. Magn. Reson. Med 59 (6), 1347–1354. doi: 10.1002/mrm.21577. [DOI] [PMC free article] [PubMed] [Google Scholar]
- Barazany D, Basser PJ, Assaf Y, 2009. In vivo measurement of axon diameter distribution in the corpus callosum of rat brain. Brain : A J. Neurol 132 (Pt 5), 1210–1220. doi: 10.1093/brain/awp042. [DOI] [PMC free article] [PubMed] [Google Scholar]
- Baron CA, Beaulieu C, 2014. Oscillating gradient spin-echo (OGSE) diffusion tensor imaging of the human brain. Magn. Reson. Med 72 (3), 726–736. doi: 10.1002/mrm.24987. [DOI] [PubMed] [Google Scholar]
- Berthold C, Nilsson I, Rydmark M, 1983. Axon diameter and myelin sheath thickness in nerve fibres of the ventral spinal root of the seventh lumbar nerve of the adult and developing cat. J. Anatom 136 (3), 483–508. [PMC free article] [PubMed] [Google Scholar]
- Burcaw LM, Fieremans E, Novikov DS, 2015. Mesoscopic structure of neuronal tracts from time-dependent diffusion. NeuroImage 114, 18–37. doi: 10.1016/j.neuroimage.2015.03.061. [DOI] [PMC free article] [PubMed] [Google Scholar]
- Buzsáki G, Mizuseki K, 2014. The log-dynamic brain: how skewed distributions affect network operations.. Nat. Rev. Neurosci 15 (4), 264–278. doi: 10.1038/nrn3687. [DOI] [PMC free article] [PubMed] [Google Scholar]
- Dell’Acqua F, Dallyn R, Chiappiniello A, Beyh A, Tax C, Jones D, Catani M, 2019. Temporal Diffusion Ratio (TDR): a diffusion MRI technique to map the fraction and spatial distribution of large axons in the living human brain. In: Proc ISMRM, p. 64. [Google Scholar]
- Drobnjak I, Zhang H, Ianu A, Kaden E, Alexander DC, 2016. PGSE, OGSE, and sensitivity to axon diameter in diffusion MRI: Insight from a simulation study. Magn. Reson. Med 75 (2), 688–700. doi: 10.1002/mrm.25631. [DOI] [PMC free article] [PubMed] [Google Scholar]
- Fieremans E, Burcaw LM, Lee HH, Lemberskiy G, Veraart J, Novikov DS, 2016. In vivo observation and biophysical interpretation of time-dependent diffusion in human white matter. NeuroImage 129, 414–427. doi: 10.1016/j.neuroimage.2016.01.018. [DOI] [PMC free article] [PubMed] [Google Scholar]
- Ginsburger K, Matuschke F, Poupon F, Mangin JF, Axer M, Poupon C, 2019. MEDUSA: a GPU-based tool to create realistic phantoms of the brain microstructure using tiny spheres. NeuroImage 193 (November 2018), 10–24. doi: 10.1016/j.neuroimage.2019.02.055. [DOI] [PubMed] [Google Scholar]
- Ginsburger K, Poupon F, Beaujoin J, Estournet D, Matuschke F, Mangin J-F, Axer M, Poupon C, 2018. Improving the realism of white matter numerical phantoms: a step toward a better understanding of the influence of structural disorders in diffusion MRI. Front. Phys 6 (February), 1–18. doi: 10.3389/fphy.2018.00012. [DOI] [Google Scholar]
- Grussu F, Ianu A, Tur C, Prados F, Schneider T, Kaden E, Ourselin S, Drobnjak I, Zhang H, Alexander DC, Gandini Wheeler-Kingshott CA, 2019. Relevance of time-dependence for clinically viable diffusion imaging of the spinal cord. Magn. Reson. Med 81 (2), 1247–1264. doi: 10.1002/mrm.27463. [DOI] [PMC free article] [PubMed] [Google Scholar]
- Hall MG, Alexander DC, 2009. Convergence and parameter choice for Monte-Carlo simulations of diffusion MRI.. IEEE Trans. Med. Imaging 28 (9), 1354–1364. doi: 10.1109/TMI.2009.2015756. [DOI] [PubMed] [Google Scholar]
- Harkins KD, Does MD, 2016. Simulations on the influence of myelin water in diffusion-weighted imaging. Phys. Med. Biol 61 (13), 4729–4745. doi: 10.1088/0031-9155/61/13/4729. [DOI] [PMC free article] [PubMed] [Google Scholar]
- Harkins KD, Dula AN, Does MD, 2012. Effect of Intercompartmental Water Exchange on the Apparent Myelin Water Fraction in Multiexponential T2 Measurements of Rat Spinal Cord. Magn. Reson. Med 67 (3), 793–800. doi: 10.1002/mrm.23053. [DOI] [PMC free article] [PubMed] [Google Scholar]
- Huang SY, Nummenmaa A, Witzel T, Duval T, Cohen-Adad J, Wald LL, Mc-Nab JA, 2015. The impact of gradient strength on in vivo diffusion MRI estimates of axon diameter. NeuroImage 106, 464–472. doi: 10.1016/j.neuroimage.2014.12.008. [DOI] [PMC free article] [PubMed] [Google Scholar]
- Huang SY, Tian Q, Fan Q, Witzel T, Wichtmann B, McNab JA, Daniel Bireley J, Machado N, Klawiter EC, Mekkaoui C, Wald LL, Nummenmaa A, 2020. High-gradient diffusion MRI reveals distinct estimates of axon diameter index within different white matter tracts in the in vivo human brain. Brain Struct. Funct 225 (4), 1277–1291. doi: 10.1007/s00429-019-01961-2. [DOI] [PMC free article] [PubMed] [Google Scholar]
- Ianu A, Shemesh N, Alexander DC, Drobnjak I, 2017. Double oscillating diffusion encoding and sensitivity to microscopic anisotropy. Magn. Reson. Med 78 (2), 550–564. doi: 10.1002/mrm.26393. [DOI] [PMC free article] [PubMed] [Google Scholar]
- Kakkar LS, Bennett OF, Siow B, Richardson S, Ianu A, Quick T, Atkinson D, Phillips JB, Drobnjak I, 2018. Low frequency oscillating gradient spin-echo sequences improve sensitivity to axon diameter: An experimental study in viable nerve tissue. NeuroImage 182 (July 2017), 314–328. doi: 10.1016/j.neuroimage.2017.07.060. [DOI] [PubMed] [Google Scholar]
- van der Knaap MS, Valk J, 2005. Magnetic Resonance of Myelination and Myelin Disorders. Springer, Berlin, New York, p. 7. [Google Scholar]
- Lam WW, Jbabdi S, Miller KL, 2014. A model for extra-axonal diffusion spectra with frequency-dependent restriction.. Magn. Reson. Med 73 (6), 2306–2320. doi: 10.1002/mrm.25363. [DOI] [PMC free article] [PubMed] [Google Scholar]
- Lee HH, Fieremans E, Novikov DS, 2018. What dominates the time dependence of diffusion transverse to axons: Intra- or extra-axonal water? NeuroImage 182 (July 2017), 500–510. doi: 10.1016/j.neuroimage.2017.12.038. [DOI] [PMC free article] [PubMed] [Google Scholar]
- Lee H-H, Papaioannou A, Kim S-L, Novikov DS, Fieremans E, 2020. A time-dependent diffusion MRI signature of axon caliber variations and beading. Commun. Biol 3 (1), 354. doi: 10.1038/s42003-020-1050-x. [DOI] [PMC free article] [PubMed] [Google Scholar]
- Lee HH, Yaros K, Veraart J, Pathan JL, Liang FX, Kim SG, Novikov DS, Fieremans E, 2019. Along-axon diameter variation and axonal orientation dispersion revealed with 3D electron microscopy: implications for quantifying brain white matter microstructure with histology and diffusion MRI. Brain Struct. Funct 224 (4), 1469–1488. doi: 10.1007/s00429-019-01844-6. [DOI] [PMC free article] [PubMed] [Google Scholar]
- MacKay A, Whittall K, Adler J, Li D, Paty D, Graeb D, 1994. In vivo visualization of myelin water in brain by magnetic resonance.. Magn. Reson. Med 31 (6), 673–677. [DOI] [PubMed] [Google Scholar]
- Nilsson M, Lasič S, Drobnjak I, Topgaard D, Westin CF, 2017. Resolution limit of cylinder diameter estimation by diffusion MRI: the impact of gradient waveform and orientation dispersion. NMR in Biomed. 30 (7), 1–13. doi: 10.1002/nbm.3711. [DOI] [PMC free article] [PubMed] [Google Scholar]
- Novikov DS, Fieremans E, Jespersen SN, Kiselev VG, 2019. Quantifying brain microstructure with diffusion MRI: theory and parameter estimation. NMR in Biomed. 32 (4), e3998. doi: 10.1002/nbm.3998. [DOI] [PMC free article] [PubMed] [Google Scholar]
- Novikov DS, Kiselev VG, 2010. Effective medium theory of a diffusion-weighted signal.. NMR Biomed. 23 (7), 682–697. doi: 10.1002/nbm.1584. [DOI] [PubMed] [Google Scholar]
- Ong HH, Wehrli FW, 2010. Quantifying axon diameter and intra-cellular volume fraction in excised mouse spinal cord with q-space imaging.. NeuroImage 51 (4), 1360–1366. doi: 10.1016/j.neuroimage.2010.03.063. [DOI] [PMC free article] [PubMed] [Google Scholar]
- Padron F, Feiweier T, Beaulieu C, 2019. Oscillating gradient spin-echo diffusion tensor imaging of the human brain using FLAIR. In: Proceeding of the ISMRM, p. 157. [Google Scholar]
- Palombo M, Alexander DC, Zhang H, 2019. A generative model of realistic brain cells with application to numerical simulation of the diffusion-weighted MR signal. NeuroImage 188 (December 2018), 391–402. doi: 10.1016/j.neuroimage.2018.12.025. [DOI] [PubMed] [Google Scholar]
- Panagiotaki E, Schneider T, Siow B, Hall MG, Lythgoe MF, Alexander DC, 2012. Compartment models of the diffusion MR signal in brain white matter: a taxonomy and comparison.. NeuroImage 59 (3), 2241–2254. doi: 10.1016/j.neuroimage.2011.09.081. [DOI] [PubMed] [Google Scholar]
- Romascano D, Barakovic M, RafaelPatino J, Dyrby TB, Thiran J, Daducci A, 2020. ActiveAx ADD : toward nonparametric and orientationally invariant axon diameter distribution mapping using PGSE. Magn. Reson. Med 83 (6), 2322–2330. doi: 10.1002/mrm.28053. [DOI] [PubMed] [Google Scholar]
- Sampaio-Baptista C, Johansen-Berg H, 2017. White matter plasticity in the adult brain. Neuron 96 (6), 1239–1251. doi: 10.1016/j.neuron.2017.11.026. [DOI] [PMC free article] [PubMed] [Google Scholar]
- Schachter M, Does MD, Anderson a.W., Gore JC, 2000. Measurements of restricted diffusion using an oscillating gradient spin-echo sequence.. J. Magn. Reson. (San Diego, Calif. : 1997) 147 (2), 232–237. doi: 10.1006/jmre.2000.2203. [DOI] [PubMed] [Google Scholar]
- Seidl AH, 2014. Regulation of conduction time along axons. Neuroscience 276, 126–134. doi: 10.1016/j.neuroscience.2013.06.047. [DOI] [PMC free article] [PubMed] [Google Scholar]
- Shemesh N, 2018. Axon diameters and myelin content modulate microscopic fractional anisotropy at short diffusion times in fixed rat spinal cord. Front. Phys 6 (49), 1–15. doi: 10.3389/fphy.2018.00049. [DOI] [Google Scholar]
- Stanisz GJ, Szafer A, Wright G.a., Henkelman RM, 1997. An analytical model of restricted diffusion in bovine optic nerve.. Magn. Reson. Med 37 (1), 103–111. [DOI] [PubMed] [Google Scholar]
- Stejskal E, Tanner J, 1965. Spin diffusion measurements: spin echoes in the presence of a time-dependent field gradient. J. Chem. Phys 42 (1), 288. [Google Scholar]
- Stepinik J, 1981. analysis of nmr self-diffusion measurements by a density matrix calculation. Physica B+ C 104 (3), 350–364. [Google Scholar]
- Stewart W.a., MacKay a.L., Whittall KP, Moore GR, Paty DW, 1993. Spin-spin relaxation in experimental allergic encephalomyelitis. Analysis of CPMG data using a non-linear least squares method and linear inverse theory.. Magn. Reson. Med 29 (6), 767–775. [DOI] [PubMed] [Google Scholar]
- Tétreault P, Harkins KD, Baron CA, Stobbe R, Does MD, Beaulieu C, 2020. Diffusion time dependency along the human corpus callosum and exploration of age and sex differences as assessed by oscillating gradient spin-echo diffusion tensor imaging. NeuroImage 210 (January), 116533. doi: 10.1016/j.neuroimage.2020.116533. [DOI] [PubMed] [Google Scholar]
- Vangelderen P, Despres D, Vanzijl P, Moonen C, 1994. Evaluation of restricted diffusion in cylinders. phosphocreatine in rabbit leg muscle. J. Magn. Reson. Series B 103 (3), 255–260. doi: 10.1006/jmrb.1994.1038. [DOI] [PubMed] [Google Scholar]
- Veraart J, Fieremans E, Novikov DS, 2019. On the scaling behavior of water diffusion in human brain white matter. NeuroImage 185 (October 2018), 379–387. doi: 10.1016/j.neuroimage.2018.09.075. [DOI] [PMC free article] [PubMed] [Google Scholar]
- Veraart J, Nunes D, Rudrapatna U, Fieremans E, Jones DK, Novikov DS, Shemesh N, 2020. Nonivasive quantification of axon radii using diffusion MRI. eLife 9, 1–27. doi: 10.7554/eLife.49855. [DOI] [PMC free article] [PubMed] [Google Scholar]
- Xu J, Li H, Harkins KD, Jiang X, Xie J, Kang H, Does MD, Gore JC, 2014. Mapping mean axon diameter and axonal volume fraction by MRI using temporal diffusion spectroscopy.. NeuroImage 103C, 10–19. doi: 10.1016/j.neuroimage.2014.09.006. [DOI] [PMC free article] [PubMed] [Google Scholar]
- Xu J, Li H, Li K, Harkins KD, Jiang X, Xie J, Kang H, Dortch RD, Anderson AW, Does MD, Gore JC, 2016. Fast and simplified mapping of mean axon diameter using temporal diffusion spectroscopy. NMR Biomed. 29 (4), 400–410. doi: 10.1002/nbm.3484. [DOI] [PMC free article] [PubMed] [Google Scholar]
- Zhang H, Schneider T, Wheeler-Kingshott C.a., Alexander DC, 2012. NODDI: practical in vivo neurite orientation dispersion and density imaging of the human brain. NeuroImage 61 (4), 1000–1016. doi: 10.1016/j.neuroimage.2012.03.072. [DOI] [PubMed] [Google Scholar]