Abstract
The present study aims to investigate the effects of mushroom beta glucan (MBG) on wound recovery in partial hepatectomy (PH) in Nile tilapia (Oreochromis niloticus) and in rat skin wound healing examination. Following PH, we focussed on the effects on liver repair ability using in vitro and in vivo tests. In vitro, we examined whether the MBG has an impact on liver cell proliferation, mainly through 3‐(4,5‐dimethylthiazolyl‐2)‐2,5‐diphenyltetrazolium bromide (MTT) assays and bromodeoxyuridine (BrdU) cell proliferation assay detection method. Results showed that MBG treatment was remarkable in enhancing cell proliferation of hepatocytes and in maintaining the cellular viability. Immunohistochemical staining to analyse Wnt/β‐catenin signalling also showed that MBG has the effect of promoting cell proliferation of liver tissues after PH surgery.
Keywords: Growth factor, Histopathology, Immunomodulator, Wnt/β‐catenin signalling, Wound recovery
Introduction
Beta‐glucans (β‐glucan) are a heterogeneous group of glucose polymers consisting of β‐(1,3)‐linked β‐d‐glucopyranosyl units with a β‐(1,6)‐linked side chain of varying distribution and lengths that mainly comprise the outer cell walls of several Chinese medical mushroom and fungi 1, 2. These polysaccharides are of different chemical compositions, with most belonging to the group of β‐glucans; these have β‐(1 → 3) linkages in the primary chain of the glucan and additional β‐(1 → 6) branch points that are needed for their bioactive response 3. Research has shown that β‐glucans are pathogen‐associated molecular pattern molecules (PAMPs) and are recognised by pattern recognition receptors (PRRs) such as toll‐like receptors (TLRs) or NOD‐like receptors (NLRs), and they also activate transcription of pro‐inflammatory genes 4. Moreover, they are demonstrated to possess immunostimulatory activity and enhance wound healing especially by increasing macrophage infiltration into the injury sites and stimulating tissue regeneration 5, 6. Our earlier review articles have discussed about the inflammatory factors involved in wound healing 7 and the mushroom β‐glucan (MBG) involved in modulating the immune system 8. In addition, clinical investigations have also indicated the efficacy of β‐glucan therapy in wound healing 9. These polymers can also influence the innate and cell‐mediated immunity through interactions with T cells, monocytes, macrophages and polymorphonuclear leucocytes to modulate the immune response in an appropriate way that can enhance the host's immune response to certain infections 10. These observations point that β‐glucans may be useful for healing, particularly in wounds. Therefore, the present study attempts to investigate the effect of β‐glucan on tissue regeneration following partial hepatectomy (PH) and wound skin examination. Furthermore, we also investigate whether the MBG can alter the inflammatory factors involved in inflammation in the wound healing process and enhance the production of tissue recovery factors to induce tissue repair.
Materials and methods
Animal
Tilapia (Oreochomis niloticus) fish were obtained from the Freshwater Aquaculture Research Center in Lukang, Taiwan. After transferring to the laboratory, the fish were cultured until the body weight of each tilapia reached ∼40 g. All study procedures were performed in accordance with the protocol approved by the National Taiwan University Animal and Use Committee (NTUAUC)
MBG from Ganoderma lucidum
Our previous study has illustrated that the safety assessment of MBG 11. In the present study, we attempt to use the purified β‐glucan derived from Ganoderma lucidum for wound healing. In this experiment, mycelium of G. lucidum, sub‐cultured and maintained in sterile YM agar (0·02%), was used for the production of MBG. The manufacturing process was initiated by preparing a culture medium containing glucose, lactose, galactose, sucrose, mannose and yeast extract. Mycelium of G. lucidum was then introduced into the sterile medium and cultured in a shaker incubator at temperatures ranging from 27°C to 32°C for 3–5 weeks to achieve a full polymerisation of MBG in the culture system. Subsequently, MBG from the cultured mycelia was homogenised and disrupted using high‐speed homogeniser and ultrasonic vibration. The MBG solution was then filtered and concentrated using a ceramic membrane to strip most of the residual small molecular fractions in the solution. The concentrated MBG was dried by lyophilisation and then ground into powdered form. The sample was demonstrated to contain ∼95% carbohydrate, 1% fat, 1% protein, 2% ash and 0·8% water. Using Megazyme (Ireland) mushroom and yeast Beta‐Glucan Kit, the MBG powder was demonstrated to contain ∼60–65% of MBG. The molecular weight of MBG was analysed by high‐pressure liquid chromatographic (HPLC) using Shodex sugar KS series containing KS‐G, KS‐804 and KS‐805 columns and detected using RI 2000 detector. The molecular weight was determined by referring to the standard curve using standard molecules including STDP‐800 [molecular weight (MW) 8 × 10⁵], STDP‐400 (MW 4 × 10⁵), STDP‐200 (MW 2 × 10⁵), STDP‐100 (MW 1 × 10⁵) and STDP‐20 (MW 2 × 10⁴). The MBG was also processed for analysis of its glycosyl linkages. The sample was pre‐methylated, depolymerised, reduced and acetylated. The resultant partially methylated alditol acetates (PMAAs) were then analysed by gas chromatography–mass spectrometry (GC–MS) according to the procedures described by York et al. and Ciucanu et al. 12, 13.
Partial hepatectomy
The tilapia were deprived of food for 24 hour before surgery. The fish were placed on a wet sponge with the ventral side facing upwards and the ventral body wall was opened with an incision of about 10–15 mm. The ventral liver was carefully removed from the peritoneal cavity without damaging the remaining liver tissue. Removal of the liver led to about 10–15 mm PH. The remaining liver was carefully replaced in the peritoneal cavity. Finally, the body wall was closed using Medbon liquid topical tissue adhesive (CA1999, CP Medical Portland, OR, USA).
Experimental process
First, we examined whether the β‐glucan modulated the hepatocyte responses through in vitro examination of cellular viability by 3‐(4,5‐dimethylthiazolyl‐2)‐2,5‐diphenyltetrazolium bromide (MTT) assay and cellular proliferation by bromodeoxyuridine (BrdU) enzyme‐linked immunosorbant assay (ELISA) assay. Second, we divided the experimental groups into control, sham and PH groups with or without MBG pre‐treatment to be investigated for the regeneration response. The experimental process is shown in Table 1.
Table 1.
Process of in vivo experimental design*
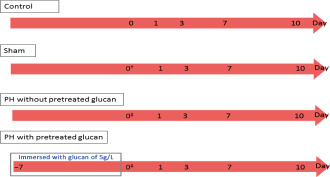
Tilapia was euthanised on days 1, 3, 7 and 10.
Ventral body wall was opened with an incision of about 10–15 mm.
Partial hepatectomy.
Experimental parameter
In vitro test
The liver was removed from the tilapia and 1 × 10⁶ cells were counted and collected from the liver tissue. The cells were cultured in a 96‐well culture plate containing culture medium (RPMI‐1640, Gibco) and 5 g/l and 10 g/l of β‐glucan for 1, 2, 3 and 4 days at 27°C. After culturing, the cell viability and cellular proliferation were examined. The research was performed with ten independent experiments.
Cell viability
The cell viability was examined by using MTT assay to select the in vitro appropriate concentration of hydrogen peroxide functional role in the macrophage 14, 15, 16. At the end of incubation, the cultured medium was removed and 10 µl (5 mg/ml) of MTT (Sigma; Uni‐onward Company, New Taipei, Taiwan) was loaded with the medium and incubated at 27°C for 4 hours. Thereafter, 200 µl of dimethylsulfoxide (DMSO) was added to dissolve the formazan, measured by microplate Spectrophotometer (μQunat, BioTek; Tseng Hsiang Life Science Ltd, Taipei, Taiwan) at 590 nm.
The formula of stimulation ratio: (O.D. 590 nm in treatment/O.D. 590 nm in control).
Cellular proliferation
The proliferation of hepatocytes was also determined using a colorimetric immunoassay for the quantification of cell proliferation, based on the measurement of BrdU incorporation during DNA synthesis. The BrdU ELISA was performed according to the manufacturer's instructions. Cells were pulsed with 20 µl/well of BrdU solution in 200 µl culture medium to detect the differences of BrdU incorporation during cellular DNA synthesis at different time points by using the BrdU Cell Proliferation Assay kit (No. 2752, Millipore). The absorbance was measured at 450 nm using an ELISA plate reader (μQunat, BioTek). The blank corresponded to 200 µl of culture medium with or without BrdU.
The cellular proliferation ratio: (O.D. 450 nm in treatment/O.D. 450 nm in control).
Wound healing
A total of 1 × 10⁵ zebrafish liver cells (ZFLs, purchased from BCRC, Taiwan; BCRC # 60454) were cultured in the 96‐well plate with L15 medium (Sigma) supplemented with 5% FBS (Gibco; Uni‐onward Company) for 24 hours to confirm the cell growth. The examination was repeated for five times, and the wound healing was assessed using a 96‐well floating‐pin transfer device scraped using a 200 µl pipette tip to form a scratch wound. The wounded monolayers were then washed twice with serum‐free media to remove cell debris and incubated with different concentrations with or without MBG to be observed at different time points 17, 18.
In vivo test
Immunohistochemistry of liver morphology
Livers were fixed in 4% paraformaldehyde (PFA) overnight at 4°C and washed in phosphate‐buffered saline (PBS), dehydrated and embedded in paraffin. Histological staining of 6 µm thick paraffin sections and immunohistochemical analysis of paraffin sections with the antibodies were performed using anti‐proliferating cell nuclear antigen (PCNA) (MA5‐11358, Thermo; Level Biotechnology Inc., New Taipei, Taiwan) and anti‐Ki‐67 (AB9260, Millipore; UniMed, Taipei, Taiwan) antibody. The immunohistochemistry stain image was analysed by ImageJ. The research was performed with five independent experiments. In the Wnt signalling examination, β‐catenin was observed by confocal laser scanning microscope (Zeiss LSM 780 Confocal) for capturing the representative images of each sample.
| Primary antibody | Source | Dilution (PBS) |
|---|---|---|
| Mouse Anti‐PCNA | MA5‐11358, Thermo | 1:100 |
| Mouse Anti‐Ki‐67 | AB9260, Millipore | 1:100 |
| Mouse Anti‐β catenin | 610153, BD | 1:100 |
| Secondary antibody | ||
| FITC‐conjugated goat anti‐mouse IgG (green) | BioLgend (DyLight 488) | 1:200 |
| Chromeo™ 642 goat anti‐mouse IgG (Red) | Active motif (15054) | 1:200 |
Histopathological observations
A histopathological comparison was performed on the liver tissues from the group that received MBG treatment, PH and the control group to be observed after 24 hours after the surgery. The liver tissues were fixed in neutralised buffered formalin for observation under the microscope using PAS or PTAH staining. The research was performed with five independent experiments.
Quantitative RT‐PCR
A reverse transcription polymerase chain reaction (RT‐PCR) for detection of gene expression was conducted using a High‐Capacity cDNA Reverse Transcription Kit (Applied Biosystems; Life Technologies CO., Ltd., Taipei, Taiwan) and paq polymerase master mix red (Ampliqon; Aurorabiotech Co.,Ltd, Taipei, Taiwan) beginning at 94°C for 4 minutes and cycle conditions of 1 minute at 94°C, 1 minute at 56°C and 1 minute at 72°C for 35 cycles. The tilapia (O. niloticus) primers of beta‐actin (reference gene) and observed gene were designed by Gene Bank. Quantitative RT‐PCR analysis was performed using iQTM SYBR Green Supermix (Bio‐Rad; Genmall BioTechnology CO., Ltd, Taipei, Taiwan) by CFX384™ Real‐Time PCR Detection System (Bio‐Rad). The levels of reaction products were normalised to equivalent amplifications of beta‐actin as positive control. The primer sequences are shown in Table 2, and the experiment was performed with five independent experiments.
Table 2.
Primer sequences
| Target gene | GenBank # | Forward sequence (5′ to 3′) | Reverse sequence (5′ to 3′) |
|---|---|---|---|
| β‐Actin | EU887951.1 | GGCTGTGCTGTCCCTGTA | GGGCATAACCCTCGTAGAT |
| TNF‐α | AY428948.1 | TCAGAGTCTATGGGAAGC | CAGGTAAATGGCGTTGTA |
| IL‐8 | GQ355864.1 | TTCAGGCTTCATCTACTTT | ACAGGTGGCGAACAGG |
| IGF‐1 | EU272149.1 | GTGGACGAGTGCTGCTTC | CCCTTGTTCGGTCTGCTA |
| GF | HM565014.1 | TTGATGGGTCACAGGTCC | GCAGCAAGATTCCCGTTT |
| FGF‐20α | JN860433.1 | ATCAAGATAACGCAGGAGT | TGAGCAAGTGAGCGAATG |
FGF‐20α, fibroblast growth factor 20α; GF, growth factor; IGF‐1, insulin‐like growth factor 1; IL‐8, Interleukin‐8; TNF‐α, tumour necrosis factor‐α.
Murine skin wound healing
Murine animal experiment
The following experimental procedure was carried out using the rat wound healing model assay 19, 20. All study procedures were performed in accordance with the protocol approved by the NTUAUC. We used 6‐week‐old male Wistar rats (n = 15, purchased from Laboratory Animal Center, National Taiwan University College of Medicine) for this experiment. Animals were housed in the Animal Housing Facility of National Taiwan University, College of Life Science, in polycarbonate cages with paddy husk bedding in the animal room. The room temperature and relative humidity were maintained at 21 ± 2°C and 55 ± 20%, respectively, with a 12‐hour light/dark cycle. Four regions measuring 2·4 × 2·4 cm were marked in the clipped area of the animals, and a 1·5 × 1·5 cm full‐thickness incision wound was made in one of the regions. Each wound was secured with the full‐thickness suture method by monofilament (NTUAUC, Taipei, Taiwan).
Wound healing assay
The experimental group was divided into four groups that included (i) Control group: autoclaved (121°C, 15 minutes) PBS (Sigma) was used, (ii) MBG (Glucan group): mushroom polysaccharides (5 g/l PBS), (iii) Blank [hydroxyethyl cellulose (HEC) Group]: 2 g of HEC powder was added to 100 ml of PBS and (iv) MBG with hydroxyethyl cellulose (HEC + Glucan group): 2 g of hydroxyethyl cellulose powder was added to 100 ml of mushroom polysaccharides. The treatment materials were stored in a spray bottle and were used to spray at a volume of 1·7 ml on the wound surface at an interval 2 days for observation of wound healing.
Histopathological observations
A histopathological comparison was performed using the wounded skin tissues from the group after the surgery. The wounded skin tissues were fixed in neutralised buffered formalin for observation under the microscope using H&E and trichrome staining.
Statistical analysis
Experimental data in each treatment group were divided by the control group. The data are displayed as a ratios and differences between treatment and control groups. Student's t‐test, Scheffe analysis and one‐way ANOVA were used to analyse the statistical significance between treatment and control groups. A P value <0·05 was considered to be statistically significant. Results are presented as means ± SEM. (*P < 0·05, **P < 0·01, and we also used different letters to represent a significant difference between the groups (P < 0·05), i.e. a < b, a < c, a < d (P < 0·05); ab is not significantly different from a or b (P > 0·05)).
Results
The effect of MBG on the hepatocyte viability and proliferation
The results of these experiments show that cells in the treatment group incorporate BrdU more effectively than those in the control group after treatment with or without β‐glucan. On day 1, cellular incorporation of BrdU increased significantly with treatment of 10 g/l glucan compared with that in the control and 5 g/l treatment groups. On day 2, it was observed that in the 5 g/l and 10 g/l glucan treatment groups, BrdU incorporation was markedly enhanced in the hepatocytes compared with that in the control group. On day 3, significant enhancement of BrdU incorporation was observed in the 5 g/l glucan treatment group compared with that in the control and 10 g/l glucan treatment groups, as shown in Figure 1. Similar results were also obtained by the MTT examination that was performed to test the effect of β‐glucan on hepatocyte viability (Figure 2A).
Figure 1.
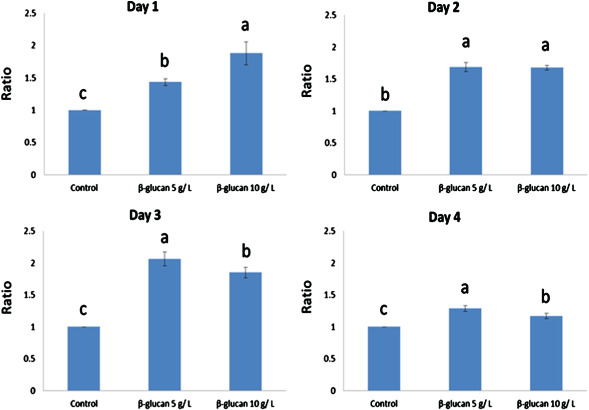
Effect of β‐glucan on hepatocyte viability. The hepatocyte viability was examined by MTT assay using culture medium containing 5 g/l and 10 g/l of β‐glucan, on days 1, 3, 7 and 10. Results are the mean ± SEM of representative values from 10 independent experiments. Statistical differences are indicated by P values.
Figure 2.
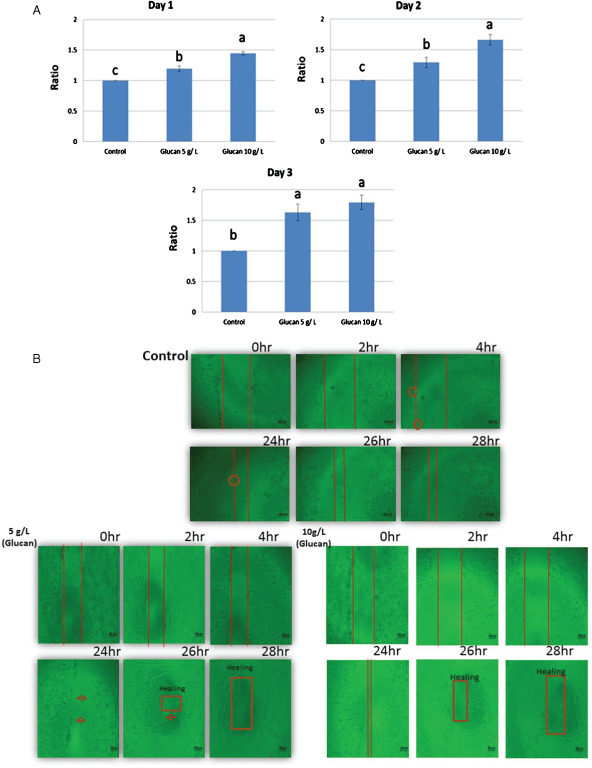
(A) Effect of β‐glucan on hepatocyte proliferation. The hepatocyte proliferation was examined by BrdU enzyme‐linked immunosorbant assay (ELISA) assay using culture medium containing 5 g/l and 10 g/l of β‐glucan, on Day 1, 2 and 3. Results are the mean ± SEM of representative values from 10 independent experiments. Statistical differences are indicated by P values. (B) Mushroom β‐glucan (MBG) stimulation of closure of wounded zebrafish liver cell (ZFL). ZFL monolayers were wounded with a pipette tip and treated with or without different concentration of MBG on Days 1, 3 and 7. The wounded interval is shown in red line.
The wound healing effects of 5 g/l or 10 g/l MBG on cultured zebrafish were examined by microscopic observation. In the presence of 5 g/l or 10 g/l MBG treatment, the closure of the wounded area was significantly accelerated and cells appeared in the wounded gap, which represents enhanced healing of the wounded area (Figure 2B). As shown in the figure, comparison of the control group with the MBG treated group showed significant differences after24, 26 and 28 hours. At 26 hours, the 5 g/l and 10 g/l groups showed almost healing but not the control group.
The effect of MBG on wound repair
The PCNA experimental results on the effect of MBG on cell regeneration after PH are shown in Figure 3 and Ki‐67 experimental results are shown in Figure 4. The results show that, after partial liver resection in the surgery group, the number of cells in the liver tissue in the sample points on the first day and on the third day were significantly higher than those without the partial liver resection surgery; the number of examination points on the third day of the new cells was the highest. Proliferation Index = (PCNA‐positive cells or Ki‐67‐positive cells/DAPI‐positive cells). The PCNA experimental results show that on the first day of examination points: MBG group was significantly higher than the value of the other three groups (Index: 16·330 ± 1·520); partial liver resection followed by the value of the group performance (Index: 11·704 ± 1·283); sham operation group (Index: 7·437 ± 1·403) and control group (Index: 6·950 ± 1·018). The PCNA experimental results also showed that on the third day of examination points, MBG group (Index: 22·371 ± 2·345) was significantly higher than the value of the other three groups and partial liver resection group (Index: 19·853 ± 1·472) performance values significantly higher than the other two groups; the pseudo‐operation group (Index: 7·078 ± 1·970) and control group (Index: 6·950 ± 1·018) had no significant differences between each other. On the seventh day of examination points, no significant differences were observed between the four treatment groups, MBG group (Index: 10·357 ± 1·705), partial liver resection group (Index: 10·692 ± 1·867), sham operation group (Index: 6·603 ± 1·374) and control group (Index: 6·950 ± 1·018). On the 10th day of examination points also, there were significant differences between MBG group (Index: 8·166 ± 0·934), partial liver resection group (Index: 7·797 ± 2·532), sham operation group (Index: 6·590 ± 1·429) and control group (Index: 6·950 ± 1·018). Ki‐67 examination points on the first day of the experiment showed that MBG group values and partial liver resection group were significantly higher than the other three groups (Index: 18·968 ± 2·375); partial liver resection surgery group, followed by the performance value (Index: 13·155 ± 1·545); the sham operation group (Index: 6·717 ± 0·686) and control group (Index: 6·890 ± 1·487) had no significant differences between each other. Ki‐67 experiments on the third day of examination points showed that MBG group (Index: 20·722 ± 2·143) and partial liver resection group (Index: 18·080 ± 1·689) performance values to be significantly higher than the other two groups; sham operation group (Index: 7·948 ± 1·313) and control group (Index: 6·890 ± 1·487) had no significant differences between each other. On the seventh day of examination points, MBG group (Index: 9·976 ± 1·518) and partial liver resection group (Index: 10·591 ± 1·415) performance values were significantly higher than the other two groups; the pseudo‐surgery group (Index: 6·280 ± 1·478) and control group (Index: 6·890 ± 1·487) showed no significant differences between each other. Ki‐67 examination points on the 10th day of the experiment showed no significant differences between MBG group (Index: 6·517 ± 0·989), partial liver resection group (Index: 7·115 ± 1·050), sham operation group (Index: 5·291 ± 0·789) and control group (Index: 6·890 ± 1·487).
Figure 3.
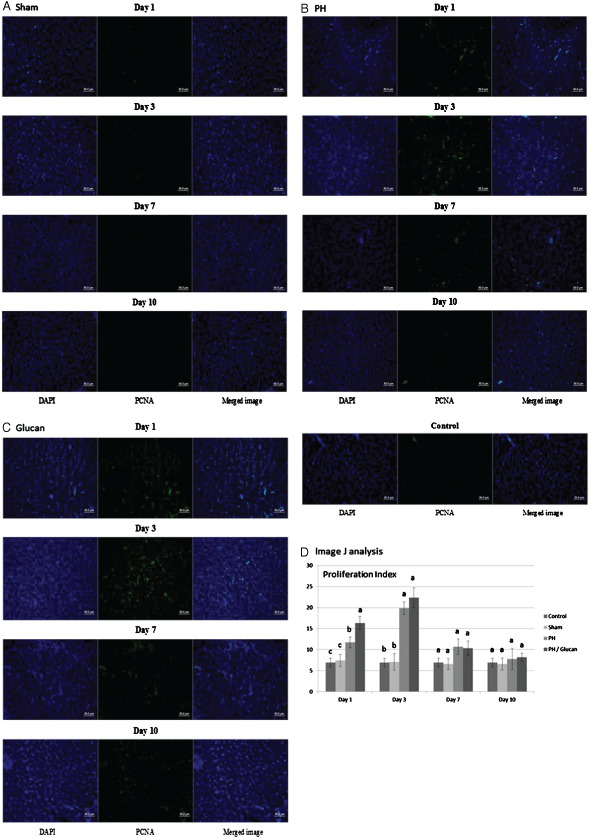
Histological morphological observations of liver repair by proliferating cell nuclear antigen (PCNA) stain. (A) PCNA staining was detected in the sham group. (B) Partial hepatectomy group. (C) Pre‐treated with β‐glucan and were analysed by ImageJ (National Institutes of Health). The research was performed with five independent experiments.
Figure 4.
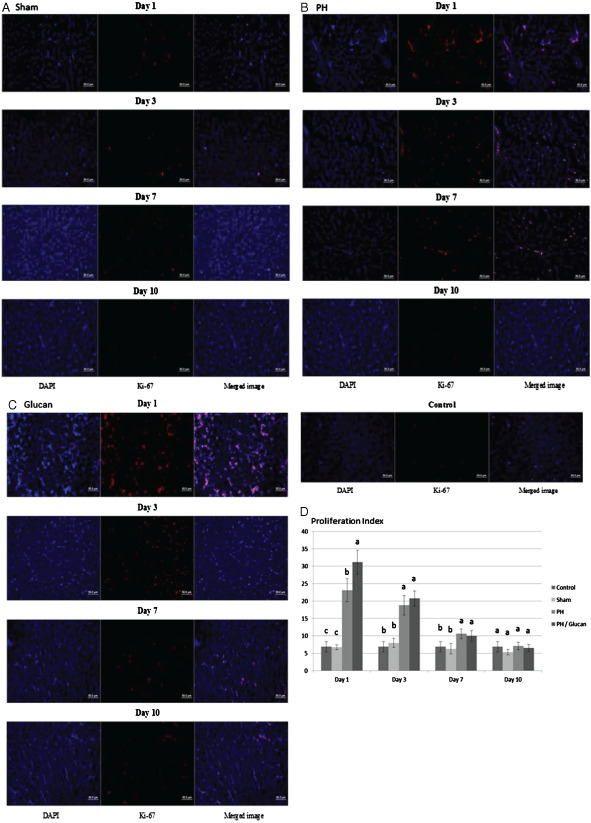
Histological morphological observations of liver repair by Ki‐67 stain. (A) Ki‐67 staining was detected in the sham group. (B) Partial hepatectomy group. (C) pre‐treated with β‐glucan and were analysed by ImageJ (National Institutes of Health). The research was performed with five independent experiments.
Relative gene expression
Results obtained from this experiment performed using liver are presented in Figure 5, which shows the gene expression of the inflammatory genes tumour necrosis factor‐α (TNF‐α) and interleukin‐8 (IL‐8) and that of the growth factor genes insulin‐like growth factor 1 (IGF‐1) and fibroblast growth factor 20α (FGF‐20α) in the β‐glucan/PH group or the PH group. Figure 5A shows the TNF‐α gene expression in the β‐glucan/PH group and the PH group. Tilapia liver TNF‐α gene expression, in the first day of examination point in the β‐glucan/PH group (18·613 ± 3·274) was not significantly different from that in the PH group (15·124 ± 2·520). On the third day of examination point, TNF‐α gene expression in the β‐glucan/PH group (15·948 ± 4·364) was significantly higher (P < 0·05) than that in the PH group (6·213 ± 2·144). On the seventh day of examination point, no significant difference was observed in the β‐glucan/PH group (5·320 ± 1·476) and the PH group (4·056 ± 2·331). On the 10th day also, there was no significant difference in the β‐glucan/PH group (6·020 ± 2·202) and the PH group (5·604 ± 1·339). Tilapia liver IL‐8 gene expression is shown in Figure 6B, which shows that on the first day of examination point, the IL‐8 gene expression in the β‐glucan/PH group (45·133 ± 13·675) was significant different (P < 0·05) from that in the PH group (6·440 ± 1·085). On the third day of examination point, it was significantly higher in the β‐glucan/PH group (44·514 ± 26·810) (P < 0·05) than that in the PH group (2·784 ± 1·135). On the seventh day of examination point, no significant difference was observed between the β‐glucan/PH group (7·189 ± 2·285) and the PH group (5·346 ± 2·899). On the 10th day also, there was no significant difference between the β‐glucan/PH group (8·110 ± 4·783) and the PH group (3·759 ± 2·053). Figure 5C shows the IGF‐1 gene expression in the β‐glucan/PH group and the PH group. On the first day of examination point, no significant differences were observed between the β‐glucan/PH group (1·442 ± 1·210) and the PH group (1·320 ± 0·095). On the third day, the IGF‐1 gene expression was significantly higher in the β‐glucan/PH group (2·630 ± 1·166) (P < 0·05) compared with that in the PH group (0·874 ± 0·178). On the seventh day,there were no significant differences between the β‐glucan/PH group (1·257 ± 0·093) and the PH group (1·053 ± 0·038). Similarly, on the 10th day of examination point, no significant differences were observed between the β‐glucan/PH group (1·053 ± 0·329) and the PH group (1·061 ± 0·410). Figure 5D shows the GF gene expression in the β‐glucan/PH group and the PH group. On the first day, significantly higher GF gene expression was observed in the β‐glucan/PH group (17·878 ± 2·226) (P < 0·05) than that in the PH group (7·090 ± 0·887). On the third day of examination point also, there was a significantly higher GF gene expression in the β‐glucan/PH group (33·364 ± 1·806) (P < 0·05) compared with that in the PH group (3·865 ± 0·678). On the seventh day, no significant difference was observed between in the β‐glucan/PH group (1·802 ± 0·381) and the PH group (1·983 ± 1·073). Similarly, on the tenth day, there was no significant difference in GF gene expression between the β‐glucan/PH group (1·113 ± 0·719)and the PH group (1·337 ± 0·070). The results of FGF‐20α gene expression are shown in Figure 5E. On the first day, the β‐glucan/PH group (58·711 ± 10·006) showed significantly higher (P < 0·05) expression level than that in the PH group (21·083 ± 14·275). On the third day of examination point also, the FGF‐20α gene expression was significantly higher in the β‐glucan/PH group (66·477 ± 11·192) (P < 0·05) than that in the PH group (8·965 ± 0·708). On the seventh day, no significant differences were observed between the β‐glucan/PH group (5·002 ± 1·490) and the PH group (5·872 ± 2·293). On the tenth day again, there was no significant difference between the β‐glucan PH group (16·192 ± 11·250) and the PH group (4·326 ± 4·273).
Figure 5.
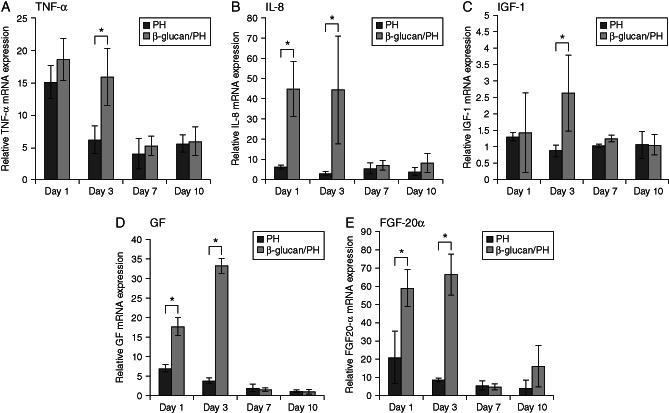
Gene expression. (A) Tumour necrosis factor‐α (TNF‐α) gene expression in tilapia (Oreochomis niloticus) liver. (B) Interleukin‐8 (IL‐8) gene expression. (C) Insulin‐like growth factor 1 (IGF‐1) gene expression. (D) Growth factor gene expression. (E) fibroblast growth factor 20α (FGF‐20α) gene expression. Results are the mean ± SEM of representative values from five independent experiments. Statistical differences are indicated by P values. *P < 0·05; **P < 0·01.
Figure 6.
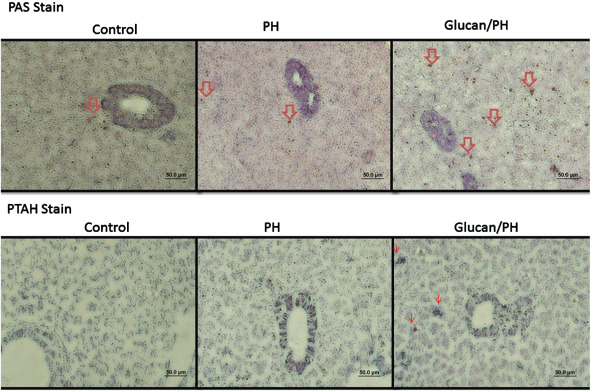
Histological morphological observations of liver repair by PAS and PTAH stain. The red arrows indicate production of collagen, fibre and glycoprotein.
Histopathological observations
Histopathological findings confirmed that a significant progression of wound healing in the PH group with the glucan treatment was observed, as shown in Figure 6. Compared with the PH group that received MBG treatment, a significant finding in collagen synthesis was observed in the group with only PH. The result suggested that MBG treatment effectively improved wound healing by modulating the inflammatory components in the liver PH. β‐catenin in the wound site was significantly activated in the MBG group but not in the control group. Compared with the PH group, the group with MBG pre‐treatment also showed significant activation of β‐catenin (Figure 7).
Figure 7.
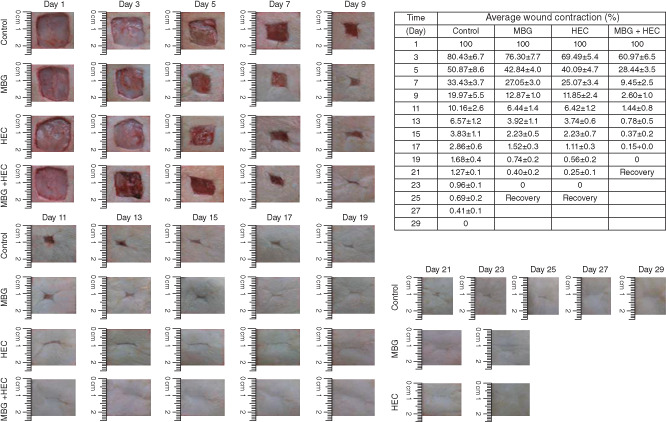
The wound recovery of murine observed on different days.
Murine skin wound recovery and histopathology observation
The wound skin recovery was observed through changes in wound area under different circumstances. The recovery observation of the surgical skin rat is presented in Figure 7. As shown in this figure, the comparison of the control group results with those of the MBG, HEC and MB + HEC groups showed significant differences from day 1 to day 29 after the surgery. It can be seen that from day 1 to day 3, there is a marked recovery of the wounded area in the HEC and HEC + MBG groups but not in the control and MBG groups. In the MBG group, the recovery process was significant from day 5 after the surgery, but in the control group, it was from day 7. Long‐term observation of wound healing process showed that the HEC group and MBG + HEC groups showed complete healing on the day 23 and day 21, respectively, after the surgery, and the MBG group and the control group showed complete healing on day 25 and day 29, respectively. Histopathological observation of HEC group and MBG + HEC group showed fibroblast accumulation in the wound site as well as a significant growth of granulation tissue on day 3, but in the control group, this was is not significant. In the wound centre portion, the epidermal cell proliferation is obvious with a transitional situation in the MBG + HEC group, and the histopathological observation of showed complete wound healing compared with that in the other groups. Histopathological findings also confirmed a significant progression of wound healing in the wounded skin following MBG treatment, as shown in Figure 8. Compared with MBG + HEC treatments, a significant finding in collagen synthesis was observed in the control, MBG and HEC groups. The results suggested that MBG treatment effectively improves wound healing by modulating the inflammatory components in the murine wounded skin model (Figure 8).
Figure 8.
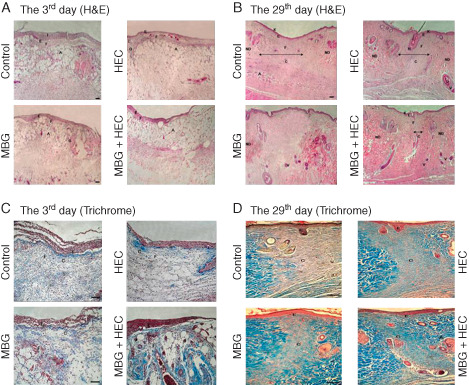
Histological morphological observations of murine wound healing.
Discussion
Recently, evidence from research studies has shown that polysaccharides derived from mushrooms (such as G. lucidum, Phellinus linteus and White button mushroom) displayed immunomodulatory effects on T lymphocytes function and promoted the maturation and function of macrophages and dendritic cells 21, 22, 23. Several studies have shown pharmacological properties attributed to polysaccharides, including enhancement of natural killer cell activity 24, anti‐inflammatory action 25, reduction of septic shock 26 and anti‐tumour effects 27. Regarding inflammation, analysis of cytokine production showed that spleen monocytes were able to trigger lower levels of IFN‐γ and higher production of IL‐4 than those in normal status mice 28, 29. Furthermore, in the inflammation reaction, cytokines can be produced by various resident cells such as bronchial epithelial cells, tissue mast cells and tissue resident macrophages, as well as induced inflammatory cells such as lymphocytes and eosinophils into the inflamed tissue 30, 31. Result have also shown that pretreatment with β‐glucan, changes were associated with acute inflammation such as the marked increases of induced ear weight and effect of β‐glucan on acute inflammation vasodilation, oedematous changes in the skin and infiltration of inflammatory cells, and increases in the thickness of ear tissues were significantly and dose‐dependently decreased 32.
Inflammation is a complicated mechanism of interactions through inflammatory factors and cells that can arise in any tissue in response to the wounded injury. The process normally leads to recovery from infection and to healing 33, 34. During the normal pattern of wound repair, inflammatory cells play a major role in the generation of pro‐inflammatory cytokines such as IL‐1, TNF‐α and IL‐6 involved in the repair; moreover, increased proteolytic activity such as neutrophil elastase, MMP‐8 and gelatinase may lead to reduction of growth factors and structural proteins of the extracellular matrix crucial for repair 35. The endpoint of the inflammatory response is to resolve the damaged or the wounded site. Research has indicated that resolution of the inflammatory response may be regulated by the body so that the injury could be conquered by modulation of the fine balance between survival and death signals 36. Immune cells are involved in virtually every aspect of the wound repair process, from the initial stages where they participate in haemostasis and work to the prevention of infection to later stages where they drive scar formation 37. Evidence supporting a central role for T lymphocytes in the control of wound healing is provided by studies that examined the in vivo effects of alternate forms of T‐cell manipulation on various parameters of healing 38. Neutrophils are also important to wound healing as they help control infection; however, they also release harmful enzymes, which damage the healthy tissues surrounding the wound site 39. Investigations have enumerated many of the specific proteins that are produced by wound macrophages at the site of injury. These include the following: (i) chemoattractants that recruit and activate additional macrophages at the site of injury, (ii) growth factors that promote cellular proliferation and protein synthesis, (iii) proteases and extra‐cellular matrix molecules and (iv) factors that may restrain tissue growth once repair is completed 40. In a previous study, it was illustrated that Wnt proteins are classified according to their ability to promote stabilisation of β‐catenin in the cytoplasm. The β‐catenin‐dependent Wnt pathway signals through cytoplasmic stabilisation and accumulation of β‐catenin in the nucleus to activate gene transcription 41. Moreover, in the chronic wound phenotype also, activation of Wnt/β‐catenin plays a role as the key element in the development of chronic wounds. This would further suggest a particular tissue context and cell specificity of wound repair response to Wnt/β‐catenin stimulation 42. In the present study, β‐catenin signal was obviously induced by the tissue observation through the MBG‐treated tilapia following PH.
In another previous study, the investigators analysed liver fibrogenesis and mastocytosis modulated by liposomized glucan treatment, which was observed using DNA S‐phase markers (BrdU and 3H‐thymidine),and it was shown that the proliferative capacity was associated with several kinds of liver cells 43. Similar findings were also observed in our study with BrdU and MTT assays. We believe that treatment of liver cells with β‐glucan induces the related growth factors to maintain the cell viability and enhance the proliferation of liver cells.
Assessment of tissue wound healing through in vivo or in vitro test, we observed that the MBG from G. lucidum results in exactly with a greater effect on tissue repair through modulation of inflammatory cells to generate the pro‐inflammatory cytokines as IL‐1, TNF‐α, IL‐6 and the growth factors involved in tissue repair, and we consider that the MBG may induce the cellular Wnt/β‐catenin signalling activation in the wound repair process.
Supporting information
Figure S1. Surgery of tilapia partial hepatectomy.
Figure S2. Surgery of murine skin wound healing.
References
- 1. Hwang HJ, Kim SW, Lim JM, Joo JH, Kim HO, Kim HM, Yun JW. Hypoglycemic effect of crude exopolysaccharides produced by a medicinal mushroom Phellinus baumii in streptozotocin‐induced diabetic rats. Life Sci 2005;76:3069–80. DOI: 10.1016/j.lfs.2004.12.019. [DOI] [PubMed] [Google Scholar]
- 2. Woo YI, Park BJ, Kim HL, Lee MH, Kim J, Yang YI, Kim JK, Tsubaki K, Han DW, Park JC. The biological activities of (1,3)‐(1,6)‐beta‐D‐glucan and porous electrospun PLGA membranes containing beta‐glucan in human dermal fibroblasts and adipose tissue‐derived stem cells. Biomed Mater 2010;5:044109. DOI: 10.1088/1748-6041/5/4/044109. [DOI] [PubMed] [Google Scholar]
- 3. Wasser SP. Medicinal mushrooms as a source of antitumor and immunomodulating polysaccharides. Appl Microbiol Biotechnol 2002;60:258–74. DOI: 10.1007/s00253-002-1076-7. [DOI] [PubMed] [Google Scholar]
- 4. Przybylska‐Diaz DA, Schmidt JG, Vera‐Jimenez NI, Steinhagen D, Nielsen ME. Beta‐glucan enriched bath directly stimulates the wound healing process in common carp (Cyprinus carpio L.). Fish Shellfish Immunol 2013;35:998–1006. DOI: 10.1016/j.fsi.2013.05.014. [DOI] [PubMed] [Google Scholar]
- 5. Delatte SJ, Evans J, Hebra A, Adamson W, Othersen HB, Tagge EP. Effectiveness of beta‐glucan collagen for treatment of partial‐thickness burns in children. J Pediatr Surg 2001;36:113–8. DOI: 10.1053/jpsu.2001.20024. [DOI] [PubMed] [Google Scholar]
- 6. Portera CA, Love EJ, Memore L, Zhang L, Muller A, Browder W, Williams DL. Effect of macrophage stimulation on collagen biosynthesis in the healing wound. Am Surg 1997;63:125–31. [PubMed] [Google Scholar]
- 7. Wu YS, Chen SN. Apoptotic cell: linkage of inflammation and wound healing. Front Pharmacol 2014;5:1. DOI: 10.3389/fphar.2014.00001. [DOI] [PMC free article] [PubMed] [Google Scholar]
- 8. Chang CS, Huang SL, Chen S, Chen SN. Innate immune responses and efficacy of using mushroom beta‐glucan mixture (MBG) on orange‐spotted grouper, epinephelus coioides, aquaculture. Fish Shellfish Immunol 2013;35:115–25. DOI: 10.1016/j.fsi.2013.04.004. [DOI] [PubMed] [Google Scholar]
- 9. Czaja W, Krystynowicz A, Bielecki S, Brown RM Jr. Microbial cellulose – the natural power to heal wounds. Biomaterials 2006;27:145–51. DOI: 10.1016/j.biomaterials.2005.07.035. [DOI] [PubMed] [Google Scholar]
- 10. Tzianabos AO. Polysaccharide immunomodulators as therapeutic agents: structural aspects and biologic function. Clin Microbiol Rev 2000;13:523–33. DOI: 10.1128/Cmr.13.4.523-533.2000. [DOI] [PMC free article] [PubMed] [Google Scholar]
- 11. Chen SN, Nan FH, Chen S, Wu JF, Lu CL, Soni MG. Safety assessment of mushroom beta‐glucan: subchronic toxicity in rodents and mutagenicity studies. Food Chem Toxicol 2011;49:2890–8. DOI: 10.1016/j.fct.2011.08.007. [DOI] [PubMed] [Google Scholar]
- 12. Ciucanu I, Kerek F. A simple and rapid method for the permethylation of carbohydrates. Carbohydr Res 1984;131:209–17. [Google Scholar]
- 13. York WS, Darvill AG, Mcneil M, Stevenson TT, Albersheim P. Isolation and characterization of plant‐cell walls and cell‐wall components. Methods Enzymol 1986;118:3–40. [Google Scholar]
- 14. Chen JY, Lin WJ, Lin TL. A fish antimicrobial peptide, tilapia hepcidin TH2‐3, shows potent antitumor activity against human fibrosarcoma cells. Peptides 2009;30:1636–42. DOI: 10.1016/j.peptides.2009.06.009. [DOI] [PubMed] [Google Scholar]
- 15. Kim SK, Kim YT, Byun HG, Nam KS, Joo DS, Shahidi F. Isolation and characterization of antioxidative peptides from gelatin hydrolysate of Alaska pollack skin. J Agric Food Chem 2001;49:1984–9. DOI: 10.1021/Jf000494j. [DOI] [PubMed] [Google Scholar]
- 16. Li HY, Zhang SC. In vitro cytotoxicity of the organophosphorus pesticide parathion to FG‐9307 cells. Toxicol In Vitro 2001;15:643–7. DOI: 10.1016/S0887-2333(01)00090-X. [DOI] [PubMed] [Google Scholar]
- 17. Lee H, Goetzl EJ, An SZ. Lysophosphatidic acid and sphingosine 1‐phosphate stimulate endothelial cell wound healing. Am J Physiol Cell Physiol 2000;278:C612–8. [DOI] [PubMed] [Google Scholar]
- 18. Yadav S, Puri S, Linstedt AD. A primary role for Golgi positioning in directed secretion, cell polarity, and wound healing. Mol Biol Cell 2009;20:1728–36. DOI: 10.1091/mbc.E08-10-1077. [DOI] [PMC free article] [PubMed] [Google Scholar]
- 19. Gál P, Kilík R, Mokrý M, Vidinský B, Vasilenko T, Mozeš S, Bobrov N, Tomori Z, Bober J, Lenhardt L. Simple method of open skin wound healing model in corticosteroid‐treated and diabetic rats: standardization of semi‐quantitative and quantitative histological assessments. Vet Med 2008;53:652–9. [Google Scholar]
- 20. Yang CS, Chen C‐Y, Chiang C‐H, Tung C‐L, Chen M‐Y, Yeh C‐H, Su F‐C, Yeh M‐L. The effect of suture size on skin wound healing strength in rats. J Med Biol Eng 2011;31:339–43. DOI: 10.5405/Jmbe.726. [DOI] [Google Scholar]
- 21. Chan WK, Law HKW, Lin ZB, Lau YL, Chan GCF. Response of human dendritic cells to different immunomodulatory polysaccharides derived from mushroom and barley. Int Immunol 2007;19:891–9. DOI: 10.1093/intimm/dxm061. [DOI] [PubMed] [Google Scholar]
- 22. Park SK, Kim GY, Lim JY, Kwak JY, Bae YS, Lee JD, Oh YH, Ahn SC, Park YM. Acidic polysaccharides isolated from Phellinus linteus induce phenotypic and functional maturation of murine dendritic cells. Biochem Biophys Res Commun 2003;312:449–58. DOI: 10.1016/j.bbrc.2003.10.136. [DOI] [PubMed] [Google Scholar]
- 23. Ren ZH, Guo ZY, Meydani SN, Wu DY. White button mushroom enhances maturation of bone marrow‐derived dendritic cells and their antigen presenting function in mice. J Nutr 2008;138:544–50. [DOI] [PubMed] [Google Scholar]
- 24. Wu DY, Pae MK, Ren ZH, Guo ZY, Smith D, Meydani SN. Dietary supplementation with white button mushroom enhances natural killer cell activity in C57BL/6 mice. J Nutr 2007;137:1472–7. [DOI] [PubMed] [Google Scholar]
- 25. Park YM, Won JH, Kim YH, Choi JW, Park HJ, Lee KT. In vivo and in vitro anti‐inflammatory and anti‐nociceptive effects of the methanol extract of Inonotus obliquus . J Ethnopharmacol 2005;101:120–8. DOI: 10.1016/j.jep.2005.04.003. [DOI] [PubMed] [Google Scholar]
- 26. Kim GY, Roh SI, Park SK, Ahn SC, Oh YH, Lee JD, Park YM. Alleviation of experimental septic shock in mice by acidic polysaccharide isolated from the medicinal mushroom Phellinus linteus . Biol Pharm Bull 2003;26:1418–23. DOI: 10.1248/Bpb.26.1418. [DOI] [PubMed] [Google Scholar]
- 27. Leung MYK, Fung KP, Choy YM. The isolation and characterization of an immunomodulatory and anti‐tumor polysaccharide preparation from Flammulina velutipes. Immunopharmacology 1997;35:255–63. DOI: 10.1016/S0162-3109(96)00157-9. [DOI] [PubMed] [Google Scholar]
- 28. Bentley AM, Hamid Q, Robinson DS, Schotman E, Meng Q, Assoufi B, Kay AB, Durham SR. Prednisolone treatment in asthma – Reduction in the numbers of eosinophils, T cells, tryptase‐only positive mast cells, and modulation of IL‐4, IL‐5, and interferon‐gamma cytokine gene expression within the bronchial mucosa. Am J Respir Crit Care Med 1996;153:551–6. [DOI] [PubMed] [Google Scholar]
- 29. Smythies LE, Waites KB, Lindsey JR, Harris PR, Ghiara P, Smith PD. Helicobacter pylori‐induced mucosal inflammation is Th1 mediated and exacerbated in IL‐4, but not IFN‐gamma, gene‐deficient mice. J Immunol 2000;165:1022–9. [DOI] [PubMed] [Google Scholar]
- 30. Durham SR, Ying S, Varney VA, Jacobson MR, Sudderick RM, Mackay IS, Kay AB, Hamid QA. Cytokine messenger‐RNA expression for Il‐3, Il‐4, Il‐5, and granulocyte/macrophage‐colony‐stimulating factor in the nasal‐mucosa after local allergen provocation – relationship to tissue eosinophilia. J Immunol 1992;148:2390–4. [PubMed] [Google Scholar]
- 31. Mosser DM. The many faces of macrophage activation. J Leukoc Biol 2003;73:209–12. DOI: 10.1189/Jlb.0602325. [DOI] [PubMed] [Google Scholar]
- 32. Kim HD, Cho HR, Moon SB, Shin HD, Yang KJ, Park BR, Jang HJ, Kim LS, Lee HS, Ku SK. Effects of beta‐glucan from Aureobasidium pullulans on acute inflammation in mice. Arch Pharm Res 2007;30:323–8. DOI: 10.1007/Bf02977613. [DOI] [PubMed] [Google Scholar]
- 33. Nathan C. Points of control in inflammation. Nature 2002;420:846–52. DOI: 10.1038/Nature01320. [DOI] [PubMed] [Google Scholar]
- 34. Sugimoto N, Rui T, Yang M, Bharwani S, Handa O, Yoshida N, Yoshikawa T, Kvietys PR. Points of control exerted along the macrophage‐endothelial cell‐polymorphonuclear neutrophil axis by PECAM‐1 in the innate immune response of acute colonic inflammation. J Immunol 2008;181:2145–54. [DOI] [PubMed] [Google Scholar]
- 35. Eming SA, Krieg T, Davidson JM. Inflammation in wound repair: molecular and cellular mechanisms. J Invest Dermatol 2007;127:514–25. DOI: 10.1038/sj.jid.5700701. [DOI] [PubMed] [Google Scholar]
- 36. Martin P, Leibovich SJ. Inflammatory cells during wound, repair: the good, the bad and the ugly. Trends Cell Biol 2005;15:599–607. DOI: 10.1016/j.tcb.2005.09.002. [DOI] [PubMed] [Google Scholar]
- 37. Wilgus TA. Immune cells in the healing skin wound: influential players at each stage of repair. Pharmacol Res 2008;58:112–6. DOI: 10.1016/j.phrs.2008.07.009. [DOI] [PubMed] [Google Scholar]
- 38. Barbul A, Regan MC. The regulatory role of lymphocytes‐T in wound‐healing. J Trauma Injury Infect Crit Care 1990;30:S97–S100. [DOI] [PubMed] [Google Scholar]
- 39. Brubaker AL, Schneider DF, Kovacs EJ. Neutrophils and natural killer T cells as negative regulators of wound healing. Expert Rev Dermatol 2011;6:5–8. DOI: 10.1586/edm.10.66. [DOI] [PMC free article] [PubMed] [Google Scholar]
- 40. DiPietro LA. Wound healing: the role of the macrophage and other immune cells. Shock 1995;4:233–40. [PubMed] [Google Scholar]
- 41. Fathke C, Wilson L, Shah K, Kim B, Hocking A, Moon R, Isik F. Wnt signaling induces epithelial differentiation during cutaneous wound healing. BMC Cell Biol 2006;7:4. DOI: 10.1186/1471-2121-7-4. [DOI] [PMC free article] [PubMed] [Google Scholar]
- 42. Stojadinovic O, Brem H, Vouthounis C, Lee B, Fallon J, Stallcup M, Merchant A, Galiano RD, Tomic‐Canic M. Molecular pathogenesis of chronic wounds: the role of beta‐catenin and c‐myc in the inhibition of epithelialization and wound healing. Am J Pathol 2005;167:59–69. [DOI] [PMC free article] [PubMed] [Google Scholar]
- 43. Hrckova G, Velebny S, Daxnerova Z, Solar P. Praziquantel and liposomized glucan‐treatment modulated liver fibrogenesis and mastocytosis in mice infected with Mesocestoides vogae (M. corti, Cestoda) tetrathyridia. Parasitology 2006;132:581–94. DOI: 10.1017/S0031182005009364. [DOI] [PubMed] [Google Scholar]
Associated Data
This section collects any data citations, data availability statements, or supplementary materials included in this article.
Supplementary Materials
Figure S1. Surgery of tilapia partial hepatectomy.
Figure S2. Surgery of murine skin wound healing.


