Abstract
The human hypertrophic scar undergoes hyperplasia and regression during progression. This study aimed to investigate whether fibroblasts in scar tissue undergo biological changes during the formation and regression of human hypertrophic scar. Using 32 scar samples, we measured collagen production by Masson's staining and the expression levels of transforming growth factor (TGF)‐β1 and vascular endothelial growth factor (VEGF) by immunohistochemistry. In addition, fibroblasts from scar tissue were isolated and cultured, and total RNA was extracted for measurement of TGF‐β1, VEGF and collagen transcript levels by reverse transcription‐polymerase chain reaction (RT‐PCR). Masson's staining showed that the number of fibroblasts and microvessels increased gradually in early and proliferative scars but decreased in regressive scars. Immunohistochemistry revealed that the expression of TGF‐β1 and VEGF increased in early scars, peaked in proliferative scars and decreased in regressive scars. Moreover, the expression of TGF‐β1, VEGF, collagen I and collagen III mRNAs also increased in early and proliferative scars and decreased significantly in regressive scars. Dynamic changes in fibroblast biology correlated with the formation and progression of hypertrophic scar.
Keywords: Collagen, Fibroblast, Hypertrophic scar, TGF‐β1, VEGF
Introduction
Hypertrophic scarring occurs as a result of burn, trauma or surgery and is accompanied by erythema, elevation, itching and pain. Generally, hypertrophic scarring develops 6–8 weeks after wound healing. After a period of time ranging from months to years of hyperplasia, the scar ceases to grow and regresses spontaneously, and the accompanying erythema, elevation, itching and pain also subside. Previous studies have shown that higher level of growth factors and collagen production secreted by the scar fibroblasts play key roles in the formation of hypertrophic scar 1, 2, 3. However, it is not reported, during the formation and regression of scar , whether the fibroblast biology is stable at a same level or undergoes dynamic change with the changes in scar.
Therefore, in this study, we classified the scar stages as early, proliferative, regressive and mature and sought to investigate the relationship between fibroblast biology and tissue pathology at different stages of scarring. To this end, we examined collagen production and the expression of transforming growth factor (TGF)‐β1 and vascular endothelial growth factor (VEGF) protein in 32 scar samples. In addition, scar fibroblasts were isolated, cultured and used to detect the mRNA expression of TGF‐β1, VEGF and collagen. The results revealed that expression levels of collagen, TGF‐β1 and VEGF increased in early scars, peaked in proliferative scars and decreased in regressive scars, reaching normal levels in mature scars.
Materials and methods
Study design and patients
Hypertrophic scars were classified as early, proliferative, regressive or mature scars in terms of clinical appearance and duration. Early scars were defined as erythematous and pruritic tissue with slight elevation after 1–2 months of wound healing. Proliferative scars were characterised by deep redness and increased thickening, pruritus and pain after 3–6 months of wound healing. Regressive scars were defined as slightly reddish tissue with reduced thickening, pruritus and pain after nearly 2 years. Finally, mature scars were defined as flattened tissue with nearly normal skin appearance at about four or more years of wound healing. This study was approved by the ethics committee of Shanghai Second Medical College (now named Shanghai JiaoTong University Medical School) and performed at the Burn Center of Ruijin Hospital (affiliated to this medical school). Thirty‐two patients were enrolled after providing informed consent; for each scar stage, there were eight patients, and all the scars were located on either arms or legs.
Masson's trichrome staining
A portion of each tissue sample was fixed in 4% paraformaldehyde in phosphate‐buffered saline (PBS) for 2 hours, kept in 10% formalin for approximately 16 hours and embedded in paraffin. Serial 5‐µm cross sections were prepared from paraffin blocks. The sections were deparaffinised and rehydrated. After washing, they were stained sequentially in Weigert's iron haematoxylin working solution (10 minutes) and Biebrich scarlet‐acid fuchsin solution (15 minutes), with rinsing between the two stains and thereafter. The sections were then differentiated in phosphomolybdic‐phosphotungstic acid solution for 15 minutes and transferred directly to aniline blue solution for 5–10 minutes. The sections were briefly rinsed and differentiated in 1% acetic acid solution for 2–5 minutes. Finally, the sections were dehydrated and photographed using a Zeiss KS400 image analysis system (Carl Zeiss, Oberkochen, Germany). The staining of collagen fibres (connective tissues) was blue, nuclei were dark red/purple and the cytoplasm was red/pink.
Immunohistochemistry for TGF‐β1 and VEGF expression
Vectastain elite ABC kits (Maixin Bio, Fuzhou, China) were used for immunohistochemistry according to the manufacturer's instructions. The sections were quenched with 0·03% H2O2 and blocked with serum‐blocking reagent for 10 minutes each at room temperature (RT). The sections were then incubated with primary mouse anti‐human TGF‐β1 or VEGF antibodies (1:100 dilution; Santa Cruz Biotechnology Inc, Santa Cruz, CA) for 1 hour at 37°C. The sections were washed with PBS and incubated with rabbit anti‐mouse secondary antibodies (1:100 dilution; Santa Cruz Biotechnology Inc) for 30 minutes at RT, washed, incubated with a streptavidin–horseradish peroxidase (HRP) conjugate for 30 minutes at RT and developed with diaminobenzidine (DAB) peroxidase substrate solution. The sections were then examined and photographed using a Zeiss KS400 image analysis system. The experiment was repeated three times, and the values of TGF‐β1 and VEGF expression were obtained by calculation of the square percentage of positive cells.
Fibroblast isolation from scar tissue and normal skin
Excised tissues were immediately placed in Dulbecco's modified Eagle's medium (D‐MEM) containing 100 U/ml penicillin and 100 µg/ml streptomycin (Life Technologies Corp., Rockville, MD) and transported to the laboratory for prompt processing. The tissues were washed with PBS three times and the epidermis and the remaining fatty tissues were removed using a scalpel. The scar tissue was cut into 1‐mm3 pieces. Then, the tissue pieces were placed into a 25‐cm2 culture flask with D‐MEM and 10% foetal calf serum (FCS), followed by incubation at 37°C in a 5% CO2 incubator. One week later, the fibroblasts migrated out of the tissue. After another 2 weeks, the fibroblasts reached confluence and were passaged. Only cells from passage number 2 were used for subsequent experiments.
Reverse transcription polymerase chain reaction for measurement of TGF‐β1, VEGF, collagen I and collagen III expression in scar fibroblasts
Total RNA was extracted from fibroblasts using TRIzol reagent (GibcoBRL, Grand Island, NY). Reverse transcription polymerase chain reaction (RT‐PCR) was performed using reagents from Promega (Fitchburg, WI) according to the manufacturer's instructions. Briefly, 2 µg RNA was reverse transcribed using anti‐sense primers. The PCR cycles consisted of 94°C for 30 seconds, melting temperature (T M, specific for each primer set) for 30 seconds and 72°C for 30 seconds for 30 cycles. Glyceraldehyde 3‐phosphate dehydrogenase (GAPDH) was used as an internal control, with PCR protocol of 94°C for 30 seconds, 58°C for 30 seconds and 72°C for 30 seconds for 30 cycles (Table 1). The amplified products were analysed on 3% agarose gels and visualised by ethidium bromide staining. Statistical analysis was performed using the expression ratio of the PCR product/GAPDH. All experiments were repeated three times.
Table 1.
RT‐PCR primers for TGF‐β1, VEGF, collagen I and collagen III
| mRNA | Primer | TM | PCR cycle | Product size (bp) |
|---|---|---|---|---|
| TGF‐β1 | 5′‐CAAGCAGAGTACAC ACAGCA‐3′ | 54°C | 30 | 422 |
| 5′‐GATGCTGGGGCCCCTC TCCAGC‐3′ | ||||
| VEGF | 5′‐ATGGCAGCCGGGAGC ATCACC‐3′ | 62·9°C | 35 | 250 |
| 5′‐CACACACTCCTTTGATA GACACAA‐3′ | ||||
| Collagen I | 5′‐CTGCAAGAACAGCATT GCAT‐3′ | 60·1°C | 30 | 390 |
| 5′‐GGCGTGATGGCTTA TTTGTT‐3′ | ||||
| Collagen III | 5′‐GACCCTAACCAA GGATGCAA‐3′ | 55·2°C | 30 | 461 |
| 5′‐GGAAATTCAGGATTG CCGTA‐3′ | ||||
| GAPDH | 5′‐CCATGGAGAAGGC TGGGG‐3′ | 58°C | 30 | 196 |
| 5′‐CAAAGTTGTCATGGAT GACC‐3′ |
RT‐PCR, reverse transcription polymerase chain reaction; TGF, transforming growth factor; VEGF, vascular endothelial growth factor; GAPDH, glyceraldehyde 3‐phosphate dehydrogenase.
Statistical analysis
Data are expressed as the mean ± SD and were analysed by Student's t‐tests. Differences with P‐values < 0·05 were considered significant.
Results
Masson's trichrome staining for scar tissue
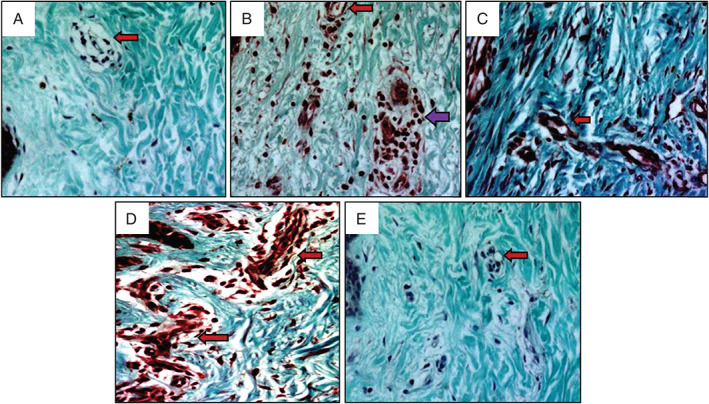
Masson's trichrome staining (Figure 1) revealed a small number of fibroblasts and microvessels in normal skin. The collagen arrangement was loose and microvessel lumens were open. In early scars, an increased number of fibroblasts and microvessels were observed. However, collagen density was lower than that of normal skin, and some inflammatory cells could be seen in the scar tissue. In proliferative scars, there were a number of microvessels and fibroblasts in the tissue, and a large amount of collagen was deposited around the microvessels. In regressive scars, the microvessels were partially or totally occluded with thin and narrow lumens, and the cells and collagen density were also decreased. In mature scars, there were a small number of microvessels and fibroblasts, and the collagen density was also reduced.
Figure 1.

Masson's trichrome staining of human hypertrophic scars at different stages. Collagen deposition, fibroblasts and microvessels in normal skin (A), early scars (B), proliferative scars (C), regressive scars (D) and mature scar (E) are shown. Arrows indicate microvessels (red arrows indicate microvessels, violet arrow indicates inflammatory cells). Original magnification, 400×.
Immunohistochemistry for TGF‐β1 and VEGF expression in scar tissue
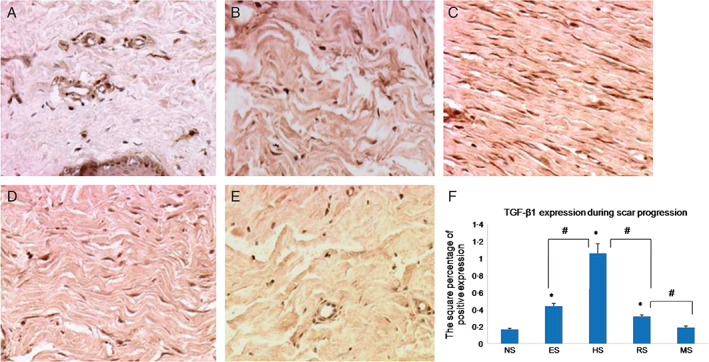
TGF‐β1 immunohistochemistry revealed that all positive staining was found in fibroblasts. TGF‐β1 expression in normal skin was lower than that in early scars (0·17 ± 0·01 versus 0·44 ± 0·03, respectively, P < 0·05), peaked in proliferative scars (1·06 ± 0·11, P < 0·05) and decreased significantly in regressive scars (0·32 ± 0·02, P < 0·05). In mature scars, TGF‐β1 expression returned to almost normal levels (0·19 ± 0·02, P > 0·05; Figure 2). Meanwhile, there was also a significant difference in each particular scar stage when compared to the previous one; for example, expression in proliferative scars was significantly different from that in regressive scars (Figure 2F). These results showed that with scar development, TGF‐β1 expression increased gradually, peaked in proliferative scars and decreased in regressive and mature scars.
Figure 2.

Immunohistochemical staining with transforming growth factor (TGF)‐β1 antibodies in normal skin (A), early scars (B), proliferative scars (C), regressive scars (D) and mature scars (E). Positive cells are indicated in brown colour. (F) The quantification of the microvessel density at each scar stage (n = 8; original magnification, 200×). * indicates a significant difference compared to the normal control (P< 0·05); # indicates a significant difference compared to the former stage (P< 0·05). (NS, ES, HS, RS and MS represent normal skin, early scars, proliferative scars, regressive scars and mature scars, respectively).
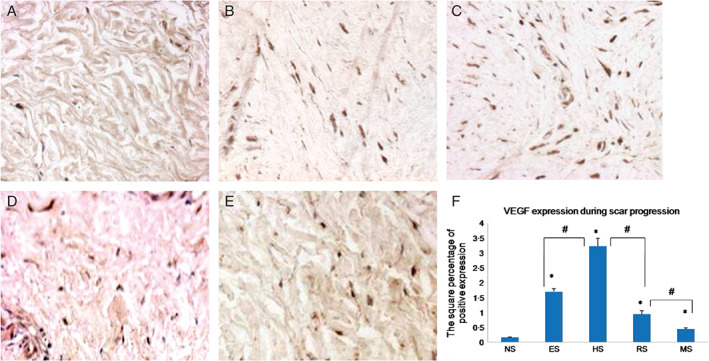
VEGF immunohistochemistry demonstrated that most of the positive staining was found in fibroblasts, with a small amount in the microvessels. There was very low VEGF expression in normal skin (0·16 ± 0·01), and VEGF levels increased significantly in early scars (1·70 ± 0·09, P < 0·05), peaked in proliferative scars (3·22 ± 0·27, P < 0·05) and decreased in regressive scars (0·94 ± 0·11, P < 0·05). In mature scar, VEGF was still expressed at slightly higher level than in normal skin (0·45 ± 0·03, P < 0·05; Figure 3A–D). In addition, there was also a significant difference in each particular scar stage when compared to the previous one (Figure 3F). These results showed that with scar development, VEGF expression increased gradually, peaked in proliferative scars and decreased gradually in regressive and mature scars.
Figure 3.

Immunohistochemical staining with vascular endothelial growth factor (VEGF) antibodies for normal skin (A), early scars (B), proliferative scars (C), regressive scars (D) and mature scars (E). Positive cells are indicated in brown colour. (F) The quantification of the microvessel density at each scar stage (n = 8; original magnification, 400×). * indicates a significant difference compared to the normal control (P< 0·05); # indicates a significant difference compared to the former stage (P< 0·05). (NS, ES, HS, RS and MS represent normal skin, early scars, proliferative scars, regressive scars and mature scars, respectively).
Expression of TGF‐β1, VEGF, collagen I and collagen III mRNAs
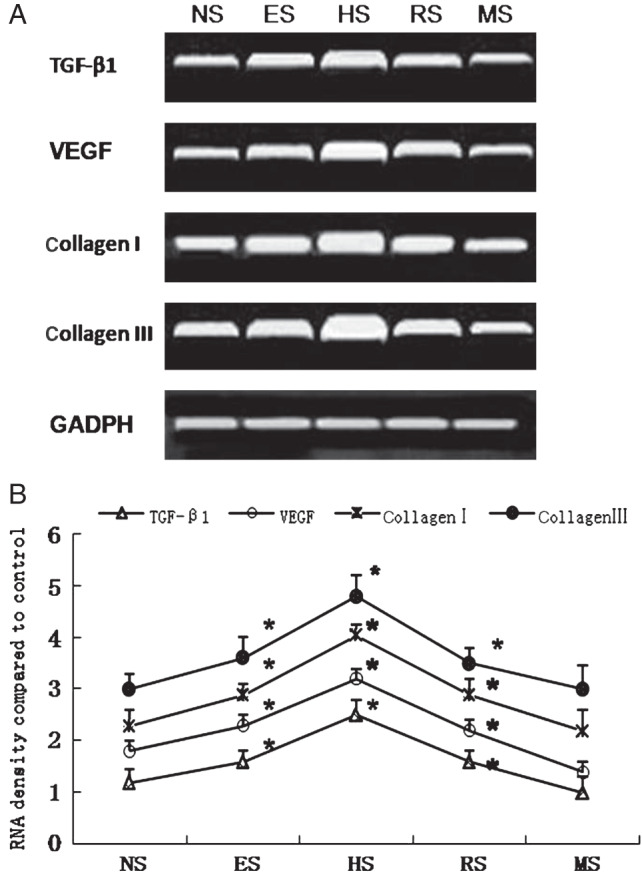
Fibroblasts from various scarring stages were cultured and analysed for the expression of TGF‐β1, VEGF, collagen I and collagen III mRNAs using RT‐PCR with normal skin fibroblasts as a control. The results revealed that all the four mRNAs were expressed in both normal and scar cell lines. In normal fibroblasts, there was lower expression of TGF‐β1, VEGF, collagen I and collagen III; these transcripts were increased significantly in early scars (P < 0·05), peaked in proliferative scars (P < 0·05) and decreased significantly in regressed scars (P < 0·05). The lowest expression was observed in mature scars, in which expression levels were not significantly different from those of the normal control (Figure 4A and B).
Figure 4.

(A) Expression of transforming growth factor‐β1 (TGF‐β1), vascular endothelial growth factor (VEGF), collagen I and collagen III mRNAs, as revealed by agarose gel electrophoresis of reverse transcription polymerase chain reaction (RT‐PCR) products. (B) Densitometric analysis of mRNA expression. The expression of TGF‐β1, VEGF, collagen I and collagen III increased in early scars, peaked in proliferative scars and decreased in regressive and mature scars (n = 5). * indicates P<0·05. (NS, ES, HS, RS and MS represent normal skin, early scars, proliferative scars, regressive scars and mature scars, respectively).
Discussion
Much research has revealed that fibroblast secreted higher level of growth factors and collagen in hypertrophic scar. However, we found that at different scarring stages, fibroblast biology changed dynamically, and this likely connected with formation and regression of scar.
In early scars, fibroblasts synthesised and produced much more TGF‐β1, VEGF, collagen I and collagen III to promote microvessel formation and collagen deposition and resulting in tissue hyperplasia. In our study, there were 2·6‐fold and 10‐fold TGF‐β1 and VEGF expression, respectively, in tissue and 1·2‐fold and 1·2‐fold in collagen I and III RNA expression. Moreover, as hyperplastic scar consumes more oxygen than normal skin, a slightly hypoxic environment is created 4, which further promotes microvessel formation in order to satisfy tissue requirements 5, 6, 7.
In addition, inflammation persists in early scar tissue, which was defined as lymphocyte and macrophage 8. Usually, acute inflammation is necessary for normal wound repair; however, chronic inflammation can lead to pathological fibrosis 9, which causes the release of several inflammation factors, including histamine, bradykinin and substance P, which strongly stimulate fibroblast activation and enhance its biological function 10. This phenomenon may also explain why scars often cause itching and pain in patients. Therefore, fibroblast activation, which leads to hypertrophic scarring, enters a proliferative stage characterised by the highest TGF‐β1, VEGF and collagen expression, in which the expression of TGF‐β1 and VEGF was 6‐fold and 20‐fold in tissue and 1·7‐fold and 1·6‐fold in collagen I and III RNA expression compared to normal level. All these highest expressions were correlated with highest elevation and hardness of the hypertrophic scar. The research on keloid fibroblasts also revealed that the expression of TGF‐β1 and VEGF and collagen I mRNA was up‐regulated 3·6‐fold and 6‐fold and 3‐fold, respectively, compared with normal fibroblasts 11. This evidence demonstrated that hypertrophic scar almost had the same characteristic as keloid formation.
When the scar enters to regressive stage, TGF‐β1 and VEGF and collagen expression decrease in tissue and RNA expression. At the mature stage, the expression of TGF‐β1, VEGF and collagen in fibroblast was almost equivalent to normal level. These results showed that proliferation and regression of the hypertrophic scar were closely correlated with fibroblast biology.
However, why the hyperactivity of fibroblast biology regresses in regressive scar? Authors assumed that in proliferative scar, excess collagen deposition around the microvasculature causes mechanical squeezing in the microvessels, leading to constriction and deformation 12, 13. Therefore, most microvessels were occluded in regressive scar tissue, which was also observed in Masson's staining. Consequently, severe microvessel occlusion resulted in severe hypoxia and malnutrition in scar tissue. Berry measured TcpO2 in hypertrophic scars in 16 patients before pressure therapy and found tissue oxygen of lowest level nearly 2 mmHg 14, which contrasts to 76 mmHg in normal level 15. Severe hypoxia and malnutrition act as a damaging stimulus, greatly increasing p53 expression and inducing cell cycle arrest and apoptosis 16, 17, 18. Fu et al. (2011) cultured stem cells in vitro under 2% O2 and serum‐deprived conditions to mimic ischaemic in vivo cartilage conditions 19. The results demonstrated that these ischaemic, malnourished conditions promoted stem cell apoptosis, and the extent of apoptosis was greater in serum deprivation alone than hypoxia alone 19. Thus, the severe hypoxia and malnutrition caused by microvessel occlusion likely play a role to induce down‐regulation of fibroblast biology in the regressive scar. Of course, more evidence should be provided in future for our consumption.
In conclusion, our study demonstrated that the expression levels of TGF‐β1, VEGF, collagen I and collagen III changed dynamically in fibroblasts, which were closely correlated with pathological change in the formation and regression of human hypertrophic scar.
Acknowledgements
This work was supported by grants from the National Natural Science Foundation of China (No. 30872686). The authors declare no conflict of interest.
References
- 1. Köse O, Waseem A. Keloids and hypertrophic scars: are they two different sides of the same coin? Dermatol Surg 2008;34:336–46. [DOI] [PubMed] [Google Scholar]
- 2. Zhang K, Garner W, Cohen L, Rodriguez J, Phan S. Increased types I and III collagen and transforming growth factor‐beta 1 mRNA and protein in hypertrophic burn scar. J Invest Dermatol 1995;104:750–4. [DOI] [PubMed] [Google Scholar]
- 3. Younai S, Nichter LS, Wellisz T, Reinisch J, Nimni ME, Tuan TL. Modulation of collagen synthesis by transforming growth factor‐beta in keloid and hypertrophic scar fibroblasts. Ann Plast Surg 1994;33:148–51. [DOI] [PubMed] [Google Scholar]
- 4. Kischer CW, Shetlar MR. Microvasculature in hypertrophic scars and the effects of pressure. J Trauma 1979;19:757–64. [DOI] [PubMed] [Google Scholar]
- 5. Forsythe JA, Jiang BH, Iyer NV, Agani F, Leung SW, Koos RD, Semenza GL. Activation of vascular endothelial growth factor gene transcription by hypoxia‐inducible factor 1. Mol Cell Biol 1996;16:4604–13. [DOI] [PMC free article] [PubMed] [Google Scholar]
- 6. Takanashi M, Miyauchi T, Kakinuma Y, Goto K, Yamaguchi I. Establishment of hypoxia inducible factor‐1alpha overexpressing cells that produce endothelin‐1. J Cardiovasc Pharmacol 2004;44:S268–S73. [DOI] [PubMed] [Google Scholar]
- 7. Baan C, van Gelder T, Peeters A, Mol W, Niesters H, Weimar W, IJzermans J. Living kidney donors and hypoxia‐inducible factor‐1alpha. Transplantation 2003;75:570. [DOI] [PubMed] [Google Scholar]
- 8. Liu XJ, Xu MJ, Fan ST, Wu Z, Li J, Yang XM, Wang YH, Xu J, Zhang ZG. Xiamenmycin attenuates hypertrophic scars by suppressing local inflammation and the effects of mechanical stress. J Invest Dermatol 2013;133:1351–60. [DOI] [PubMed] [Google Scholar]
- 9. Constantin CC, Marcia S. Phenotypic differences between dermal fibroblasts from different body sites determine their responses to tension and TGFβ1. BMC Dermatol 2002;2:13. [DOI] [PMC free article] [PubMed] [Google Scholar]
- 10. Akaishi S, Ogawa R, Hyakusoku H. Keloid and hypertrophic scar: neurogenic inflammation hypotheses. Med Hypotheses 2008;71:32–8. [DOI] [PubMed] [Google Scholar]
- 11. Fujiwara M, Muragaki Y, Ooshima A. Keloid‐derived fibroblasts show increased secretion of factors involved in collagen turnover and depend on matrix metalloproteinase for migration. Br J Dermatol 2005;153:295–300. [DOI] [PubMed] [Google Scholar]
- 12. Xi-Qiao W, Ying-Kai L, Chun Q, Shu-Liang L. Hyperactivity of fibroblasts and functional regression of endothelial cells contribute to microvessel occlusion in hypertrophic scarring. Microvasc Res 2009;77:204–11. [DOI] [PubMed] [Google Scholar]
- 13. CW K, Brody GS. Structure of collagen nodule from hypertrophic scars and keloids. Scan Electron Microsc 1981;(pt 3):371–6. [PubMed] [Google Scholar]
- 14. Berry RB, Tan OT, Cooke ED, Gaylarde PM, Bowcock SA, Lamberty BG, Hackett ME. Transcutaneous pressure of oxygen as an index of maturity in hypertrophic scars treated by compression. Br J Plast Surg 1985;38:163–73. [DOI] [PubMed] [Google Scholar]
- 15. Rodrigues LM, Pinto PC, Leal A. Transcutaneous flow related variables measured in vivo: the effects of gender. BMC Dermatol 2001;1:4. [DOI] [PMC free article] [PubMed] [Google Scholar]
- 16. Koumenis C, Alarcon R, Hammond E, Sutphin P, Hoffman W, Murphy M, Derr J, Taya Y, Lowe SW, Kastan M, Giaccia A. Regulation of p53 by hypoxia: dissociation of protein accumulation transcriptional repression and apoptosis from p53‐dependent transactivation. Mol Cell Biol 2001;21:1297–310. [DOI] [PMC free article] [PubMed] [Google Scholar]
- 17. Hammond EM, Denko NC, Dorie MJ, Abraham RT, Giaccia AJ. Hypoxia links ATR and p53 through replication arrest. Mol Cell Biol 2002;22:1834–43. [DOI] [PMC free article] [PubMed] [Google Scholar]
- 18. De Candia P, Minopoli G, Verga V, Gargiulo A, Vanoni M, Alberghina L. Nutritional limitation sensitizes mammalian cells to GSK‐3 inhibitors and leads to growth impairment. Am J Pathol 2011;178:1814–23. [DOI] [PMC free article] [PubMed] [Google Scholar]
- 19. Toh PP, Li JJ, Yip GW, Lo SL, Guo CH, Phan TT, Bay BH. Modulation of metallothionein isoforms is associated with collagen deposition in proliferating keloid fibroblasts in vitro. Exp Dermatol 2010;19:987–93. [DOI] [PubMed] [Google Scholar]


