

Abstract
The intrinsic factors associated with delayed wounds are ischaemia, infection, the presence of necrotic tissue and the presence of foreign bodies. This study was designed to create adaptable intrinsic factors induced delayed wound healing model in the pig, similar to clinical conditions. Four pigs were used in this study. Ten 4 × 4 cm fresh full‐thickness skin defect wounds were made on the back of each pig. Double‐flanged blocks made of silicon, a material that induces foreign body reactions, tissue ischaemia and causes local wound infection, were inserted into half of the wounds (n = 5) and removed at weeks 1, 2 or 3. The other wounds (n = 5) were left open for control purposes. Biopsies were obtained at weeks 1–4 for histological examinations and to evaluate inflammatory cytokines, which included tumour necrosis factor‐α (TNF‐α), interleukin (IL)‐1β and IL‐6. A Periscan PIM 3 Laser was used to measure degrees of ischaemia. A Visitrak Digital® device was used to measure the sizes of unhealed wounds. After 3 weeks, unhealed mean wound sizes were 30·72 ± 3·36 and 2·91 ± 1·51 cm2, in the experimental and control groups, respectively. Laser Doppler showed limited perfusion at wound margins in wounds containing silicone blocks. Histological findings corresponding to the severity of chronic inflammation were markedly higher and persisted until week 3 in the experimental group. The levels of IL‐1 and TNF‐α in the third week were statistically significantly higher in the model group. Also, in the fourth week, the level of TNF‐α in the model group was significantly higher. Epithelialisation was not complete at the end of the fourth week despite removing silicone blocks in the experimental group. On the basis of macroscopic and histological evaluations and molecular assessments, the described wound model has the characteristics of wound ischaemia and necrosis and persistent inflammation, which are very similar to delayed wounds of patients.
Keywords: Animal model, Chronic wound, Delayed wound, Pig
Introduction
The animal models currently used for chronic wounds are a diabetes‐induced animal model (1), models created by steroid treatment or the administration of anticancer agents or radiation (2), and an ulcer model that induces skin necrosis by the application of temporary pressure and heat (3). However, these delayed wound healing animal models are almost entirely based on small animals, and thus, are unsuitable for skin wound healing research relevant to humans, because the skin wound healing mechanism in small animals is not achieved by epithelialisation but rather by wound contraction. However, unlike small mammals, the pig does not have a panniculus carnosus, and it heals mainly via reepithelialisation as occurs in man (4). Currently, the pig is the best subject for skin wound healing studies 4, 5. One previous study of wound healing that used a pig model, investigated the effects of radiation (6) and another study used a polytetrafluoroethylene (PTFE) wound chamber, which was used to isolate the wound and not to study delayed wound healing (7).
Despite advancements in research into wound healing, investigators continue to try to develop improved wound healing materials, such as dressings, epidermal analogues and dermal substitutes, using fresh animal wounds. However, the conditions used in research studies tend to be considerably different from human wounds. Acute and chronic wounds are both extremes of a wound, actual wounds in clinic are between them.
The aim of this study was to develop a simple and reproducible clinically relevant delayed wound healing model using the pig that could be used for wound healing studies. In this study, intrinsic factors, such as infection, necrotic tissues and foreign bodies, were used to induce chronic inflammation during wound healing in a pig model. In addition, the clinical, histological and molecular factors associated with wound healing were investigated.
Materials and methods
Experiment animals
Four female Yorkshire pigs without skin disease were used in this study. The pigs were 3 months old with similar height and body shape and of average weight 35 kg. They were moved from an animal room to a laboratory 1 week prior to the experiments, and maintained in an isolated room. Standardised feed was given, and the room environment was maintained at 24°C and 65% humidity. In addition, a 12‐hour light/dark cycle was implemented to maintain circadian rhythm.
Preparation of the silicon block
Industrial silicone blocks were used to induce chronic inflammation. Two silicone plates (width 65 mm, length 65 mm and thickness 2 mm) were attached to the top and bottom of a square silicon plate (45 × 45 × 8 mm) to form double‐flanged silicone blocks (Figure 1). The blocks were washed and sterilised, placed in a sterile container, stored at 4°C until required.
Figure 1.
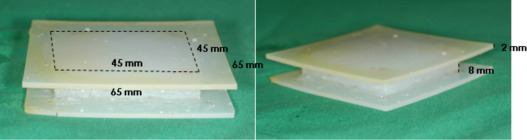
The prefabricated silicone block showing the upper and lower flanges.
Animal experiments
The Keimyung University School of Medicine Institutional Animal Care and Use Committee approved all animal experimental procedures. Malate acepromazine (4 ml) (Sedaject®, Samu Median, Yesan, South Korea) was intramuscularly injected for sedation. Five minutes later, anaesthesia was induced by injecting 2 ml of ketamine (Ketar®, Yuhan‐Pharm, Ochang, Korea) and xylazine hydrochloride (Rompun®, Bayer Korea, Gyeonggi, Korea) intramuscularly into a hip. To maintain anaesthesia, 3 mg/kg propofol (Pofol®, DongKook‐Pharm, Seoul, South Korea) was injected through the auricularis externalis vein. Hair was then shaved and skin was washed with saline and sterilised with glucuronic acid chlorhexidine solution and Betadine.
Wounds were created by marking the dorsal skin, near the spine, using a permanent marker and a template measuring 40 × 40 mm. A sterile 10 scalpel blade was used to excise marked areas down to the fascia. Wounds were separated by 50 mm, and each pig received 10 wounds. Five randomly selected wounds per pig were maintained in an open state as controls. Prefabricated silicone blocks were inserted into the other five wounds in each animal and secured with nylon 3‐0 sutures (Figure 2). All wounds were kept open without dressing to expose them to infection. Antibiotics were not administered. The four pigs were euthanised at weeks 1–4 after surgery, respectively. Degrees of wound contraction and epithelialisation were measured, and tissue biopsies were performed for histological and molecular examinations. Silicone blocks were removed at 3 weeks after surgery from the pig euthanised at 4 weeks, whereas silicone blocks were removed from the other pigs after sacrifice (Figure 3).
Figure 2.
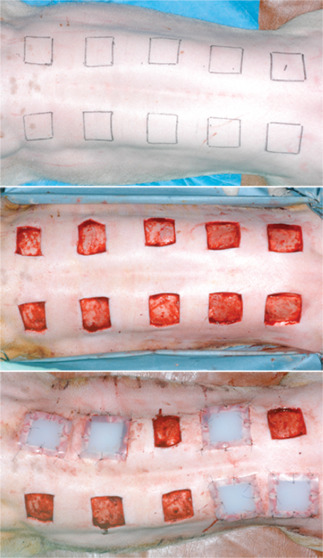
Preoperative design and immediate postoperative view. Ten full‐thickness skin defects, 40 × 40 mm in size, were created on the backs of four pigs. Control wounds (5 per animal) were left untouched, but a silicone block was inserted into experimental wounds.
Figure 3.
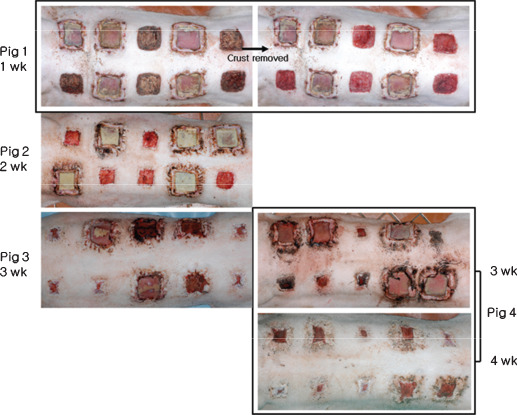
Photographical view of all four pigs after silicone block removal; pigs were euthanised at weeks 1, 2, 3 or 4 after surgery to measure degrees of wound contraction and epithelialisation and to obtain tissue biopsies for histological and molecular studies. Silicone blocks were removed from pig 4 at 3 weeks after surgery.
Measurement of degrees of contraction and epithelialisation
After removing silicone blocks, wounds area were measured with a Visitrak Digital® device (Smith & Nephew, Hull, UK), according to the manufacturer's instructions. Briefly, a two‐layered plastic sheet was placed on the top of each wound, and a marker pen was used to trace the contracted and epithelialised wound edges accurately; we did not differentiate between wound contraction and epithelialisation. The sterilised adhesive layer of the plastic sheet contacting the wound was then separated from the upper transparent layer, which was placed on the Visitrak Digital® device. The outline of the wound was redrawn along the marked line using a special stylus to measure the wound surface. Statistical analysis was performed using nonparametric test methods and Wilcoxon's signed ranks test. Data were analysed using Windows SPSS version 12·0.
Measurement of the degree of ischaemia
A Periscan PIM 3® Laser Doppler blood perfusion imager (Perimed AB, Stockholm, Sweden) was used to ensure that an ischaemic condition was induced by silicone blocks at wound edges. By scanning tissue with a low power laser beam, colour‐coded images of blood perfusion were produced of the microvasculature. Blood flows in wound margins were measured after excising a small piece of upper silicone flanges to allow a Doppler beam to pass through tissues in the inter‐flange gap (Figure 4).
Figure 4.
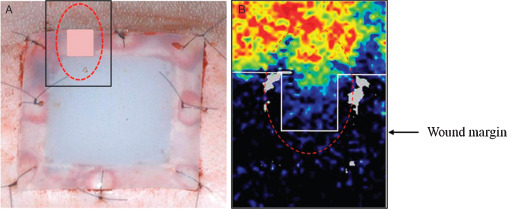
(A) A piece of the upper flange of silicone blocks was removed to confirm the presence of ischaemia beneath using Laser Doppler beam. (B) Laser Doppler images showing reduced blood flow between the wound margin and the flange edge.
Tissue biopsies and histological examinations
Pig were euthanised at weeks 1–4 postoperatively by injecting 20 mg of thiopental sodium (Pentotal®, Choongwae, Seoul, Korea) and 10 mg of vecuronium bromide (Vecaron®, Reyon, Seoul, Korea) intravenously. After removing silicone blocks and measuring wound areas, biopsy was performed on half of each wound, samples included underlying fascia and 10 mm of normal skin around the wound edge for histological evaluation (n = 5 per group). On the other halves of wounds, granulation tissues on the wound bed, not including underlying fascia and normal skin, were harvested for molecular evaluations (n = 5 per group) (Figure 5). Two histological sections were acquired per biopsy specimen. Biopsy tissues for histological evaluation were fixed in 10% neutral buffered formalin and 4‐mm thick specimens were processed in alcohol and stained with haematoxylin and eosin (H&E). A light microscope at a magnification of 40× and 200× was used to analyse the severities of acute and chronic inflammation and degrees of epithelialisation. Severities of acute and chronic inflammation were graded as 0 (none), 1 (minimal), 2 (mild), 3 (moderate) or 4 (severe) (Table 1). In addition, degrees of epithelialisation in control and experimental groups were graded as 0 (none), 1 (mild epithelialisation), 2 (epithelialisation of more than half of wound) and 3 (complete epithelialisation). To examine histological changes objectively, two examiners (unaware of the experimental procedure) evaluated degrees of acute and chronic inflammation and epithelialisation. H&E stained slides was scored using histometric scoring scales (Table 1). Severity of neutrophil and eosinophil invasion was used as a marker of degree of acute inflammation, and numbers of lymphocytes and plasma cells as a marker of degree of chronic inflammation.
Figure 5.
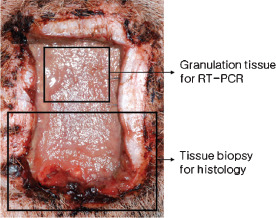
Granulation tissues were harvested for reverse transcription‐polymerase chain reaction, and a tissue biopsy, including underlying fascia and 10 mm of normal skin around the wound edge, was conducted for histological examination.
Table 1.
The semi‐quantitative histometric scoring scales used to grade acute inflammation and chronic inflammation
| Score | Assessment |
|---|---|
| 0 | Absent |
| 1 | Minimal |
| 2 | Mild |
| 3 | Moderate |
| 4 | Severe/marked |
Molecular biological examinations
Granulation tissues obtained from the half of each wound bed were homogenised in TRI Reagent (Sigma Chemical Co, St Louis, MO) using a homogeniser and total RNA was extracted. The purity and concentration of the extracted RNA were determined using a ultraviolet (UV) spectrophotometer (GeneQuant pro, Amersham Biosciences, Buckinghamshire, UK). cDNA was subsequently synthesised using a First Strand cDNA Synthesis Kit (Fermentas, Vilnius, Lithuania).
Sense and antisense primer sequences of interleukin (IL)‐1β, IL‐6, tumour necrosis factor‐α (TNF‐α) and β‐actin (the internal control) were used for polymerase chain reaction (PCR). The primer sequences reported by Sabourin et al. (8) were used (primer production was outsourced to BIONICS, Seoul, Korea) (Table 2). PCR in 1 µl cDNA, 0·25 µl Taq polymerase (SolGent, Daejeon, Korea), 1 µl 10 mmol/l dNTP, 5 µl 10× buffer and 2 µl of each primer (10 pmol/µl) made up to 50 µl. PCR was performed using a thermal cycler (Eppendorf, Hamburg) and an annealing temperature of 60°C for IL‐1β, 56°C for IL‐6, 65°C for TNF‐α and 63°C for β‐actin. Amplification was performed over 35 cycles (Table 2). PCR products (10 µl) were electrophoresed using a 1 kb DNA Ladder (SolGent) in 2% agarose gels containing ethidium bromide. Fluorescent bands were assessed under UV light. Amounts of IL‐1β, IL‐6 and TNF‐α produced versus β‐actin were compared and analysed using the Scion image software program (Scion Corporation, Frederick, MD). Statistical analysis was performed using t‐test and Mann–Whitney U test.
Table 2.
Primer sequences and polymerase chain reaction conditions
| Primer | Sequence | Size (bp) | Annealing temperature (°C) | |
|---|---|---|---|---|
| IL‐1β | Sense | AAA GGG GAC TTG AAG AGA G | 285 | 60 |
| Antisense | CTG CTT GAG AGG TGC TGA TAT | |||
| IL‐6 | Sense | ATG AAC TCC CTC TCC ACA AGC | 493 | 56 |
| Antisense | TGG CTT TGT CTG GAT TCT TTC | |||
| Tumour necrosis factor‐α | Sense | ATC GGC CCC CAG AAG GAA GAG | 351 | 65 |
| Antisense | GAT GGC AGA GAG GAG GTT GAC |
IL, interleukin.
Analysis of wound infection
Taking the culture with sterile and moisten the swab tip with normal saline, swab the wound using a broad z stroke, rotating the swab between the fingers, from margin to margin in a five‐point zigzag fashion after postoperation weeks 1–4. The swab was transported immediately to the laboratory for culture. A culture plate (Mac Conkey Agar, Sheep Blood Agar Plate, Asan Pharmaceutical, Seoul, Korea) sectioned into four and the swab planted directly by rolling the swab over an area about 2 cm in diameter in the first quadrant of the plate and then continuously inoculated onto the second, third and fourth quadrant. The plate was placed into an incubator for 24 hours at 35 ± 1°C. A semi‐quantitation method was used for interpretation as 1+ to 4+, based on the following criteria. If bacterial colony within the first quadrant: ‘1+ growth’; two quadrants: ‘2+ growth’; three quadrants: ‘3+ growth’ and four quadrants: ‘4+ growth’. Gram stain was performed as a usual manner. A biochemical tests were used for identification of microorganisms with API‐20E test Kit (BioMerieux Vitek Inc., Hazelwood, MO).
Results
Macroscopic analysis
Wound epithelialisation initiated from wound edges in the control group at 1 week after surgery, epithelialisation and wound contraction progressed at 2 weeks, and by 3 weeks after surgery, epithelialisation and wound contraction had progressed rapidly. Wound epithelialisation was almost complete at 4 weeks after surgery (Figure 6).
Figure 6.
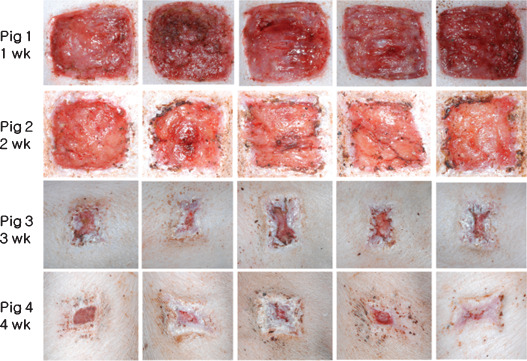
All images of control wounds; wound epithelialisation started at 1 week after surgery. Epithelialisation and wound contraction progressed at 2 weeks, progressed rapidly at 3 weeks, and epithelialisation was almost complete at 4 weeks.
In the experimental group, epithelialisation and wound contraction were not detected for up to 2 weeks after surgery. At 3 weeks, wounds were much larger than in controls at week 2, and also showed severe infection and marginal necrosis. At 4 weeks (silicone blocks were removed at 3 weeks) rapid wound epithelialisation and contraction were observed. Nonetheless, complete wound healing was not achieved at 4 weeks after surgery (Figure 7).
Figure 7.
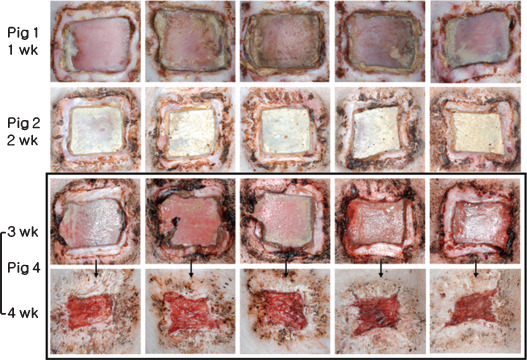
Images of experimental wounds; epithelialisation and wound contraction were not detected while silicone blocks were inserted. Wounds were largest at 3 weeks. Silicone blocks were removed at 3 weeks after surgery, rapid wound epithelialisation and contraction followed. Nonetheless, wound healing was far from complete at 4 weeks after surgery.
Analysis of degree of wound contraction and epithelialisation
In the control group, wound sizes reduced progressively. Mean wound sizes at weeks 1, 2, 3 and 4 after surgery were 23·15 ± 1·35, 12·59 ± 1·33, 2·91 ± 1·51 and 0·71 ± 0·55 mm, respectively, and wounds had almost completely healed at 4 weeks after surgery.
In the experimental group, mean wound sizes were 25·71 ± 2·06, 21·70 ± 2·31 and 30·72 ± 3·36 mm at weeks 1, 2 and 3 after surgery, respectively. At 3 weeks, mean wound size increased, and then, rapidly decreased to 10·20 ± 1·9 mm at 4 weeks (after silicone block removal). Nonetheless, healing was incomplete at 4 weeks after surgery (Table 3, Figure 8).
Table 3.
Wound contraction and epithelialisation (cm2) at weeks 1–4 after surgery determined using the Visitrak® (P< 0·05)
| Week 1 | Week 2 | Week 3 | Week 4 | |
|---|---|---|---|---|
| Model | 25·71 ± 2·06 | 21·70 ± 2·31 | 30·72 ± 3·36 | 10·20 ± 1·49 |
| Control | 23·15 ± 1·35 | 12·59 ± 1·33 | 2·91 ± 1·51 | 0·71 ± 0·55 |
Figure 8.
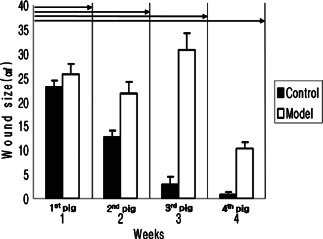
Measurements of wound contraction after weeks 1–4 pigs obtained using the Visitrak Digital® device. In the control group, wounds decreased with time. In the experimental group, wound sizes increased for 3 weeks, and then decreased rapidly after silicon block removal (P< 0·05).
Analysis of degree of ischaemia
Laser Doppler produced colour‐coded images of red and yellow in most accessible wound areas, but wound peripheries were coloured green and blue indicating reduced perfusion only in the experimental group. These observations suggest that blood flow at wound peripheries was much reduced (Figure 4).
Microscopic analysis
In the control group, acute inflammation scores were 2·6, 1·8, 0·4 and 0·6 at weeks 1, 2, 3 and 4 after surgery, respectively (Figure 9A), indicating a reduction in the degree of acute inflammation gradually with time (Figure 10A–D). Chronic inflammation scores increased from 1·2 at 1 week to 2·4 at 2 weeks (Figure 9B), and then decreased to 1·4 at 3 weeks and 0·8 by 4 weeks (Figure 9B), indicating the near absence of chronic inflammation at week 3 (Figure 10A–D). Epithelialisation scores in the control groups were 0, 0·6, 2·6 and 2·8 points at weeks 1, 2, 3 and 4, respectively (Figure 9C), indicating that epithelialisation was almost complete after 3 weeks (Figure 12A–D).
Figure 9.
Semi‐quantitative analysis results of acute inflammation (A), chronic inflammation (B) and epithelialisation (C) in the two study groups.
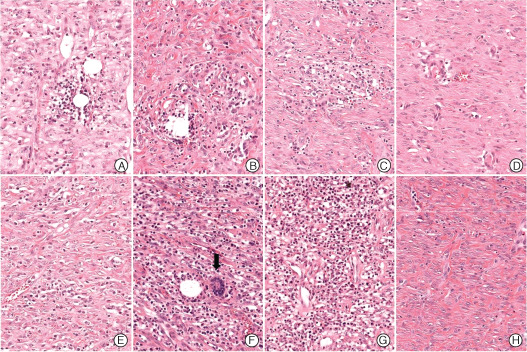
Figure 10.
Microscopic findings of acute inflammation in the control (A–D) and experimental groups (E–H) (haematoxylin and eosin stain, ×200). Neutrophil and eosinophil infiltration decreased in both groups with time, but acute inflammation was markedly higher in the experimental group at 1 week after surgery (E). A – week 1, B – week 2, C – week 3, D – week 4, E – week 1, F – week 2, G – week 3, H – week 4.
In the experimental group, acute inflammation scores showed a marked decrease from 3·4 at week 1 to 1·8 at week 2 after surgery, and then continuously decreased to 0·6 at week 3 and 0·8 at week 4 (9, 10). Chronic inflammation scores were 2·4, 3·8 and 3·6 points at weeks 1, 2 and 3 after surgery, respectively, but fell to 1·4 following silicon block removal at 3 weeks after surgery (Figure 9B). In the experimental group, histologic chronic inflammation severity was markedly increased and persisted until week 3 (Figure 11E–G). In particular, at weeks 2 and 3, giant cells were frequently noted (Figure 11F, arrow). In the experimental group at week 4, chronic inflammation was markedly diminished (Figure 11H). Degree of epithelialisation scores in the experimental group were 0, 0, 0·6 and 0·8 at weeks 1, 2, 3 and 4, respectively (Figure 9C). No epithelialisation was observed in this group until week 3 (Figure 12E–G) and then only partial epithelialisation was found at wound edges (Figure 12H).
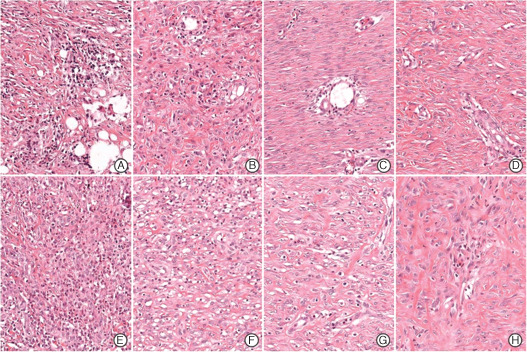
Figure 11.
Microscopic findings of chronic inflammation in the control (A–D) and experimental groups (E–H) (haematoxylin and eosin stain, ×200). The severity of chronic inflammation in control wounds reduced gradually (A–D), but the severity of chronic inflammation, as assessed by performing lymphocyte and plasma cell counts was markedly elevated at week 3 in the experimental group (E–H). In particular, giant cells and heavy lymphoplasmocytic infiltration were observed at week 2 in the experimental group (E, arrow). At 4 weeks after the experimental group still showed obvious chronic inflammation (H). A – week 1, B – week 2, C – week 3, D – week 4, E – week 1, F – week 2, G – week 3, H – week 4.
Figure 12.
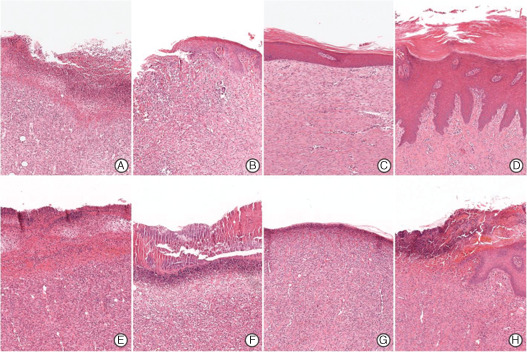
Microscopic findings of epithelialisation in the control (A–D) and experimental groups (E–H) (haematoxylin and eosin staining, ×40). At 1 week after surgery, epithelialisation is not observed in either group (A and E, respectively). In the control group, epithelialisation progressed gradually (B) and reached near completion at 3 weeks after surgery (C) and complete epithelialisation at 4 weeks with collagen fibre maturation (D). However, epithelialisation did not start until week 3 in the experimental group (E–G), and epithelialisation was observed at wound peripheries only at 4 weeks (D). A – week 1, B – week 2, C – week 3, D – week 4, E – week 1, F – week 2, G – week 3, H – week 4.
Molecular biological analysis
In pig 1, 1 week silicone blocks implantation group, levels of IL‐1β, IL‐6 and TNF‐α in experimental group were higher than control group (Table 4, Figure 13A). However, in statistical analysis using the t‐test, the two groups showed no statistically significant differences. In pig 2, 2 weeks implantation group, the level of IL‐1β and TNF‐α were higher in control group than experimental group. Although more IL‐6 was detected in the control group compared with experimental model group, both results were statistically insignificant (Table 4, Figure 13B).
Table 4.
Cytokine levels in granulation tissues at weeks 1–4 after surgery
| Pig 1 | Pig 2 | Pig 3 | |||
|---|---|---|---|---|---|
| Week 1 | Week 2 | Week 3 | Week 4 | ||
| IL‐1β | Control | 1·22 ± 0·48 | 0·74 ± 0·22 | 0·84 ± 0·25 | 0·45 ± 0·35 |
| Model | 1·43 ± 0·19 | 0·92 ± 0·09 | 1·35 ± 0·25 | 0·47 ± 0·13 | |
| IL‐6 | Control | 0·68 ± 0·34 | 0·40 ± 0·20 | 0·65 ± 0·44 | 0·12 ± 0·27 |
| Model | 0·95 ± 0·32 | 0·15 ± 0·20 | 1·19 ± 0·44 | 0·30 ± 0·27 | |
| Tumour necrosis factor‐α | Control | 0·20 ± 0·24 | 0·11 ± 0·21 | 0·09 ± 0·22 | 0·05 ± 0·05 |
| Model | 0·35 ± 0·22 | 0·13 ± 0·22 | 0·69 ± 0·34 | 0·18 ± 0·09 | |
IL, interleukin.
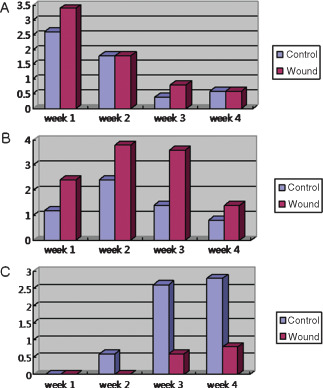
Figure 13.
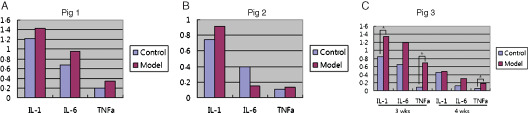
(A) All cytokine levels in pig 1, which had silicone blocks for 1 week, showed higher in experimental model group. (B) Interleukin (IL)‐1β and tumour necrosis factor‐α (TNF‐α) levels in pig 2, which had silicone blocks for 2 weeks, showed higher in model group. (C) In pig 3, 3 week implantation group, levels of IL‐1β, IL‐6 and TNF‐α in experimental group were higher than control group at weeks 3 and 4. The levels of IL‐1 and TNF‐α in the third week were statistically significantly higher in the model group. Also, in the fourth week, the level of TNF‐α in the model group was significantly higher. All levels of IL‐1β, IL‐6 and TNF‐α significantly decreased at fourth week in both control and experimental groups. Statistical analysis showed that all cytokines significantly decreased except TNF‐α.
In pig 3, 3 weeks implantation group, molecular biologic studies were conducted just after silicone blocks removed at third week and 1 week after, which is fourth week. Levels of IL‐1β, IL‐6 and TNF‐α in experimental group were higher than control group at weeks 3 and 4. When statistically analysed, the levels of IL‐1 and TNF‐α in the third week were significantly higher in the model group. Also, in the fourth week, the level of TNF‐α in the model group was significantly higher. All levels of IL‐1β, IL‐6 and TNF‐α significantly decreased at fourth week in both control and experimental groups. Statistical analysis showed all cytokines were significantly decreased except TNF‐α (Table 4, Figure 13C).
Wound infection
All control and experimental group wound were cultured 4+ Gram positive and Gram negative from week 1 to 4. In Gram‐negative culture, experimental group showed 3+ at weeks 1 and 2 and 2+ at weeks 3 and 4 but control group was 2+ at week 1 and 1+ at week 3 (Table 5). Escherichia Coli, Bacillus species, Staphylococcus aureus and Enterobacter amnigenus were identified by API‐20E test Kit.
Table 5.
Wound culture findings of the two groups
| Model (n = 2) | Control (n = 2) | |||||||
|---|---|---|---|---|---|---|---|---|
| Week 1 | Week 2 | Week 3 | Week 4 | Week 1 | Week 2 | Week 3 | Week 4 | |
| Gram (+) and (−) | + + ++ | + + ++ | + + ++ | + + ++ | + + ++ | + + ++ | + + ++ | + + ++ |
| Gram (−) | + + + | + + + | ++ | ++ | ++ | + | ||
Discussion
The factors associated with the impairment of wound healing are generally classified as intrinsic or extrinsic. The intrinsic factors are ischaemia, infection, the presence of necrotic tissue and foreign bodies, whereas the extrinsic factors are diabetes mellitus, cancer, chronic disease, steroid use, radiation injury and malnutrition (9). In order to develop a clinically relevant delayed wound healing model, we focused on the intrinsic factors, ischaemia, necrotic tissue, foreign body and infection.
Ischaemia has been shown to cause wound healing impairment (10). In our model, three methods were used to produce tissue ischaemia. First, silicone blocks were designed to be 5 mm larger than wounds so that the blocks would exert pressure on the edges of wounds. Second, each block had two 10 mm flanges, and the lower flange was placed between the dermis and fascia at the edge of the wound, in order to block blood supply deep to the wound. This resulted in the wound edges being sandwiched between the upper and lower flanges. After positioning blocks they were firmly sutured in position using 3‐0 nylon to aggravate tissue ischaemia and induce tissue necrosis.
Photographic (Figure 14) and Laser Doppler imaging (Figure 4) findings, and histologic sections (Figure 11) indicated much reduced blood flow and tissue necrosis at wound margins in the experimental group.
Figure 14.
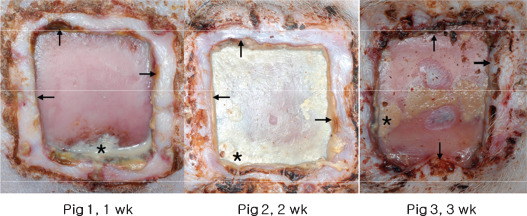
Photographs showing severe infection (*) and marginal wound necrosis (black arrow).
At 3 weeks after surgery, inflammation persisted and no epithelialisation was detected in the experiment group after silicone blocks were removed (7, 11). However, after block removal healing progressed rapidly, and thus, if investigators want to compare dermal substitutes or dressing materials using our model they should choose an optimal time for silicone block removal and experimental material insertion. From our experiment, we recommend to graft experimental test materials within 3 days after silicone block removal before inflammation subsides.
Bacterial colonisation is sufficient to cause a chronic wound (11). Recently, James et al. (12) reported that 60% of chronic wounds contained bacterial biofilms. In our previous study, we found that Staphylococcus and Gram negative bacilli infections were induced by the same type of silicone block (13). In this study, all control and experimental group wound were cultured 4+ Gram positive and Gram negative from week 1 to 4 and Escherichia Coli, Bacillus species, Staphylococcus aureus and Enterobacter amnigenus were identified. However, we failed to differentiate the severity of wound infections between control and experimental group. It might be because of cross contamination because all wounds were opened without dressings. In macroscopic analysis, we found more serious infections and marginal tissue necrosis of experimental groups, as evidenced by wound discharge and foul smell (Figure 14).
The presence of necrotic tissue, bacteria and foreign bodies in chronic wounds promotes the influx of inflammatory cells. Consequently, inflammatory cytokines, such as TNF‐α, IL‐1 and IL‐6, released by these cells are high in the exudates of chronic wounds (14). Furthermore, it has been reported that inflammatory cytokines induce the expression of matrix metalloproteinase and suppress the expression of tissue inhibitor of metalloproteinase (15), which disrupts the balance between matrix metalloproteinase and tissue inhibitor of metalloproteinase and establishes a vicious circle.
IL‐1β stimulates fibroblast growth, accelerates collagenase production and suppresses endothelial cell growth, and therefore, antagonises the metabolism of extracellular matrix by transforming growth factor‐β (16). During the normal wound healing process, IL‐1 levels peak in wound within 8 days postinjury (17). In this study, we found a substantially greater amount of IL‐1β in the experimental group than in the control group. In the experimental group, a large amount of IL‐1β was detected in the granulation tissue at 3 weeks after surgery, and thus, our model resembled the pattern of chronic wounds and not the normal wound healing process. Normally, the level of IL‐6 peaks 3 days after injury (17), and it responsible for stimulating the growth and differentiation of keratinocytes that are responsible for epithelialisation. However, the silicone blocks used in this study probably suppress epithelialisation. Therefore, in our model IL‐6 levels remained high in the granulation tissue at weeks 3 and 4 after surgery. But that was statistically insignificant.
TNF‐α is produced by damaged vascular endothelial cells, keratinocytes and fibroblasts, and attracts inflammatory cells to wounds. During normal wound healing, the level of TNF‐α peaks at 2–3 days after injury and stimulates wound healing. However, it has been reported that if a wound is exposed to high levels of TNF‐α for a long time, procollagen mRNA and protein synthesis are reduced, which reduces the tensile strength of the wound and adversely affects wound healing (17). This study shows that statistically higher level of TNF‐α were present at weeks 3 and 4 after surgery in the experimental group, which suggests that the devised model effectively interfered with wound healing. And wound exudates were greatest at third week and wounds increased in size, it seems likely that this occurred in concert with an increase in inflammation. This suggestion is supported by our histological findings, which showed elevated markers of chronic inflammation at 2 weeks.
According to a study performed by Yamada et al. (18), IL‐6 and TNF‐α are markers of severe inflammation. In addition, it has been reported in wounds infected with Gram‐negative bacteria that endotoxin released by the bacteria stimulate TNF‐α production (19). At 3 weeks after surgery, wound sizes and inflammatory cytokines levels were detected statistically higher in the experimental group than in the control group. For this reason, we recommend that the silicone block be inserted for at least 3 weeks to form a reliable delayed wound.
Summarising, the described silicone model was found to be reproducible and adaptable, and the timing of block removal was found to modulate the wound healing process. Furthermore, we believe that the merits of dermal substitutes and dressing materials should be compared using this clinically relevant wound model not an acute wound model.
References
- 1. Tsuboi R, Shi CM, Rifkin DB, Ogawa H. A wound healing model using healing impaired diabetic mice. J Dermatol 1992;19:673–5. [DOI] [PubMed] [Google Scholar]
- 2. Kumar P, Jagetia GC. Modulation of wound healing in Swiss albino mice by different doses of gamma radiation. Burns 1995;21:163–5. [DOI] [PubMed] [Google Scholar]
- 3. Daniel RK, Priest DL, Wheatley DC. Etiologic factors in pressure sores: an experimental model. Arch Phys Med Rehabil 1981;62:492–8. [PubMed] [Google Scholar]
- 4. Sullivan TP, Eaglstein WH, Davis SC, Mertz P. The pig as a model for human wound healing. Wound Repair Regen 2001;9:66–76. [DOI] [PubMed] [Google Scholar]
- 5. Wang JF, Olson ME, Winkfein RJ, Kulyk WM, Wright JB, Hart DA. Molecular and cell biology of porcine HSP 47 during wound healing: complete cDNA sequence and regulation of gene expression. Wound Repair Regen 2002;10:230–40. [DOI] [PubMed] [Google Scholar]
- 6. Bernatchez S, Parks PJ, Grussing DM, Matalas SL, Nelson GS. Histological characterization of a delayed wound healing model in pig. Wound Repair Regen 1998;6:223–33. [DOI] [PubMed] [Google Scholar]
- 7. Hollander DA, Erli HJ, Theisen A, Falk S, Kreck T, Muller S. Standardized qualitative evaluation of scar tissue properties in an animal wound healing model. Wound Repair Regen 2003;11:150–7. [DOI] [PubMed] [Google Scholar]
- 8. Sabourin CLK, Danne MM, Buxton KL, Casillas RP, Schlager JJ. Cytokine, chemokine, and matrix metalloproteinase response after sulfur mustard injury to weanling pig skin. J Biochem Mol Toxicol 2002;16:263–72. [DOI] [PubMed] [Google Scholar]
- 9. Izadi K, Ganchi P. Chronic wounds. Clin Plast Surg 2005;32:209–22. [DOI] [PubMed] [Google Scholar]
- 10. Sisco M, Mustoe TA. Animal models of ischemic wound healing: toward an approximation of human chronic cutaneous ulcers in rabbit and rat. Methods Mol Med 2003;78:55–65. [DOI] [PubMed] [Google Scholar]
- 11. Mustoe TA, O'Shaughnessy K, Kloeters O. Chronic wound pathogenesis and current treatment strategies: a unifying hypothesis. Plast Reconstr Surg 2006;117(suppl):35S–41S. [DOI] [PubMed] [Google Scholar]
- 12. James GA, Swogger E, Wolcott R, Pulcini E, Secor P, Sestrich J, Costerton JW, Stewart PS. Biofilms in chronic wounds. Wound Repair Regen 2008;16:37–44. [DOI] [PubMed] [Google Scholar]
- 13. Sohn HB, Son DG, Kim JH. Development of a chronic skin wound defect: a swine model. J Korean Soc Plast Reconstr Surg 2006;33:606–11. [Google Scholar]
- 14. Tarnuzzer RW, Schultz GS. Biochemical analysis of acute and chronic wound environments. Wound Repair Regen 1996;4:321–5. [DOI] [PubMed] [Google Scholar]
- 15. Nwomeh BC, Yager DR, Cohen IK. Physiology of the chronic wound. Clin Plast Surg 1998;25:341–56. [PubMed] [Google Scholar]
- 16. Zhou LJ, Matsui R, Ono I. Development of a chronic skin defect model and a study of cytokine secretion using the model. Wound Repair Regen 2000;8:304–18. [DOI] [PubMed] [Google Scholar]
- 17. Mast BA, Schultz GS. Interactions of cytokines, growth factors, and proteases in acute and chronic wounds. Wound Repair Regen 1996;4:411–20. [DOI] [PubMed] [Google Scholar]
- 18. Yamada Y, Endo S, Inada K. Plasma cytokine levels in patients with severe burn injury‐with reference to the relationship between infection and prognosis. Burns 1996;22:587–93. [DOI] [PubMed] [Google Scholar]
- 19. Michie HR, Maogue KR, Spriggs DR. Detection of circulating tumor necrosis factor after endotoxin administration. N Engl J Med 1988;318:1481–6. [DOI] [PubMed] [Google Scholar]