

Abstract
Sulphur mustard (SM) is a bifunctional alkylating agent that causes cutaneous blistering in humans and animals. In this study, we have presented closer views on pathogenesis of SM‐induced skin injury in a mouse model. SM diluted in acetone was applied once dermally at a dose of 5 or 10 mg/kg to Swiss albino mice. Skin was dissected out at 0, 1, 3, 6, 12, 24, 48, 72 and 168 hours, post‐SM exposure for studying histopathological changes and immunohistochemistry of inflammatory‐reparative biomarkers, namely, transforming growth factor alpha (TGF‐α), fibroblast growth factor (FGF), endothelial nitric oxide synthase (eNOS) and interlukin 6 (IL‐6). Histopathological changes were similar to other mammalian species and basal cell damage resembled the histopathological signs observed with vesication in human skin. Inflammatory cell recruitment at the site of injury was supported by differential expressions of IL‐6 at various stages. Time‐dependent expressions of eNOS played pivotal roles in all the events of wound healing of SM‐induced skin lesions. TGF‐α and FGF were strongly associated with keratinocyte migration, re‐epithelialisation, angiogenesis, fibroblast proliferation and cell differentiation. Furthermore, quantification of the tissue leukocytosis and DNA damage along with semiquantitative estimation of re‐epithelialisation, fibroplasia and neovascularisation on histomorphologic scale could be efficiently used for screening the efficacy of orphan drugs against SM‐induced skin injury.
Keywords: DNA damage, eNOS, FGF, IL‐6, Sulphur mustard, TGF‐α
Introduction
Sulphur mustard (SM; bis 2‐chloroethyl sulphide) is an extremely toxic blistering and vesicating chemical warfare agent. It has been used in the past against military personnel in World War I as well as against civilians‐ the Kurdish population‐ in Iraq in 1980, leading to immense distress. Despite the signing of treaties, such as the Geneva protocol of 1925 and Chemical Weapons Convention (CWC) of 1993, usage of chemical agents in warfare and potential for their usage in acts of terrorism still pose a serious global threat (1). SM does not cause any immediate noticeable effect (1). However, erythema appears within few hours of exposure followed by oedema and blister formation. Cutaneous exposure to SM in animals or humans is characterised by oedema, dermal infiltration of inflammatory cells, premature death of basal layer epidermal cells and epidermal–dermal separation (2).
SM acts through various mechanisms, thereby making it difficult to exactly pinpoint a specific mechanism by which it works. SM alkylates nearly every constituent of the cell, leading to impaired functions (3). SM‐induced DNA damage results in poly (ADP‐ribose) polymerase (PARP) activation with marked depletion of cellular NAD+ and ATP levels, which in consequence results in necrotic cell death (4). Mild PARP activation does not disturb cellular energy levels and allows apoptotic cell death or recovery to occur 5, 6. Glutathione is an intracellular scavenger of SM. Thus, SM may cause glutathione (GSH) depletion and enhance the formation of reactive oxygen species (ROS) (7). Cell death is thus proposed to be due to an accumulation of endogenous ROS (e.g. H2O2 accumulation resulting in hydroxyl and perferryl ion formation) leading to lipid peroxidation and irreversible membrane damage (8). Additionally, SM may upregulate many inflammatory mediators including interleukins IL‐1α, IL‐1β, IL‐6, IL‐8, tumour necrosis factor‐α (TNF‐α) and others 9, 10. This cytokine pattern has strong chemotactic activity for neutrophils and macrophages.
Animal models for evaluation of antidotes against SM‐induced dermatotoxicity include weanling pig, hairless guinea pig, rabbit or hairless mouse 11, 12, 13, 14, 15. However, hairless mouse models in which hr gene expression has been reduced or eliminated display phenotypes of hair loss and hyperproliferation of skin and formation of dermal cyst (16). Additionally, lack of polyclonal and monoclonal antibodies and lack of probes and primers to DNA and RNA sequences in weanling pig and guinea pig limits the usefulness of these animals in the study of the pathophysiology of SM‐induced skin lesions (17). The standard mouse ear animal model for studying pathophysiology of SM‐induced skin lesions has been shown to have altered reaction to injury with delayed inflammatory changes compared to mouse skin (18). Animal models exposed to 2‐chloroethyl ethyl sulphide (CEES; half mustard) provides the initial steps for evaluation of therapies that need to be repeated using SM due to differences in the metabolism and the mechanism of action 19, 20. Thus, use of CEES as a simulant of SM for antidote evaluation may not be appropriate.
Most of the research groups mentioned above have highlighted early inflammatory changes of SM‐induced dermatotoxicity in various animal models. Moreover, literature focusing on the reparative phase is scanty. Our recent studies have proposed a new methodology that dermal exposure of SM diluted in acetone can be used to mimic SM‐induced skin toxicity without causing any systemic toxicity in Swiss albino mouse (21). Healing is modified by both systemic and local host factors. Therefore, studying pathophysiology of inflammation or tissue repair in animal models showing impaired systemic host factors will interfere in the proper evaluation of wound healing efficacy of dermal formulations. In view of this, the present study was designed to describe the pathogenesis of SM‐induced skin toxicity along with possible roles of inflammatory‐reparative tissue biomarkers, namely, endothelial nitric oxide synthase (eNOS), transforming growth factor alpha (TGF‐α) and fibroblast growth factor (FGF) that remains unexplored in Swiss albino mouse.
Materials and methods
Chemicals and reagents
SM was synthesised in the Synthetic Chemistry Division of the Establishment and was found to be more than 99% pure by gas chromatographic analysis. Other chemicals of analytical grade were purchased from Sigma‐Aldrich (St. Louis, MO) or Merck (Worli, Mumbai, India).
Animals and treatments
All experiments were performed on randomly bred 25–30 g female Swiss albino mice. Animals were obtained from the Animal Facility of Defence Research and Development Establishment. The care and maintenance of the animals were as per the approved guidelines of the Committee for the Purpose of Control and Supervision of Experiments on Animals (CPCSEA, India). The Institutional Animal Ethical Committee (IAEC) approved the protocol for experiment. The animals were maintained in polypropylene cages on dust‐free and autoclaved paddy husk and fed standard pellet diet (Ashriwad Feeds, Chandigarh, India) and water ad libitum. A day before the SM application, hair from the back region of all mice was closely clipped using a pair of scissors. Animals were randomly allocated to various groups and SM diluted in acetone was applied once dermally at a dose of 5 or 10 mg/kg body weight as mentioned in Table 1.
Table 1.
Animal groups given doses of sulphur mustard diluted in acetone
| Group | Dose of SM (mg/kg body weight) | No. of animals | Time of euthanasia |
|---|---|---|---|
| I | 5 | 6 | 0 hours |
| Control (Acetone Only) | 10 (without SM) | 6 | 0 hours |
| II | 5 | 6 | 1 hour |
| 10 | 6 | 1 hour | |
| III | 5 | 6 | 3 hours |
| 10 | 6 | 3 hours | |
| IV | 5 | 6 | 6 hours |
| 10 | 6 | 6 hours | |
| V | 5 | 6 | 12 hours |
| 10 | 6 | 12 hours | |
| VI | 5 | 6 | 24 hours |
| 10 | 6 | 24 hours | |
| VII | 5 | 6 | 48 hours |
| 10 | 6 | 48 hours | |
| VIII | 5 | 6 | 72 hours |
| 10 | 6 | 72 hours | |
| IX | 5 | 6 | 168 hours |
| 10 | 6 | 168 hours |
Experiment was performed initially with three mice per group and then repeated once and the data was compiled for six mice as shown in the results. All the safety precautions were taken while handling SM during dermal application.
Histopathology
SM‐exposed skin was dissected out and punched on 2 × 2 cm card paper with dorsal side facing downwards and fixed in Bouin's fluid. The skin was processed in ascending concentrations of ethanol, cleared with toluene (Leica tissue processor, TP1020), and embedded in paraffin (Leica embedding station, EG1160). Serial sections (4–5 µm thick) of the paraffin‐embedded tissue blocks were cut with a rotary microtome (Microm HM 360) and processed for haematoxylin and eosin, Masson trichrome [Accustain Trichrome Stains (Masson), Sigma‐Aldrich] and toluidine blue (mast cells and basophils) stain using standardised programme in Leica autostainer XL.
Tissue leukocytosis
Tissue leukocytosis was quantified to assess the cellular reaction. A total of six lesions of the same age were obtained from six different mice and processed for histopathology. In each section, the cells (neutophils, monocytiod cells and basophils) were counted in five representative fields (modified for mice as described earlier by Lomash et al.(22)) and the average of these five fields represent the number of leukocytes per ×40 microscopic field for one animal. The cited results thus represent the mean of averages of six animals in a group ± SE (n = 6) for each time interval. Intravascular and intramural leukocytes were excluded.
TUNEL assay
In situ apoptosis detection by TUNEL staining (Dead End[checktrademark] Colourimetric TUNEL System, Catalouge No. G7131 and G7132; Promega, Madison, WI) was performed using the manufacturers protocol. DNA damage was identified as TUNEL positive cells, and counted randomly in at least five selected fields (40× magnification) of control and SM‐treated skin tissue sections under Leica DMLB microscope using Qwin Version 3 image analysis software (Leica Inc., Germany). TUNEL index was calculated using the following formula:
 |
Immunohistochemistry
The avidin–biotin immunohistochemical staining using Vectastain elite PK‐6200 universal kit (Vector Laboratories Inc., Burlingame, CA) was performed to localise various markers, namely, IL‐6, eNOS, TGF‐α and FGF in the skin sections. Primary antibodies (Mouse monoclonal [213‐4.4] to TGF‐α at 1:20 dilution; Rabbit polyclonal to eNOS at 1:100 dilution; Rabbit polyclonal to FGF and IL‐6 at 1:500 dilution) were procured from Abcam, Cambridge Science Park, Cambridge, UK. Sections were developed using DAB (Peroxidase Substrate kit, DAB, Vector Laboratories Inc.) and counterstained with light green or haematoxylin.
Semiquantitative estimation for localization of immunosignals for various biomarkers was performed using image analysis software Qwin version 6 (Leica Inc.). Briefly, input image was transformed to greyscale image, and threshold (T) was selected to cover area showing false positive signals on negative control (without primary antibody) stained sections. Randomly, five fields were selected for a section at the same threshold and the mean percent area of pixels that lies at T and below it was calculated to define the mean false positive area from negative control sections. Similarly, the mean percent area of pixels that lies at T and below it was calculated for test slides. For actual positive area of localization, the mean false positive area was subtracted from the mean percent area of test slides. Results are cited in terms of mean of percent area and range (minimum to maximum) of positive area shown at a given time interval. Based on the localization area in microscopic field, immunohistological variables were graded on the arbitrary scale ranging from 0 to 4 [0 (absent); 1 (1 < area ≤ 10%) 2 (10 < area ≤ 30%); 3 (30 < area ≤ 50%) 4 (50 < area)].
Statistical analyses
Tissue leukocytosis and TUNEL index were analysed using one‐way analysis of variance with Student–Newman Keuls multiple comparison. A probability of 0·05 and less was taken as statistically significant. The analyses were carried out using SigmaStat software (SigmaStat 2.03 for Windows; SPSS Inc., Chicago, IL).
A decision analysis was carried out to describe the severity of lesions in histopathological variables and semiquantitative grading for immunohistochemical variables. The results from histopathological analysis are presented in the summary incedence table along with their severity on an arbitrary scale of 0–4 (0, nil; 1, minimal; 2, mild; 3, moderate; 4, severe) simultaneously in brackets. Semiquantitative immunohistochemical analysis was done as described above and percent area of localization for various biomarkers were graded on an arbitrary scale ranging from 0 to 4 and cited in graphical form in the results section.
Results
Histopathological changes (Table 2), tissue leukocytosis (Figure 1) and immunohisto‐pathological grading (Figure 2) of TGF‐α, FGF, eNOS and IL‐6 observed during the healing process of SM‐induced skin injury at various time intervals are described below.
Table 2.
Summary incidence table of mice skin lesions at various time intervals after single percutaneous exposure to sulphur mustard (SM) (5 or 10 mg/ kg)
| Lesions | Dose of SM | Time in hours | ||||||||
|---|---|---|---|---|---|---|---|---|---|---|
| 0 | 1 | 3 | 6 | 12 | 24 | 48 | 72 | 168 | ||
| Epidermal necrosis | 5 mg/kg | 0/6(0) | 0/6(0) | 0/6(0) | 4/6(2) | 6/6(2) | 6/6(3) | 6/6(4) | 6/6(4) | 6/6(4) |
| 10 mg/kg | 0/6(0) | 0/6(0) | 0/6(0) | 4/6(2) | 6/6(2) | 6/6(3) | 6/6(4) | 6/6(4) | 6/6(4) | |
| Vacuolation of basal cells | 5 mg/kg | 0/6(0) | 1/6(1) | 4/6(2) | 6/6(2) | 6/6(3) | 6/6(4) | 6/6(4) | 4/6(2) | 4/6(2) |
| 10 mg/kg | 0/6(0) | 3/6(1) | 6/6(2) | 6/6(2) | 6/6(3) | 6/6(4) | 6/6(4) | 4/6(2) | 4/6(2) | |
| Necrosis of basal cells | 5 mg/kg | 0/6(0) | 0/6(0) | 0/6(0) | 0/6(0) | 2/6(1) | 4/6(2) | 6/6(2) | 6/6(3) | 6/6(3) |
| 10 mg/kg | 0/6(0) | 0/6(0) | 0/6(0) | 0/6(0) | 4/6(2) | 6/6(2) | 6/6(3) | 6/6(4) | 6/6(4) | |
| Hyperplasia/ hypertrophy of basal cells | 5 mg/kg | 0/6(0) | 2/6(2) | 4/6(2) | 4/6(3) | 4/6(3) | 5/6(3) | 5/6(3) | 5/6(3) | 6/6(3) |
| 10 mg/kg | 0/6(0) | 3/6(2) | 4/6(2) | 4/6(3) | 4/6(3) | 4/6(3) | 4/6(3) | 5/6(3) | 4/6(3) | |
| Dermoepidermal separation | 5 mg/kg | 0/6(0) | 0/6(0) | 0/6(0) | 4/6(2) | 4/6(2) | 4/6(2) | 6/6(2) | 6/6(3) | 6/6(2) |
| 10 mg/kg | 0/6(0) | 0/6(0) | 2/6(1) | 4/6(2) | 6/6(2) | 6/6(2) | 6/6(3) | 6/6(2) | 6/6(2) | |
| Re‐epithelialisation | 5 mg/kg | 0/6(0) | 0/6(0) | 0/6(0) | 0/6(0) | 0/6(0) | 0/6(0) | 0/6(0) | 0/6(0) | 5/6(2) |
| 10 mg/kg | 0/6(0) | 0/6(0) | 0/6(0) | 0/6(0) | 0/6(0) | 0/6(0) | 0/6(0) | 0/6(0) | 2/6(2) | |
| Oedema | 5 mg/kg | 0/6(0) | 3/6(2) | 5/6(3) | 5/6(3) | 5/6(2) | 4/6(1) | 4/6(2) | 2/6(1) | 5/6(2) |
| 10 mg/kg | 0/6(0) | 5/6(2) | 5/6(4) | 5/6(4) | 5/6(3) | 4/6(1) | 4/6(2) | 3/6(1) | 5/6(2) | |
| Transmigration of inflammatory cells | 5 mg/kg | 0/6(0) | 4/6(2) | 5/6(3) | 5/6(4) | 5/6(4) | 5/6(4) | 5/6(3) | 5/6(3) | 4/6(2) |
| 10 mg/kg | 0/6(0) | 5/6(2) | 5/6(3) | 5/6(4) | 5/6(4) | 5/6(4) | 5/6(3) | 4/6(2) | 4/6(2) | |
| Proliferation of fibroblast | 5 mg/kg | 0/6(0) | 0/6(0) | 0/6(0) | 0/6(0) | 0/6(0) | 0/6(0) | 0/6(0) | 4/6(2) | 5/6(2) |
| 10 mg/kg | 0/6(0) | 0/6(0) | 0/6(0) | 0/6(0) | 0/6(0) | 0/6(0) | 0/6(0) | 2/6(2) | 3/6(2) | |
| Collagen synthesis | 5 mg/kg | 0/6(0) | 0/6(0) | 0/6(0) | 0/6(0) | 0/6(0) | 0/6(0) | 0/6(0) | 4/6(1) | 5/6(2) |
| 10 mg/kg | 0/6(0) | 0/6(0) | 0/6(0) | 0/6(0) | 0/6(0) | 0/6(0) | 0/6(0) | 2/6(1) | 3/6(2) | |
| Adnexal atrophy | 5 mg/kg | 0/6(0) | 0/6(0) | 0/6(0) | 0/6(0) | 3/6(1) | 3/6(2) | 5/6(3) | 5/6(3) | 5/6(2) |
| 10 mg/kg | 0/6(0) | 0/6(0) | 0/6(0) | 1/6(1) | 4/6(2) | 4/6(3) | 5/6(3) | 5/6(4) | 5/6(3) | |
| Hypertrophy/ hyperplasia of adnexal wall | 5 mg/kg | 0/6(0) | 0/6(0) | 0/6(0) | 2/6(2) | 4/6(2) | 5/6(3) | 5/6(3) | 4/6(3) | 5/6(3) |
| 10 mg/kg | 0/6(0) | 0/6(0) | 0/6(0) | 2/6(2) | 5/6(2) | 3/6(3) | 3/6(3) | 4/6(3) | 4/6(3) | |
| Vascular proliferation (neovascularization) | 5 mg/kg | 0/6(0) | 0/6(0) | 0/6(0) | 0/6(0) | 0/6(0) | 0/6(0) | 0/6(0) | 3/6(1) | 5/6(2) |
| 10 mg/kg | 0/6(0) | 0/6(0) | 0/6(0) | 0/6(0) | 0/6(0) | 0/6(0) | 0/6(0) | 3/6(1) | 5/6(2) | |
Values in cell represents number of animals showing lesions/total number of animals (severity).
Figure 1.
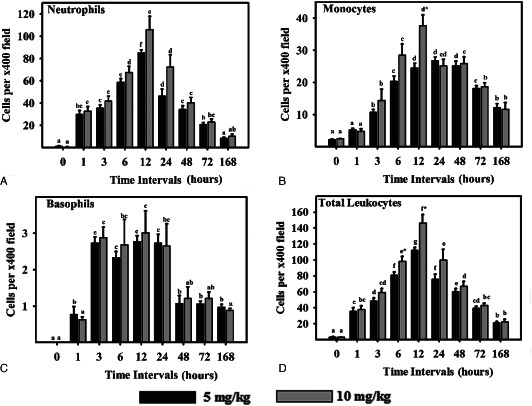
Leukocyte response in sulphur mustard (SM) (5 or 10 mg/kg diluted in acetone) exposed mouse skin at various time intervals. Same alphabets on bars indicate non‐significant (P < 0·05) difference between time intervals at same dose shown with the same colour bar. Asterisks indicate significantly (P < 0·05) higher values in 10 mg/kg as compared to 5 mg/kg at given time intervals and for given parameter (n = 6)
Figure 2.
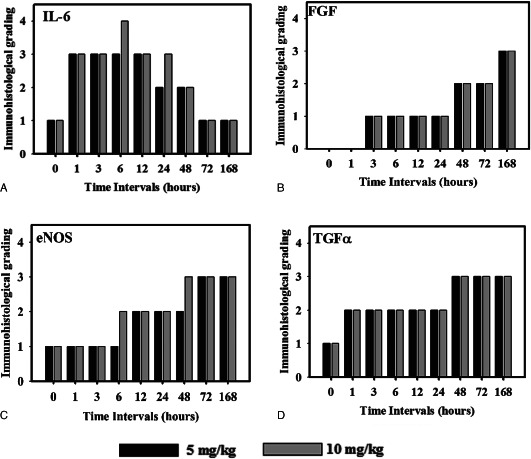
Immunohistological grading of interlukin 6 (IL‐6), fibroblast growth factor (FGF), endothelial nitric oxide synthase (eNOS) and transforming growth factor alpha (TGFα) in sulphur mustard (SM; 5 or 10 mg/kg diluted in acetone) exposed mouse skin at various time intervals. Values in y‐axis represent grading on arbitrary scale [0 (absent);1(1 < area ≤ 10%); 2 (10 <mboxarea≤ 30%); 3 (30 < area ≤ 50%); 4 (50 <mboxarea)] (n = 6).
0 hours
Microscopic observation of untreated control mice skin at 0 hours showed stratified epithelium that was united from dermis with a thin basal lamina without showing any degenerative changes (Table 2; Figure 3). Minimal amount of fibroblasts and collagen was noticed in dermis by Masson trichrome stain. Rare occurrence of neutrophil and monocytoid cells was observed in the interstitium (Figure 1). A few intact mast cells (Figure 4) were present close to the blood vessels and occasional presence of TUNEL positive (Figure 5) cells in the epidermis were also noticed. Expressions of TGF‐α (Figure 6) and IL‐6 were restricted to the epidermis and eNOS (Figure 7) to vascular endothelium of control. There was no FGF immunoreagtivity at this stage (2, 8).
Figure 3.
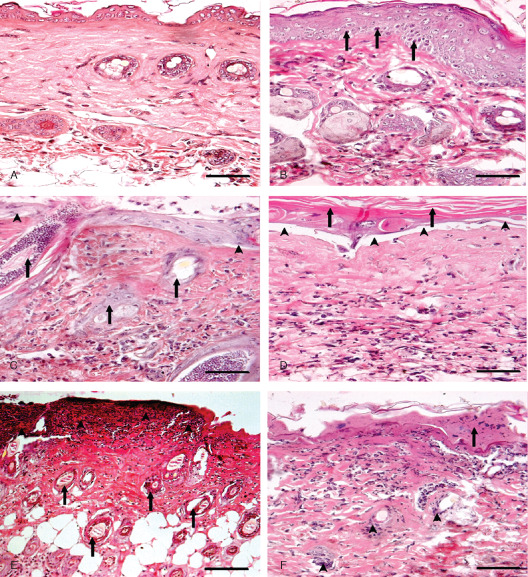
Photomicrograph of sulphur mustard (SM) (10 mg/kg) treated mouse skin sections taken at various time intervals, haematoxylin and eosin (H&E). Bar = 25 µm. (A) 0 hours (control) showing normal arrangement of epidermis, dermis and adnexa. (B) 3 hours showing hyperplasia of epidermal cells, pyknotic nuclei of basal cells (arrow) and oedema of dermis along with mild inflammatory reaction. (C) 6 hours showing coagulative necrosis of epidermis follicular degeneration (arrow), dermoepidermal separation (arrow head) and excessive infiltration of inflammatory cells. (D) 24 hours showing hyperkeratinisation (arrow), necrosis of epidermis, dermoepidermal separation (arrow head) along with transmigrated monocytoid cells and neutrophils. (E) 72 hours showing coagulative necrosis of epidermis extending deep into the dermis, follicular degeneration (arrow) that were roofed by necrosed inflammatory cells entrapped in fibrinous exudates (arrow head). (F) 168 hours showing coagulative necrosis of epidermis and dermis, atrophied adnexa (arrow head) and necrosed inflammatory cells in dermis roofed by eschar tissue (arrow).
Figure 4.
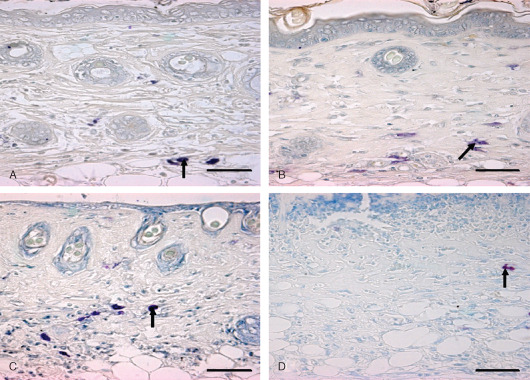
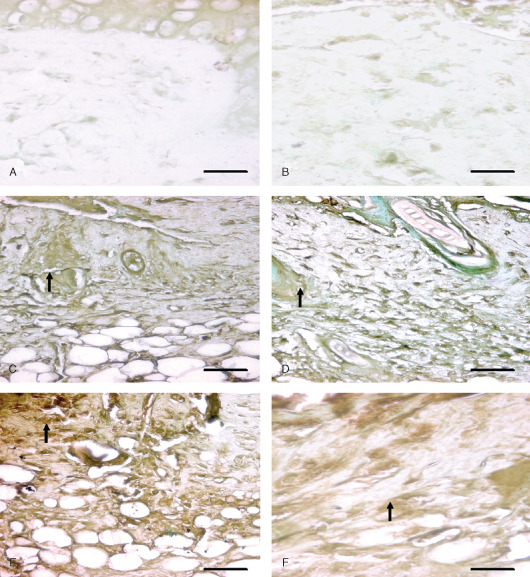
Localization of basophils and mast cells in toluidine blue‐stained skin sections. Bar = 25 µm. (A) 0 hours (control) showing intact mast cells in dermis (arrow). (B) 3 hours showing degranulating mast cells (arrow) in dermis after sulphur mustard (SM) (5 mg/kg) treatment. (C) 03 hours showing degranulating mast cell (arrow) in dermis after SM (10 mg/kg) treatment. (D) 168 hours showing metachromatic regranulating basophils (arrow).
Figure 5.
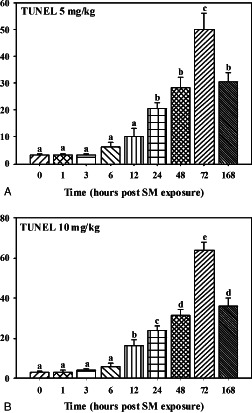
TUNEL positive cells in mice skin sections taken at various time intervals post‐sulphur mustard (SM) (A) 5 mg/kg and (B) 10 mg/kg exposure.
Figure 6.
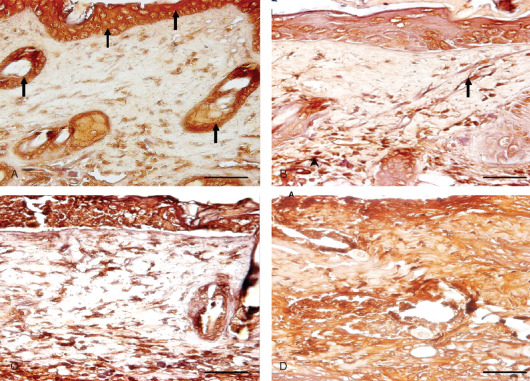
Immunohistological localization of transforming growth factor alpha (TGF‐α) in sulphur mustard (SM) (5 or 10 mg/kg, diluted in acetone) treated mouse skin sections taken at various time intervals. Bar = 25 µm. (A) 0 hours showing marked expression of TGF‐α (arrow) in epidermal cells and hair follicles of mouse skin after SM (5 mg/kg) exposure. (B) 24 hours after SM (5 mg/kg) treatment showing increased immunoreactivity of TGF‐α in dermis by fibroblast cells (arrow) and macrophages (arrowhead) and reduced immunoreactivity in epidermal cells and hair follicles compared to (A). (C) 24 hours (SM 10 mg/kg) showing similar immunoreactivity of TGF‐α in dermis by fibroblast and infiltrating macrophages as shown by mice skin after SM (5 mg/kg) exposure in (B). (D) 168 hours (SM 10 mg/kg) showing marked increase in immunosignals of TGF‐α diffused throughout the dermis compared to (B) and (C).
Figure 7.
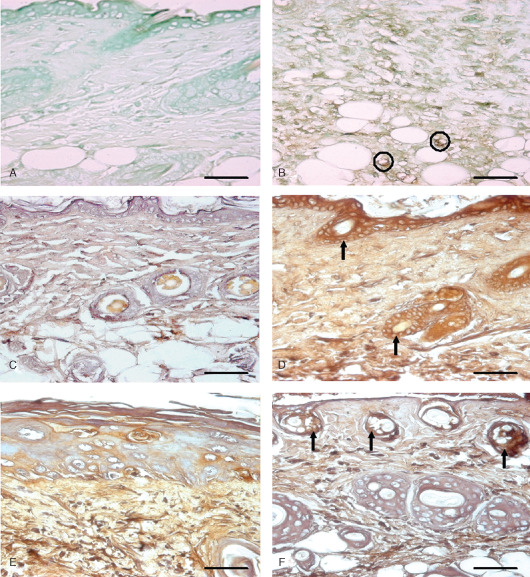
Immunohistological localization of endothelial nitric oxide synthase (eNOS) and interlukin 6 (IL‐6) in sulphur mustard (SM) (5 or 10 mg/kg, diluted in acetone) treated mouse skin sections taken at various time intervals. Bar = 25 µm. (A) Negative control (without eNOS primary antibody). (B) eNOS expression at 72 hours after SM (5 mg/kg) treatment showing immunoreactivity in infiltrated inflammatory cells and blood vessel endothelium (circles). (C) Negative control (without IL‐6 primary antibody). (D) 3 hours after SM (5 mg/kg) treatment showing IL‐6 positive signals by epidermal cells, hair follicle (arrow) and few transmigrated inflammatory cells. (E) 168 hours (SM 5 mg/kg) showing weak IL‐6 immunoreactivity compared to (D). (F) 168 hours (SM 10 mg/kg) showing mild IL‐6 immunosignals in upper part of dermis adnexa only (arrow). Note decrease in intensity as compared to (D).
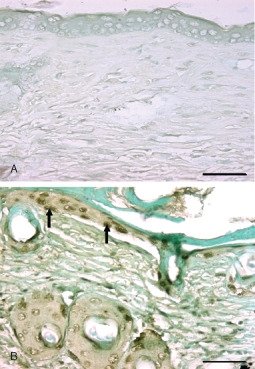
Figure 8.
Immunohistological localization of fibroblast growth factor (FGF) in sulphur mustard (SM) (5 or 10 mg/kg, diluted in acetone) treated mouse skin sections taken at various time intervals. Bar = 25 µm. (A) Negative control (without primary FGF antibody). (B) 0 hours after SM (10 mg/kg) treatment showing similar FGF immunoreactivity as shown by (A). (C) 48 hours after SM (5 mg/kg) exposure showing mild streaks of FGF immunoreactivity (arrow) diffused throughout the dermis. Note increase in immunorectivity of FGF as compared to (B). (D) 48 hours after SM (10 mg/kg) exposure showing mild streaks of FGF immunoreactivity (arrow) similar to (C). (E) 168 hours (SM 5 mg/kg) showing enhanced FGF immunoreactivity (arrow) compared to (C). (F) 168 hours (SM 10 mg/kg) showing moderate FGF (arrow) expression that was more intense than (D) and similar to (E).
1 hour
Oedema of the interstitium, hyperaemia of the blood vessels in dermis along with vacuolation and ballooning of few basal cells and mild acanthotic changes (Figure 9) were noticed in the epidermis (Table 2). Neutrophils showed margination and emigration (Figure 1) in the interstitium after application of SM. Emigration of monocytoid cells and basophils in dermis was occasionally noticed. Some degranulated mast cells were also present. TUNEL index was similar to 0 hours. Epidermal cells and follicular cells of hair follicle showed marked TGF‐α immunoreactivity. Immunoreactivity of FGF (Figure 2) was not observed at this stage. However, moderate to severe immunorectivity of IL‐6 persisted in epidermal cells, hair follicle, infiltrated inflammatory cells and diffused throughout the interstitium.
Figure 9.
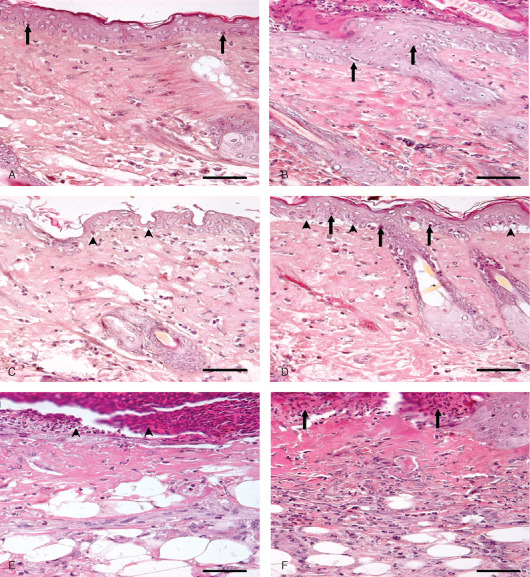
Photomicrograph of sulphur mustard (SM) (5 mg/kg) treated mouse skin sections taken at various time intervals, haematoxylin and eosin (H&E). Bar = 25 µm. (A) 1 hour showing ballooning of epidermal cells, acanthosis in epidermis (arrow), oedema of dermis and a few transmigrated neutrophils. (B) 3 hours showing hyperplasia of epidermal cells (arrow), and oedema of dermis along with mild inflammatory reaction. (C) 6 hours showing ballooning of epidermal cells, dermoepidermal seperation (arrow head) and infiltration of inflammatory cells in dermis. (D) 12 hours showing pyknosis of nuclei in basal cells (arrow), dermoepidermal separation (arrow head), oedema and transmigrated inflammatory cells in dermis. (E) 72 hours showing necrosis of epidermis and dermis and necrosed inflammatory cells entrapped in fibrinous exudates (arrow head) forming the eschar tissue. (F) 168 hours showing eschar tissue (arrow) covering the ulcer, coagulative necrosis of epidermis and dermis with atrophied adnexa and remnants of necrosed transmigrated inflammatory cells in dermis.
3 hours
Marked hyperaemia and extensive oedema was noticed in the dermis. Prevalence of basal cell vacuolation and epidermal hyperplasia/hypertrophy (Figure 9) increased significantly compared to 0 hours (Table 2). In mice applied with high dose (10 mg/kg) of SM, focal lesions showed loss of basal cell contact with the basement membrane with pyknotic nuclei (Figure 3). Infiltration of neutrophils was similar to 1 hour; however, there was a significant increase in the number of monocytoid cells and basophils at both doses of SM (Figure 1). TUNEL index was similar to the 1‐hour stage (Figure 5). Few intact and degranulated mast cells were also observed (Figure 4). Immunoreactivity of TGF‐α in epidermal cells and eNOS and IL‐6 (Figure 7) in interstitium was similar to the 1‐hour stage(Figure 2). However, mild increase in immunoreactivity of TGF‐α and FGF in interstitium was noticed.
6 hours
Oedema and hyperaemia in the dermis was similar to that of the 3‐hour stage. This stage was characterised by moderate epidermal necrosis, vacuolation of basal cells, dermoepidermal separation along with few atrophied hair follicles and sebaceous glands (Table 2; 3, 9). There was a significant increase in number of neutrophils, monocytes and total leukocytes at this stage compared to 3 hours at both the doses (5 or 10 mg/kg) of SM (Figure 1). Monocytoid cells and total leukocytes migrated were significantly higher in mice applied with 10 mg/kg of SM than in mice applied with 5 mg/kg of SM. Number of TUNEL positive cells was similar to the 3‐hour stage. Immunoreactivity of TGF‐α, FGF and IL‐6 was similar to the 3‐hour stage (Figure 2). However, eNOS was expressed in epidermal cells, hair follicle and vascular endothelium. There was a dose‐dependent increase in the expression of eNOS in sections of mice skin applied with 10 mg/kg than with 5 mg/kg of SM.
12 hours
Hyperaemia and oedema was reduced but coagulative necrosis of the epidermis and dermoepidermal separation persisted to the same extent. Necrosis and vacuolation of basal cells along with adnexal atrophy was extensive. Severity of lesions was more pronounced in higher doses (10 mg/kg) of SM than in lower doses (5mg/kg) of SM (Table 2). This stage was characterised by the maximum number of leukocyte infiltration and population was dominated by the neutrophils (Figure 1). Most of the mast cells were in degranulating stage. Total leukocytosis, neutophils and macrophage infiltration were significantly increased in higher doses of SM than in lower doses (Figure 1). There was significant increase in the number of TUNEL positive cells in sections of mice skin applied with 10 mg/kg of SM (Figure 5). Expressions of TGF‐α, FGF and IL‐6 were similar to the 6‐hour stage. However, there was a considerable increase in the expression of eNOS at (5 mg/kg) of SM (Figure 2).
24 hours
Hyperaemia in blood vessels reduced further, however there was only slight reduction in oedema. Severity of epidermal cell necrosis, vacuolation of basal cells and adnexal atrophy showed a time‐ and dose‐dependent increase in the severity (Table 2). This stage was characterised by a decrease in the number of neutrophils, monocytoid cells and total leukocytes (Figure 1) compared to the 12‐hour stage. Number of neutrophil reduced (Figure 1) significantly from 12 hour and most of them were necrosed (Figure 3). However, the population of basophils and mast cells was similar to the 12‐hour stage at both the doses of SM. A significant increase in the number of TUNEL positive cells in sections of mice skin applied with 5 or 10 mg/kg of SM was noticed compared to the 12‐hour stage (Figure 5). Skin sections of mice applied with 5 mg/kg of SM showed similar expressions of TGF‐α and eNOS in interstitium and slight decrease in immunoreactivity of IL‐6 (Figure 2). However, no change was observed in expression of TGF‐α by epidermal cells and FGF, eNOS and IL‐6 (Figure 2) expressions by the interstitium of the skins of mice applied with 10 mg/kg of SM.
48 hours
Minimal hyperaemia and oedema was observed in dermis at this stage. Severity of epidermal and basal cell necrosis along with adnexal atrophy increased compared to the 24‐hour stage. However, no dose‐dependent variation was observed (Table 2). This stage was characterised by a decrease in the number of total leukocytes. There was a decrease in the number of infiltrating leukocytes including neutrophils, monocytiod cells and basophils (Figure 1). An increase in TUNEL positive cells to the greater extent was noticed at higher (10 mg/kg) doses of SM. Considerable decrease in TGF‐α expression and marked increase in FGF (Figure 8) expression in epidermal cells at both the doses were observed (Figure 2). However, there was considerable increase in TGF‐α expression in interstitium at both the doses of SM. The overall TGF‐α immunoreactivity was higher compared to the 12‐hour stage (Figure 2). IL‐6 expression decreased considerably in epidermal cells at both the doses and there was an increase in eNOS expression in interstitium at 10 mg/kg dose (Figure 5). However, no change was observed in TUNEL positive cells and eNOS expression in skin sections from mice applied with 5 mg/kg of SM compared to the 24‐hour stage.
72 hours
Vascular changes were minimal. Severity of epidermal cell necrosis was similar to the 48‐hour stage. However, dose‐ and time‐dependent rise in the severity of basal cells necrosis, dermoepidermal separation and adnexal atrophy was observed (Table 2; 3, 9). This stage was characterised by proliferation of endothelial cells in upper dermis representing the process of angiogenesis/neovascularisation and proliferation of fibroblasts diffused throughout the dermis which appeared large, round or oval in shape, with oval nuclei (Figure 10). There was further reduction in the number of infiltrating leukocytes and mast cells were still showing deregulations. TUNEL positive cells were maximum at this stage (5, 11). An increase in TGF‐α expression in interstitium and a considerable decrease in its expression in epidermal cells at both the doses were observed; however, overall TGF‐α expression was similar to the 48‐hour stage. Expression of eNOS (Figure 7) was significantly increased in interstitium at 5 mg/kg dose (Figure 2). However, there was considerable decrease in IL‐6 in interstitium at both the doses.
Figure 10.
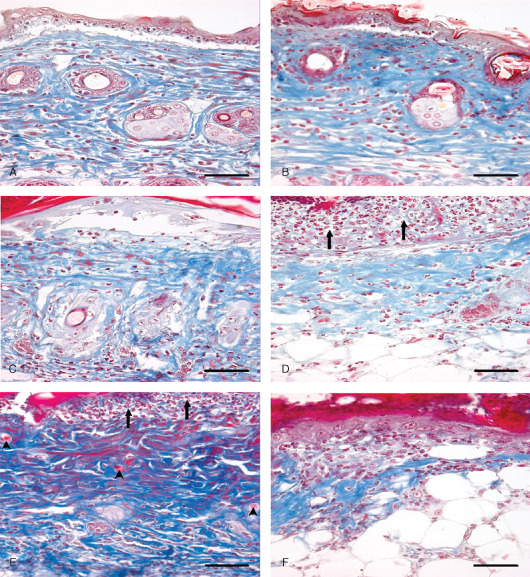
Photomicrograph of sulphur mustard (SM) (5 or 10 mg/kg) treated mouse skin sections taken at various time intervals. Masson trichrome. Bar = 25 µm. (A) 12 hours (SM 5 mg/kg) showing dermoepidermal separation, oedema and blue‐stained sparse arrangement of collagen along with monocytoid cell infiltration. (B) 12 hours (SM 10 mg/kg) showing dermoepidermal separation, necrosis of epidermal cells and oedema. Severity of lesions was more compared to (A). (C) 72 hours (SM 5 mg/kg) showing decreased collagen content compared to the 12‐hour stage. (D) 72 hours (SM 10 mg/kg) showing decreased collagen content compared to the 12‐hour stage and 72 hours of SM (5 mg/kg). Severe epidermal necrosis (arrow) (E) 168 hours (SM 5 mg/kg) showing necrosis of epidermis (arrow), proliferation of fibroblast (deep blue colour) and neoangiogenesis (arrow head). (F) 168 hours (SM 10 mg/kg) showing eschar tissue covering the ulcer, with minimal dermal tissue (blue) atrophied adnexa and transmigrated inflammatory cells.
Figure 11.
Photomicrograph of TUNEL positive cells. Bar = 25 µm. (A) Negative control (without rTdT enzyme). (B) TUNEL positive cells in epidermis of mice skin section (arrow) 72 hours after SM (5 mg/kg) exposure.
168 hours
The vascular changes were not seen. Severity of epidermal and, basal cell necrosis, dermoepidermal separation and adnexal atrophy was similar to the 72‐hour stage (Table 2, 3, 9). At this stage, mild oedema was visible and proliferation of angioblast increased significantly forming sprouts of leaky capillaries (Figure 10) in newly formed dermal tissue. Number of proliferating fibroblasts increased markedly and were mostly parallel to the base of the ulcer. Indication of collagen formation (Figure 10) was evident by homogenous distribution of fibroblast (as depicted by the blue colour of Masson trichrome stain) in dermal tissues. The margin of ulcer revealed proliferation of epidermal epithelium, also outer sheath of hair follicle proliferated over the granulation tissue at this stage (re‐epithelialisation). Leukocytosis was further reduced (Figure 1). A few intact mast cells along with some showing deregulation were also noticed at this stage (Figure 4). Maximum immunoreactivity of FGF (2, 8) was noticed at this stage. Immunoreactivities of TGF‐α (Figure 11), eNOS and IL‐6 (2, 7) were similar to the 72‐hour stage.
Discussion
In this study, we have illustrated a time‐dependent up/down regulation in the expression of IL‐6, eNOS, TGF‐α and FGF, along with DNA damage in SM‐induced skin injury and wound healing process. We had employed a mouse model for studying SM‐induced skin toxicity without causing any systemic toxicity (21).
In the present studies, we describe the development of SM‐induced dermal injury, and initiation of the wound repair process. Inflammatory response in this study was consistent with previous reports in humans and animals showing that SM‐induced skin injury is associated with leukocyte transmigration in the skin 23, 24, 25, 26. The inflammatory response persisted for 3 days followed by tissue repair including neovascularisation, fibroplasias, epidermal hyperplasia and neoepidermis migrating from the wound edge depicting close contact from basement membrane. We observed degenerative changes in basal cells of epidermis leading to dermoepidermal separation followed by necrosis of the epidermis extending to dermis and its constituents. These changes are in agreement with Vogt et al.(27) and in the absence of actual blister formation, basal cell damage resembles the histopathological signs observed with vesication in human skin (28). A C57BL/6 black mouse dorsal model of cutaneous vesicant injury (11) is best suitable to support our study, but studies with CEES must be viewed with caution for evaluating drugs against SM (19). Thus, overcoming the limitation of other animal models as described earlier our model is best‐suited model for evaluating therapeutics for SM‐induced skin injury.
Mast cells are key players in the inflammatory process (29). They secrete histamine, protease, chemotactic factors, cytokines and lipid mediators (30), which may be investigated as future therapeutic targets in SM‐induced skin toxicity. In the present study, degranulation of mast cells was observed in early stages and later few of them were found intact lying near the cutaneous blood vessels. According to Skidgel et al.(31), tissues that contains histamine are capable of synthesising it from histidine. Thus, in the present case, it may be possible that with time, resynthesis of granules occurred, which in turn, contributed to the presence of regranulated or intact mast cells at later stage of SM‐induced inflammatory and reparative stages in mice skin. In contrast to our findings, Joseph et al.(23) have reported that >40% mast cells were completely degranulated within 1–3 days and their degranulation persisted in later hours also in SM‐induced skin injury in SKH 1‐hr mice. This contrasting result needs further exploration. However, it can be envisaged that difference in animal species or method used for SM exposure might have resulted in disparity. Transmigrated basophils did not play any role in healing injuries after SM exposure as supported by Kumar et al.(32) in mammals and humans.
Alkylation and crosslinking of intracellular DNA with SM, leading to DNA damage is well documented 3, 12. SM‐induced DNA damage results in PARP activation with marked depletion of cellular NAD+ and ATP levels, which in consequence results in necrotic cell death (4). Mild PARP activation does not disturb cellular energy levels and allows apoptotic cell death or recovery to occur (4). Prelethal cell death reaction has been categorised into oncosis and apoptosis (33). We observed both oncotic (cellular swelling) and apoptotic (cellular shrinkage and nuclear condensation) type of prelethal cell injury in SM‐exposed skin section, demonstrating a dose and time‐dependent increase in DNA damage depicted by deoxyribonucleotidyl transferase (TDT)‐mediated dUTP‐digoxigenin nick‐end labelling (TUNEL) assay 12, 23.
IL‐6 has been recognised as a way for inflammatory cell recruitment and for its activation at the site of SM‐induced skin injury (34). Our results showed time‐ and dose‐dependent increased expression of IL‐6 in early stages followed by a decrease in later stages in the mouse skin, after SM exposure that are consistent with the findings in mouse ear (35), weanling pigskin (9) and hairless mouse skin (18) and showed close association with tissue leukocytosis in this study.
Several in vitro and in vivo studies have suggested the role of inducable nitric oxide synthase (iNOS) induced NO synthesis, which is mainly produced by neutrophils and leukocytes 29, 36, 37. However, literature describing the role of eNOS in SM‐induced in vivo cytotoxicity is lacking. We have observed a time‐dependent expression of eNOS in endothelial cells of newly formed blood vessels and in granulation tissue during healing process of SM‐induced skin injury, supporting the eNOS‐induced NO synthesis. SM causes decoupling of NOS function and depletion of eNOS cofactor tetrahydrobiopterene (BH4). This in turn produces more of ROS instead of reactive nitrogen species in early stages of injury and limits the expression of eNOS (38). However, expression of eNOS later in repair phase may be correlated with BH4 supplementation by proliferating healing tissue and healthy tissue from the margin of the skin lesions. Confirmation of this statement needs additional experimentation and is beyond the scope of this study. Furthermore, angiogenesis involves complex sequential steps such as degradation of basement membrane by proteases, proliferation and migration/invasion of endothelial cell, formation of capillary tubes and survival of newly formed blood vessels (39). NO is a prerequisite for the endothelial cell to enter into angiogenic cascade and increased NO production correlates positively with increased vascular density (40). NO promotes angiogenesis, migration and proliferation of fibroblasts, epithelial cells, endothelial cells, and keratinocytes during the wound healing process (32). This suggests that eNOS may play pivotal roles in all the events relating to wound healing, and the time‐dependent expressions of eNOS may be used possibly as a new marker for the age determination and in evaluating angiogenic activity for pharmaceutical screening of drugs against SM‐induced skin lesions.
Growth factors play a multitudinous role in wound repair process. Inflammatory stimuli triggers p38 MAP kinase which results in the release of TGF‐α family ligands and activates the epidermal growth factor (EGF) receptor signalling, leading to enhanced keratinocyte proliferation, mitogenic to fibroblast proliferation and granulation tissue formation 32, 41. On the other hand, depletion of p38a MAP kinase activity suppresses EGF receptor signalling and downstream Erk MAP kinase signalling, as well as autocrine EGF‐decreased proliferation. Results of our study are in agreement with the above findings and showed a time‐dependent correlation between proliferations of basal cells and TGF‐α expressions by epidermal cells along with granulation tissue formation in SM‐induced skin injury in mice.
Fibroblasts and neovascularization strengthen the wound by increasing collagen and mucopolysaccharide production in the proliferative phase of the wound healing (42). bFGF modulates fibroblast proliferation, its migration into damaged tissue, stimulates angiogenesis and affects cell differentiation (43). We observed a time‐dependent increase in bFGF expression, showing a significant correlation with fibroblast proliferation and tissue collagen synthesis in SM‐exposed mice skin. Since literature regarding role of TGF‐α and bFGF in animal models of SM‐induced skin injury is deficient, further studies are required to elaborate our first‐in‐line report about the mechanism of action and to declare them as a possible marker in healing process.
In summary, the present study provided a deep insight into the understanding of pathogenesis of SM‐induced skin injury. Histopathological changes in skin after SM injury were similar to other mammalian species and basal cell damage resembles the histopathological signs observed with vesication in human skin. We also established a link between the biological markers like TGF‐α, eNOS, IL‐6 and bFGF to the pathogenesis of SM‐induced skin lesions. Thus, this study provides a single, efficient and reproducible mouse model that can be further utilised for screening the efficacy of prophylactic and therapeutic compounds for SM‐induced skin injury.
Acknowledgements
Authors are thankful to Dr SJS Flora, Head Pharmacology and Toxicology Division, and Dr Abhishek Yadav for their editorial suggestions. We are also thankful to Dr K Ganesan for the synthesis and analysis of the purity of sulphur mustard.
References
- 1. Saladi RN, Smith E, Persaud AN. Mustard: a potential agent of chemical warfare and terrorism. Clin Exp Dermatol 2006;31:1–5. [DOI] [PubMed] [Google Scholar]
- 2. Smith KJ, Smith WJ, Hamilton T, Skelton HG, Graham JS, Okerberg C, Moeller R, Hackley BE Jr. Histopathologic and immunohistochemical features in human skin after exposure to nitrogen and sulfur mustard. Am J Dermatopathol 1998;20:22–8. [DOI] [PubMed] [Google Scholar]
- 3. Kehe K, Balszuweit F, Steinritz D, Thiermann H. Molecular toxicology of sulphur mustard‐induced cutaneous inflammation and blistering. Toxicology 2009;263:12–9. [DOI] [PubMed] [Google Scholar]
- 4. Debiak M, Kehe K, Bürkle A. Role of poly(ADP‐ribose) polymerase in sulfur mustard toxicity. Toxicology 2009;263:20–5. [DOI] [PubMed] [Google Scholar]
- 5. Kehe K, Raithel K, Kreppel H, Jochum M, Worek F, Thiermann H. Inhibition of poly (ADP‐ribose) polymerase (PARP) influences the mode of sulfur mustard (SM)‐induced cell death in HaCaT cells. Arch Toxicol 2007;82:461–70. [DOI] [PubMed] [Google Scholar]
- 6. Steinritz D, Emmler J, Hintz M, Worek F, Kreppel H, Szinicz L, Kehe K. Apoptosis in sulfur mustard treated A549 cell cultures. Life Sci 2006;80:2199–201. [DOI] [PubMed] [Google Scholar]
- 7. Kumar O, Sugendran K, Vijayaraghavan R. Protective effect of various antioxidants on the toxicily of sulphur mustard administered to mice by inhalation or percutaneous routes. Chem Biol Interact 2001;134:1–12. [DOI] [PubMed] [Google Scholar]
- 8. Papirmeister B, Feister AF, Robinson SI, Ford RD. Medical defense against mustard gas: toxic mechanisms and pharmacological implications. Boca Raton: CRC Press, 1991. [Google Scholar]
- 9. Sabourin CLK, Danne MM, Buxton KL, Casillas RP, Schlager JJ. Cytokine, chemokine, and matrix metalloproteinase response after sulfur mustard injury to weanling pig skin. J Biochem Mol Toxicol 2002;16:263–72. [DOI] [PubMed] [Google Scholar]
- 10. Arroyo CM, Schafer RJ, Kurt EM, Broomfield CA, Carmichael AJ. Response of normal human keratinocytes to sulfur mustard: cytokine release. J Appl Toxicol 2000;20:S63–72. [DOI] [PubMed] [Google Scholar]
- 11. Isidore MA, Castagna MP, Steele KE, Gordon RK, Nambiar MP. A dorsal model for cutaneous vesicant injury by 2‐chloroethyl ethyl sulfide using C57BL/6 mice. Cutan Ocul Toxicol 2007;26:265–76. [DOI] [PubMed] [Google Scholar]
- 12. Paromov V, Suntres Z, Smith M, Stone WL. Sulfur mustard toxicity following dermal exposure: role of oxidative stress, and antioxidant therapy. J Burns Wounds 2007;7:e7. [PMC free article] [PubMed] [Google Scholar]
- 13. Brodsky B, Trivedi S, Peddada S, Flagler N, Wormser U, Nyska A. Early effects of iodine on DNA synthesis in sulfur mustard‐induced skin lesions. Arch Toxicol 2006;80:212–6. [DOI] [PubMed] [Google Scholar]
- 14. Gross CL, Nealley EW, Nipwoda MT, Smith WJ. Pretreatment of human epidermal keratinocytes with D,L‐sulforaphane protects against sulfur mustard cytotoxicity. Cutan Ocul Toxicol 2006;25: 155–63. [DOI] [PubMed] [Google Scholar]
- 15. Blaha M, Bowers WJ, Kohl J, DuBose D, Walker J. Il‐1‐related cytokine responses of nonimmune skin cells subjected to CEES exposure with and without potential vesicant antagonists. Vitro Mol Toxicol 2000;13:99–111. [DOI] [PubMed] [Google Scholar]
- 16. Zarach JM, Beaudoin GM 3rd, Coulombe PA, Thompson CC. The co‐repressor hairless has a role in epithelial cell differentiation in the skin. Development 2004;131:4189–200. [DOI] [PubMed] [Google Scholar]
- 17. Smith KJ, Graham JS, Moeller RB, Okerberg CV, Skelton H, Hurst CG. Histopathologic features seen in sulfur mustard induced cutaneous lesions in hairless guinea pigs. J Cutan Pathol 1995;22: 260–8. [DOI] [PubMed] [Google Scholar]
- 18. Ricketts KM, Santai CT, France JA, Graziosi AM, Doyel TD, Gazaway MY. Inflammatory cytokine response in sulphur mustard exposed mouse skin. J Appl Toxicol 2000;20:S73–6. [DOI] [PubMed] [Google Scholar]
- 19. Gould NS, White CW, Day BJ. A role for mitochondrial oxidative stress in sulfur mustard analog 2‐chloroethyl ethyl sulfide‐induced lung cell injury and antioxidant protection. J Pharmacol Expt Ther 2009;328:732–9. [DOI] [PMC free article] [PubMed] [Google Scholar]
- 20. Gautam A, Vijayaraghavan R, Sharma M, Ganesan K. Comparative toxicity studies of sulfur mustard (2,2_‐dichloro diethyl sulfide) and monofunctional sulfur mustard (2‐chloroethyl ethyl sulfide), administered through various routes in mice. J Med CBR Def 2006;4:1–21. [Google Scholar]
- 21. Lomash V, Deb U, Rai R, Jadhav SE, Vijayaraghavan R, Pant SC. Designing of mice model: a new approach for studying SM‐induced skin lesions. Burns 2011;37:851–64. [DOI] [PubMed] [Google Scholar]
- 22. Lomash V, Parihar SK, Jain NK, Katiyar AK. Effect of solanum nigrum and ricinus communis extracts on histamine and carrageenan‐induced inflammation in the chicken skin. Cell Mol Biol 2010;56: OL1239–51 [doi:10.1170/141]. [PubMed] [Google Scholar]
- 23. Joseph LB, Gerecke DR, Heck DE, Black AT, Sinko PJ, Cervelli JA, Casillas RP, Babin MC, Laskin DL, Laskin JD. Structural changes in the skin of hairless mice following exposure to sulfur mustard correlate with inflammation and DNA damage. Expt Mol Path 2011;91:515–27. [DOI] [PMC free article] [PubMed] [Google Scholar]
- 24. Benson JM, Seagrave J, Weber WM, Santistevan CD, Grotendorst GR, Schultz GS, March TH. Time course of lesion development in the hairless guinea‐pig model of sulfur mustard‐induced dermal injury. Wound Repair Regen 2011;19:348–57. [DOI] [PMC free article] [PubMed] [Google Scholar]
- 25. Dachir S, Cohen M, Fishbeine E, Sahar R, Brandies R, Horwitz V, Kadar T. Characterization of acute and long‐term sulfur mustard‐induced skin injuries in hairless guinea‐pigs using non‐invasive methods. Skin Res Technol 2010;16:114–24. [DOI] [PubMed] [Google Scholar]
- 26. Tewari‐Singh N, Rana S, Gu M, Pal A, Orlicky DJ, White CW, Agarwal R. Inflammatory biomarkers of sulphur mustard analog 2‐chloro ethyl sulphide‐induced skin injury in SKH‐1 hairless mice. Toxicol Sci 2009;108:194–206. [DOI] [PMC free article] [PubMed] [Google Scholar]
- 27. Vogt RF, Dannenberg AM, Schofield BH, Hynes NA, Papirmeister B. Pathogenesis of skin lesions caused by sulfur mustard. Fundam Appl Toxicol 1984;4:S71–83. [DOI] [PubMed] [Google Scholar]
- 28. Papirmeister B, Gross CL, Petrali JB, Hixson CJ. Pathology produced by sulphur mustard in human skin graft on athymic mice: ultrastructural changes. Cutan Ocul Toxicol 1984;3:393–408. [Google Scholar]
- 29. Jain AK, Tewari‐Singh N, Gu M, Inturi S, White CW, Agarwal R. Sulfur mustard analog, 2‐chloroethyl ethyl sulfide‐induced skin injury involves DNA damage and induction of inflammatory mediators, in part via oxidative stress, in SKH‐1 hairless mouse skin. Toxicol Lett 2011;205:293–301. [DOI] [PMC free article] [PubMed] [Google Scholar]
- 30. Shiota N, Nishikori Y, Kakizoe E, Shimoura K, Niibayashi T, Shimbori C, Tanaka T, Okunishi H. Pathophysiological role of skin mast cells in wound healing after scald injury: study with mast cell‐deficient W/W(V) mice. Int Arch Allergy Immunol 2010;151: 80–8. [DOI] [PubMed] [Google Scholar]
- 31. Skidgel RA, Kaplan AP, Erdos EG. Histamine, bradykinin, 5 hydroxytrytamine and their antagonist. In: Brunton LL, Chabner BA, Knollmann BC, editors. Goodman and Gillmans the pharmacological basis of therapeutics. New York: McGraw Hill Medical Publishing Company, 2011:911–36. [Google Scholar]
- 32. Kumar V, Abbas AK, Fausto N, Aster JC. Tissue renewal, repair and regeneration. In: Robbins and Cotran, editors. Pathologic basis of disease. Philadelphia: Saunders (Elsevier), 2010:79–110. [Google Scholar]
- 33. Trump BE, Berezesky IK, Chang SH, Phelps PC. The pathways of cell death: oncosis, apoptosis, and necrosis. Toxicol Pathol 1997;27:82–8. [DOI] [PubMed] [Google Scholar]
- 34. Shakarjian MP, Heck DE, Gray JP, Sinko PJ, Gordon MK, Casillas RP, Heindel ND, Gerecke DR, Laskin DL, Laskink JD. Mechanisms mediating the vesicant actions of sulfur mustard after cutaneous exposure. Toxicol Sci 2010;114:5–19. [DOI] [PMC free article] [PubMed] [Google Scholar]
- 35. Wormser U, Brodsky B, Proscura E, Foley JF, Jones T, Nyska A. Involvement of tumor necrosis factor alpha in sulphur mustard induced skin lesions; effect of topical iodine. Arch Toxicol 2005;79:660–70. [DOI] [PubMed] [Google Scholar]
- 36. Ishida H, Ray R, Ray P. Sulfur mustard downregulates iNOS expression to inhibit wound healing in a human keratinocyte model. J Dermatol Sci 2008;49:207–16. [DOI] [PubMed] [Google Scholar]
- 37. Gao X, Ray R, Xiao Y, Barker PE, Ray P. Inhibition of sulfur mustard‐induced cytotoxicity and inflammation by the macrolide antibiotic roxithromycin in human respiratory epithelial cells. BMC Cell Biol 2007;8:17. [DOI] [PMC free article] [PubMed] [Google Scholar]
- 38. Steinritz D, Elischer A, Balszuweit F, Gonder S, Heinrich A, Bloch W, Thierman H, Kehe K. Sulphur mustard induces time‐ and concentration‐dependent regulation of NO‐synthesizing enzymes. Toxicol Lett 2009;188:263–9. [DOI] [PubMed] [Google Scholar]
- 39. Bussolino F, Mantovani A, Persico G. Molecular mechanisms of blood vessel formation. Trends Biochem Sci 1997;22:251–6. [DOI] [PubMed] [Google Scholar]
- 40. Fukumura D, Gohongi T, Kadambi A, Izumi Y, Ang J, Yun CO, Buerk DG, Huang PL, Jain RK. Predominant role of endothelial nitric oxide synthase in vascular endothelial growth factor‐induced angiogenesis and vascular permeability. Proc Nat Acad Sci USA 2001;98:2604–9. [DOI] [PMC free article] [PubMed] [Google Scholar]
- 41. Xu P, Derynck R. Direct activation of TACE‐mediated ectodomain shedding by p38 MAP kinase regulates EGF receptor‐dependent cell proliferation. Mol Cell 2001;37:551–66. [DOI] [PMC free article] [PubMed] [Google Scholar]
- 42. Canbay E, Agachan B, Ozturk T, Giris M, Asoglu O, Balik E, Bugra D. Dual inhibition of wound healing and oxidative process by montelukast in experimental colon. Surg Innov 2010;17:248. [DOI] [PubMed] [Google Scholar]
- 43. Schreml S, Szeimies RM, Prantl L, Landthaler M, Babilas P. Wound healing in the 21st century. J Am Acad Dermatol 2010;63: 866–81. [DOI] [PubMed] [Google Scholar]