

Abstract
Leg ulcer management is complex, time‐consuming and of high socio‐economic importance. Data on cost‐of‐illness in leg ulcer care are sparse. The objective of this study was to evaluate the cost‐of‐illness in leg ulcer treatment in the metropolitan area of Hamburg. About 147 institutions involved in wound care participated in a cross‐sectional study. Patients consecutively recruited underwent a standardised interview and clinical examination. Main economic outcomes were direct, indirect and intangible costs from a societal perspective. Five hundred and two patients with a mean age of 71 years and mean wound duration of 9 years were enrolled. Annual total costs summed up to a mean of 9060€ /patient/year (8288€ direct, 772€ indirect costs). Direct costs carried by statutory health insurances amounted to 7680€ , patients themselves paid on average 607€. Leg ulcer is associated with high costs for health insurances, patients and the society. Exploratory predictor analyses suggest that early, interprofessional disease‐management could lower treatment costs.
Keywords: Chronic wounds; Cost‐of‐illness; Health care wounds; Leg ulcers
Introduction
Leg ulcers are frequent chronic wounds with manifold causes and great medical impact 1, 2.
Data on treatment cost for leg ulcers are inconsistent and vary largely depending on disease, health system and evaluation method. More precisely, reported annual costs of leg ulcers range from 4000 to 30 000€ per patient 3, 4, 5, 6, 7, 8. A recent study performed in specialised German wound centres showed that the overall costs of venous leg ulcers summarise about 10 000€. Major cost drivers were hospitalisation, nursing costs and dressing material (9).
In Western countries, the costs of venous ulcer treatment represented about 2·5% of the total health budget (10). Besides their financial implications, chronic wounds have considerable impacts on the patients' health‐related quality of life (HrQoL) and patients suffer for many years from discomfort of the wound because of pain, lack of sleep, immobility and social isolation 11, 12, 13, 14.
Although chronic wounds have considerable socioeconomic impact, robust and valid cost data referring financial outcomes to the quality of care are scarce. The lack of evidence impedes health care decision‐making and improvement in resource allocation and optimisation of the cost‐benefit ratio. This study was conducted to reduce this gap by evaluating the most relevant three areas of leg ulcer treatment: the impact of leg ulcers on health‐related quality of life, the quality of leg ulcer care and the direct and indirect costs of leg ulcer. For this, an analysis of the cost distribution for society, the health insurances and the patients was performed. This article presents the results for cost‐of‐illness, the results on quality of care are published elsewhere 15, 16.
Methods
Study design
This cross‐sectional, non‐interventional and non‐selective observational study was conducted in the metropolitan area of Hamburg, Germany. The cost‐of‐illness data were assessed from the societal perspective, including direct, indirect and intangible costs.
Patients and centres
In order to achieve a community‐based patient sample as representative as possible, more than 1200 health care providers of all sectors in the Hamburg area were contacted through mail and asked for participation. These included office‐based practices, wound clinics, home care services, nursing homes and other social facilities (e.g. special institutions for the homeless and drug users). The participating centres were asked to identify eligible patients from the patient records who have recently been in treatment.
Adult patients with a leg ulcer of any origin persisting without a tendency of healing for at least a month were included. All patients had to sign the informed consent form before screening for eligibility. The study was conducted in compliance with the legal requirements for data protection, and a vote from the local ethics committee was obtained.
Outcomes
Study data were recorded by standardised questionnaires, structured interviews and clinical examination. The documentation was performed by postgraduate medical students specially trained in wound care and in the methodology of the survey.
Physical examination comprised of a general exam and the assessment of wound size and wound status using the TIME Scheme (17). Moreover, every wound was documented by digital photography.
Economic outcomes for the cost‐of‐illness analysis were recorded in a specific questionnaire, which has already been used in previous studies (9). This included the documentation of resource usage as well as the recording of direct expenses in the past 4 weeks and in the last year, respectively. In particular, the frequency of consultations and care visits, diagnostic procedures, and hospital treatment (frequency and duration), use of wound material and drugs were evaluated. In addition, out‐of‐pocket expenses (dressing material etc.), prescription charges and copayments were documented.
The patient questionnaires included items on disease history, housing situation, resource consumption (e.g. time required, nursing service, care and treatment satisfaction), satisfaction with care and treatment. Satisfaction with treatment and satisfaction with wound care from the patient perspective were measured by a single 5‐point Likert scaled item ranging from 1 (very satisfied) to 5 (not satisfied at all), respectively. Furthermore, health‐related quality of life (HrQoL) was measured using the FLQA‐wk 18, 19. The FLQA‐wk consists of a total of 23 items covering six dimensions: ‘physical complaints', ‘everyday life’, ‘social life’, ‘mental well‐being’, ‘therapy’ and ‘satisfaction’. The total and subscale scores are means of the respective items and range between 1 and 5, the latter signifying the highest impairment in HrQoL. The impact of leg ulcer on HrQoL served as a proxy for the intangible costs of illness.
Quality of care was additionally measured by a single ‘health care index’ computed from wound‐specific quality indicators. These had been empirically selected and then formally consented in a Delphi consensus process. The quality‐of‐care index was defined as the percentage of indicator criteria met (0= no criteria met to 100= all criteria met) (16).
Calculation of costs
About 90% of Germans are members of the statutory health insurances (SHI) and about 10% are health‐insured on a private basis. In this publication, the SHI‐perspective was chosen as the payer perspective. Hospital costs in Germany are based on Diagnosis Related Groups (DRGs), which constitute from major diagnoses and procedures. In contrast, costs for ambulant care are based on honorary tables for physicians, home care services and other professions.
Annual direct and indirect costs were estimated in a bottom‐up procedure based on information given on resource consumption in the interview and in the standardised questionnaire.
Direct costs included all expenses for the health insurance (and for the patients) directly related to leg ulcer treatment and care. Indirect costs constitute consecutive costs for the economy (mediated by the disease and treatment, like productivity loss). Intangible costs are valued consequences of the illness and treatment that are usually not expressed in money (e.g. HrQoL, patient disease burden).
Costs were assessed in accordance to the valid fares in 2006 for the statutory health insurance in Germany. Costs for drugs and material contained value added tax (VAT). Outpatient costs were determined by application of Codes from the ‘Einheitlicher Bewertungsmaßstab für ärztliche Leistungen, EBM 2006’, which is a unified standard of evaluation for goods and services in medicine. Different physician fees were applied according to EBM for general practitioners (GP), dermatologists and surgeons taking into account the budgeting limits established in 2006, which led to capped fees. Inpatient costs were assessed by assignment of appropriate G‐DRG‐Codes (German Diagnosis Related Groups). The DRG costs including the base rate calculation refer to the average price of hospital procedures in the Hamburg area. The costs for nursing services were based on the SHI fees in Hamburg.
The costs for different wound dressing material (hydrocolloids, alginates etc.), each in three different sizes (for small, middle and large wound areas), were derived by price‐mixes of the products of four of the most common manufacturers. The prices were requested from five randomly chosen pharmacies in Hamburg.
Cost of drugs directly related to leg ulcer treatment were estimated by price‐mixes for each drug class (antibiotics, analgetics, anticoagulants etc.), prices were extracted from the ‘Rote Liste’ 2006 (German Drug List) ‘Arzneiverordnungsreport’(20). As some wound dressings used are not reimbursed in Germany, these costs were assigned to the patients' out‐of‐pocket costs.
The indirect costs due to wound dressing of non‐profes‐ sionals (e.g. patients, family members) were estimated from tables of productivity cost for blue collar workers in 2006 from the Federal Statistical Office. As only a few patients of the cohort were still working, a calculation of productivity loss from days of work was not considered.
Other costs were requested from pharmacies, therapists and medical stores or taken from tabulations of taxes. Table 1 gives an overview of the derivation of costs from prices, units and the methods of cost computation.
Table 1.
Overview of the derivation of costs from prices, units and the methods of cost computation
| Domain | Item | Price in Euro | Unit | Payer | Comment |
|---|---|---|---|---|---|
| Topical treatment | Topical oinments | 4·91/11·86/15·28 | per day | SHI | Arzneiverordnungs report, price mix |
| Skin protection | 0·83/1·89/3·36 | per day | SHI | Arzneiverordnungs report, price mix | |
| Antibiotic oinments | 0·75/3·78/7·56 | per day | SHI | Arzneiverordnungs report, price mix | |
| Other | 0·83/1·89/3·36 | per day | SHI | Arzneiverordnungs report, price mix | |
| Topical anaesthetic ointment (e.g. EMLA)®; | 7·62/7·62/15·24 | per day | PAT | Requested from pharmacies, price mix | |
| Wound dressings | Dry | 0·12/0·23/0·7 | per day | SHI | Requested from pharmacies, price mix for small/medium/large wounds |
| Wet | 0·44/1·73/3·49 | per day | SHI | Requested from pharmacies, price mix for small/medium/large wounds | |
| Gauze | 1·69/3·02/9·78 | per day | SHI | Requested from pharmacies, price mix for small/medium/large wounds | |
| Alginates | 2·29/8·38/11·03 | per day | SHI | Requested from pharmacies, price mix for small/medium/large wounds | |
| Films | 2·81/2·78/9·03 | per day | SHI | Requested from pharmacies, price mix for small/medium/large wounds | |
| Hydrogel | 6·85/6·85/10·33 | per day | SHI | Requested from pharmacies, price mix for small/medium/large wounds | |
| Hydrocolloids | 3·34/6·33/20·37 | per day | SHI | Requested from pharmacies, price mix for small/medium/large wounds | |
| Antiseptics | 1·18/4·71/9·42 | per day | PAT | Requested from pharmacies, price mix for small/medium/large wounds | |
| Foams | 5·51/9·76/27·51 | per day | SHI | Requested from pharmacies, price mix for small/medium/large wounds | |
| Further material required for dressing procedure (e.g. gloves) | 1·00 | per day | SHI | Price mix, constant for all wound sizes | |
| Systemic treatment | Antibiotics | 3·81 | per day | SHI | Arzneiverordnungs report, price mix, only 1 month/ year |
| Analgetics | 2·51 | per day | SHI | Arzneiverordnungs report, price mix | |
| Anticoagulants | 1·32 | per day | SHI | Arzneiverordnungs report, price mix | |
| Immunsuppressants | 4·9 | per day | SHI | Arzneiverordnungs report, price mix | |
| Psychotropics | 1·2 | per day | SHI | Arzneiverordnungs report, price mix | |
| Diagnostics | Ultrasonography | 18·88 | each | SHI | EBM |
| Angiography | 182·75 | each | SHI | EBM | |
| Phlebography | 45·26 | per leg | SHI | EBM | |
| Biopsy | 28·54 | each | SHI | EBM | |
| Swabs | 3·51 | each | SHI | EBM | |
| Allergy tests | 75·51 | each | SHI | EBM | |
| Compression stockings | Lower leg | 92·5 | per 6 months | SHI | Requested from stores |
| Upper leg | 117·5 | per 6 months | SHI | Requested from stores | |
| Pelvis | 150 | per 6 months | SHI | Requested from stores | |
| Outpatient fees | Physiotherapist | 33·12 | per month | SHI | Requested from therapists |
| Therapist of lymphatology | 42·8 | per month | SHI | Requested from therapists | |
| Nurse | 14·56 | per dressing | SHI | Requested from nursing services | |
| Practitioner | 45 | for 3 months | SHI | EBM, capped | |
| Consultant | 45 | for 3 months | SHI | EBM, capped | |
| Specialised outpatient clinic | 21·36 | per month | SHI | Requested from hospitals | |
| Hospital costs | Arterial surgery | 6733·8 | each | SHI | G‐DRG, case‐mix |
| Vein surgery | 2972·5 | each | SHI | G‐DRG, case‐mix | |
| Meshgraft transplantation | 7611·05 | each | SHI | G‐DRG, case‐mix | |
| Hospitalisation | 5138·8 | each | SHI | G‐DRG, case‐mix | |
| Conservative therapy and VAC | 3458·15 | each | SHI | G‐DRG, case‐mix | |
| Transportation | Bus | 3·1 | per visit< 5 km | PAT | Requested from transport organisation |
| Bus | 4·9 | per visit> 5 km | PAT | Requested from transport organisation | |
| Car | 0·15 | per kilometer | PAT | Allowable against income tax | |
| Cab | PAT | As reported | |||
| Virtual costs | Non‐professional dressing change | 30·35 | per hour | – | Official productivity costs |
| Copayments | PAT | As reported | |||
| Other remedies | PAT | As reported |
SHI, statutory health insurances; G‐DRG, German diagnosis related groups; VAC, vacuum‐assisted closure therapy; PAT, patient.
The single costs were summarised to cost groups and to total costs (Table 2). Additionally, costs for the statutory health insurance and the patients as well as direct, indirect and intangible costs were differentiated.
Table 2.
Assignment of cost items to cost domains
| Domain | SHI | Patient |
|---|---|---|
| Total drug expenses | Antibiotic oinments | Topical treatment PAT |
| Systemic medication | ||
| Non‐drug treatment costs | Diagnostics | Other remedies |
| Compression therapy | Transportation | |
| Wound dressings | ||
| Local oinments | ||
| Other topical treatment | ||
| Material required for dressing procedure (e.g. gloves) | ||
| Total treatment costs | Total drug expenses SHI | Total drug expenses PAT |
| Non‐drug treatment costs SHI | Non‐drug treatment expenses PAT | |
| Outpatient fees | ||
| Total costs | Total treatment costs SHI | Total treatment costs PAT |
| Copayments | ||
| Hospital costs | ||
| Direct costs | Total costs SHI + total costs PAT | |
| Indirect costs | Non‐professional dressing costs | |
| Intangible costs | HrQoL |
HrQoL, health‐related quality of life; SHI, statutory health insurances; PAT, patient.
Statistical analyses
The data were analysed using SPSS for Windows Version 17.0. For sample description, frequencies were computed for categorial variables, mean, standard deviation (SD), minimum and maximum were computed for continuous variables. As costs were expected to be considerably right skewed and thus deviate from a normal distribution, the median was calculated in addition and exploratory subgroup analyses to identify potential predictors of total direct costs (and total costs) were a priori planned non‐parametric. To achieve a more uniform and readable presentation of the non‐parametric subgroup analyses, median splits were performed on continuous variables age and wound size. Additionally, the results are always given as statistics of the Kruskal–Wallis Test, regardless of the number of groups compared.
Results
Patients and centres
A total of 2195 institutions involved in wound care were identified and contacted by mail. Of these, 147 institutions signed for participation. Five hundred and thirty eligible patients were identified from their office records of which 28 patients were excluded at the beginning of the study interview due to failed inclusion criteria. Thus, 502 patients were enrolled and finished the whole clinical examination and interview. Of these, 381 patients completed and returned the patient questionnaire.
A quarter of the patients was enrolled in specialised wound centres (24·9%, n = 125), 23·3% (n = 117) were recruited by dermatologists, 12·2% (n = 61) by general practitioners, 11·8% (n = 59) by surgeons and 11·2% (n = 56) by nursing services.
Clinical and sociodemographic data
In all, 43·6% patients were male, mean age was 71·4 years (SD = 14·2, median 73·79), the youngest and oldest study participants aged 22·5 and 97·4 years, respectively.
As consequence to the relative old age of the patients, the employment rate was low (8·8%, n = 33) (Table 3). About 156 patients were living alone (43·7%) and 170 patients (35·1%) were visited by a nursing service.
Table 3.
Sociodemographic characteristics of the sample (n = 502)
| Item | Characteristic | % | n |
|---|---|---|---|
| Marital status (n = 374) | Married | 44·4 | 166 |
| Widowed | 29·7 | 111 | |
| Divorced | 9·6 | 36 | |
| Single | 16·3 | 61 | |
| Employment status (n = 373) | Employed | 8·8 | 33 |
| Not employed | 91·2 | 340 | |
| Reason for unemployment (n = 346) | Retired | 85·0 | 294 |
| Housewife | 6·1 | 21 | |
| Unemployed | 6·6 | 23 | |
| Other | 2·3 | 8 | |
| Education (n = 372) | Grammar school or higher | 14·7 | 55 |
| Secondary general school | 56·7 | 211 | |
| Intermediate secondary | 22·6 | 84 | |
| Other/none final school | 4·6/1·3 | 17/5 |
The majority of the patients (78·5%) had a venous aetiology of the leg ulcer. Other aetiologies were arterial in 9·8%, post‐traumatic in 10·0%, vasculitis in 1·6% and unknown in 9·0% (n = 45). Mean total wound size was 43·5 cm2 (SD = 108·3, median 9·1). The mean duration of the leg ulcer disease was 107 months (SD = 173, range 1–840 months), whereas recent ulcer was persisting on average for 30·48 months (SD = 77·43, range 1–768 months). Nearly half of the patients were actually suffering from a relapse 45·3% (n = 226). The most frequent comorbidity was arterial hypertension (55·4%, n = 278), followed by obesity (24·3%, n = 122, mean body mass index 27·7, SD = 6·7), diabetes (22·1%, n = 111) and hyperlipidaemia (9·0%, n = 45).
Wound‐care provision
For 26·3% (n = 132) of the patients, the main medical attendance was performed by a general practitioner, followed by dermatologists (25·5%, n = 128), wound centres (17·2%, n = 86) and surgeons (13·6%, n = 68).
The average frequency of wound dressings per week was 4·6 and had a mean duration of 16·2 minutes. The average number of hospitalisations because of the leg ulcer disease in the past 12 months was 0·5, mean duration of stay was 8·4 days (n = 494).
Quality of life
The mean FLQA‐wk total score was 2·92. There were significant reductions of HRQoL in all dimensions, compared with patients without leg ulcers. Major impairments were observed in the areas of daily routine (mean = 3·16), followed by therapy (mean = 2·91) and physical discomfort (mean = 2·88).
Costs‐of‐illness
The annual costs‐of‐illness are summarised in Table 4. The standard deviations and ranges of all cost variables demonstrate a high variability. Whereas the minimum for each variable is zero (there is one patient without any consumption and costs), the maxima are considerably high, pointing to at least one patient with high consumptions and costs. As the median costs on the variables are lower than the mean costs (except for total drug expenses of the statutory health insurances as an effect of systemic treatments), the distributions are as expected left skewed (Figure 1).
Table 4.
Annual costs of illness per patient with chronic leg ulcer (Euro; n = 502)
| Annual costs of illness (€) | Mean | SD | Median | Minimum | Maximum |
|---|---|---|---|---|---|
| Topical treatment SHI | 637·37 | 1257·30 | 336·00 | 0·00 | 17055·36 |
| Wound dressings SHI | 1339·69 | 2124·07 | 529·20 | 0·00 | 21031·68 |
| Topical treatment patient | 156·75 | 234·69 | 56·64 | 0·00 | 1466·40 |
| Systemic treatment SHI | 874·35 | 712·63 | 916·15 | 0·00 | 3300·75 |
| Total drug expenses SHI | 910·87 | 771·52 | 916·15 | 0·00 | 5496·81 |
| Total drug expenses Patient | 156·75 | 234·69 | 56·64 | 0·00 | 1466·40 |
| Non‐drug treatment costs SHI | 2071·88 | 2660·14 | 1127·76 | 0·00 | 28567·03 |
| Non‐drug treatment expenses patient | 328·89 | 665·92 | 148·80 | 0·00 | 9600·00 |
| Outpatient treatment fees | 1309·82 | 2025·88 | 180·00 | 0·00 | 10297·92 |
| Total treatment costs SHI | 4292·57 | 3845·00 | 3041·04 | 0·00 | 33785·84 |
| Total treatment costs patient | 607·60 | 778·97 | 414·24 | 0·00 | 10331·52 |
| Hospital costs | 3387·39 | 5271·38 | 0·00 | 0·00 | 28362·00 |
| Total costs SHI | 7679·96 | 6912·63 | 6150·96 | 0·00 | 42401·69 |
| Total costs patient | 607·60 | 778·97 | 414·24 | 0·00 | 10331·52 |
| Total direct costs | 8287·55 | 7095·56 | 6846·69 | 0·00 | 43245·29 |
| Total indirect costs | 772·17 | 1676·86 | 0·00 | 0·00 | 10281·60 |
| Total costs | 9059·72 | 7435·60 | 7247·78 | 0·00 | 44461·92 |
SHI, statutory health insurances.
Figure 1.
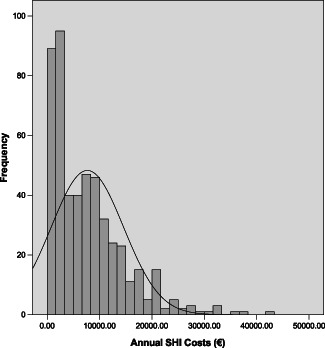
Distribution of annual costs of leg ulcer patients undertaken by statutory health insurances, n = 502.
From the perspective of statutory health insurances, mean total treatment costs for ambulant care were about 4300€ , including non‐drug treatment costs (approximately 2100€), drug expenses (approximately 900€) and outpatient treatment fees (approximately 1300€). Mean hospital costs were approximately 3400€ , thus resulting in mean total costs for the statutory health insurances of 7680€ per patient and year. Hence, major cost drivers are non‐drug treatments and hospital costs.
Mean out‐of‐pocket costs were 610€, including two quarters because of non‐drug treatment costs (330€) and about one quarter for drug expenses and for transportation and other remedies, respectively.
Mean annual direct costs summed to 8287·55€ and total indirect costs to approximately 775€ per patient. In summary, the mean total costs caused by the leg ulcers were 9059·72€. The median costs point to the existence of a few patients with higher resource usage and costs and a majority with lower resource usage and costs. For indirect costs, only productivity loss because of dressing changes of relatives were observed, because 30% of the patients changed their wound dressings by themselves and the employment rate was low. As dressings were changed only for 8·5% of the patients by a spouse and for 2% by family members, the resulting costs are expectedly low.
Subgroup analyses
To identify potential predictors of total direct costs (and total costs) a priori planned subgroup analysis was performed. The set of variables selected for predictor analysis included the sociodemographic variables of age (splitted at the median to compare ‘younger versus older’ patients), sex and educational status, the wound characteristics aetiology of ulcer, wound size (splitted at the median to compare ‘smaller versus larger’ wounds) former wound closure and the presence of following comorbidities: arterial occlusive disease (AOD), walking distance limited to 200 m as well as hypertension. Additionally, the following treatment characteristics were chosen: main treatment provider, nursing care usage, dressing change by patient, dressing change by a relative, pain during dressing change, usage of antihypertensive medication, usage of antibiotics, usage of analgetics and usage of immunosuppressants. Finally, the quality of care index and treatment satisfaction were categorised into two groups of ‘good to very good’ versus ‘moderate to poor’ quality of care and treatment satisfaction, respectively.
The results of the subgroup analyses are presented in Table 5 for total costs. As the subgroup analyses for direct costs did not lead to different results and interpretations, these are not shown (but may be requested from the authors).
Table 5.
Subgroup comparisons on total costs of illness
| Variable | Group | Annual total costs SHI | ||||||
|---|---|---|---|---|---|---|---|---|
| n | Mean | SD | Median | χ 2 | df | P | ||
| Sex | Male | 219 | 7357·08 | 6757·22 | 5796·00 | 1·36 | 1 | 0·243 |
| Female | 283 | 7929·81 | 7032·26 | 6386·23 | ||||
| Age | <Median | 250 | 7864·50 | 7426·30 | 6240·96 | 0·05 | 1 | 0·816 |
| >Median | 250 | 7533·55 | 6383·25 | 6166·74 | ||||
| Educational status | No formal | 17 | 5590·96 | 6602·62 | 2585·64 | 9·13 | 5 | 0·104 |
| Secondary general school | 211 | 8065·57 | 7165·56 | 6944·83 | ||||
| Intermediate secondary school | 84 | 8398·43 | 6872·12 | 7012·93 | ||||
| Special upper secondary school | 21 | 6202·31 | 7207·64 | 3073·15 | ||||
| Grammar school class A‐level | 34 | 9212·84 | 7198·51 | 7282·26 | ||||
| Other | 5 | 5453·19 | 4626·57 | 2832·48 | ||||
| Aetiology | Venous | 274 | 6905·22 | 1397·95 | 5502·33 | 13·46 | 3 | 0·004 |
| Arterious | 49 | 10241·19 | 8715·35 | 7391·39 | ||||
| Mixed | 75 | 9127·23 | 7180·90 | 8561·23 | ||||
| Other | 101 | 7369·80 | 6929·95 | 5944·60 | ||||
| Wound size | <Median | 240 | 6210·81 | 5516·16 | 4848·19 | 53·96 | 1 | 0·000 |
| >Median | 254 | 8941·64 | 7629·70 | 7249·78 | ||||
| Former wound closure | Yes | 226 | 6579·54 | 5650·22 | 5072·60 | 6·72 | 1 | 0·010 |
| No | 273 | 8586·84 | 7683·18 | 7044·74 | ||||
| Arterial occlusive disease | Yes | 148 | 8880·87 | 7596·64 | 7288·03 | 6·01 | 1 | 0·014 |
| No | 354 | 7177·88 | 6552·06 | 5608·03 | ||||
| Walking distance< 200 m | Yes | 66 | 9703·40 | 7707·37 | 9288·02 | 6·19 | 1 | 0·013 |
| No | 430 | 7341·90 | 6722·57 | 5845·40 | ||||
| Hypertension | Yes | 278 | 8139·07 | 7123·35 | 6803·29 | 2·92 | 1 | 0·088 |
| No | 224 | 7110·17 | 6613·32 | 5525·13 | ||||
| Treatment provider | Hospital | 55 | 15880·76 | 7860·72 | 13817·22 | 122·26 | 4 | 0·000 |
| Wound centre | 86 | 9650·77 | 6628·62 | 8517·01 | ||||
| GP | 132 | 6715·86 | 6173·96 | 5121·28 | ||||
| Surgeon office | 68 | 5461·50 | 5336·56 | 3106·48 | ||||
| Dermatologist office | 128 | 4408·79 | 4410·16 | 2386·42 | ||||
| Post hoc contrast | Wound centre | 86 | 9650·77 | 6628·62 | 8517·01 | 14·40 | 1 | 0·000 |
| GP | 132 | 6715·86 | 6173·96 | 5121·28 | ||||
| Nursing service | Yes | 170 | 10813·81 | 7463·06 | 9395·81 | 64·61 | 1 | 0·000 |
| No | 315 | 6223·42 | 6112·11 | 3874·87 | ||||
| Dressing change by patient | Yes | 140 | 5971·30 | 5401·04 | 4882·50 | 12·47 | 1 | 0·000 |
| No | 208 | 8682·04 | 7459·30 | 6960·70 | ||||
| Dressing change by relative | Yes | 42 | 6166·39 | 6135·10 | 3180·75 | 3·55 | 1 | 0·060 |
| No | 306 | 7787·12 | 6906·20 | 6443·87 | ||||
| Pain during dressing change | Yes | 131 | 10046·04 | 8336·56 | 7842·43 | 18·95 | 2 | 0·000 |
| No | 269 | 6633·57 | 6144·98 | 4928·10 | ||||
| Sometimes | 68 | 7317·46 | 5314·49 | 6628·80 | ||||
| Antihypertensives | Yes | 329 | 8128·20 | 7200·81 | 6568·55 | 4·06 | 1 | 0·044 |
| No | 173 | 6827·51 | 6260·28 | 5310·09 | ||||
| Antibiotics | Yes | 49 | 9590·90 | 7600·70 | 9080·16 | 5·00 | 1 | 0·025 |
| No | 453 | 7473·25 | 6811·10 | 5975·44 | ||||
| Analgetics | Yes | 271 | 9201·76 | 7228·13 | 7595·95 | 44·95 | 1 | 0·000 |
| No | 231 | 5894·63 | 6068·36 | 3349·92 | ||||
| Imunosuppressants | Yes | 31 | 10799·38 | 7563·64 | 9333·93 | 9·10 | 1 | 0·003 |
| No | 471 | 7474·64 | 6826·46 | 6010·90 | ||||
| Satisfaction with care (rating) | Good to very good | 182 | 6666·98 | 6277·80 | 5098·74 | 11·05 | 1 | 0·001 |
| Modarate to poor | 165 | 8999·87 | 7227·21 | 7521·23 | ||||
| Treatment satisfaction (rating) | Good to very good | 30 | 7064·98 | 5683·49 | 6303·40 | 0·30 | 1 | 0·585 |
| Modarate to poor | 347 | 8052·65 | 7144·45 | 6675·28 | ||||
| Quality of care index | Acceptable (≥60%) | 320 | 10241·32 | 7773·54 | 8541·61 | 22·37 | 1 | 0·000 |
| Inacceptable (<60%) | 182 | 6982·18 | 6302·97 | 4518·76 | ||||
GP, general practitioner.
No significant differences in costs were observed between subgroups defined by sociodemographic characteristics (age, sex and educational status), whereas subgroups according to aetiology, size and former closure of the wound all showed significant differences. Predictors of higher costs were: (i) Arterial, followed by mixed and other aetiology in relation to venous aetiology, (ii) greater wound size and (iii) no former wound closure. Taking into consideration the multiplicity of subgroup tests, a familywise adjustment of tests performed on wound characteristics (two tests) would not alter the significance, whereas a full Bonferroni‐adjustment (21 tests) would result in a single significant difference between the wound size subgroups.
Regarding comorbidities, the presence of AOD and severe AOD (walking distance limited to 200 m) each were accompanied by higher costs. No significant difference was found for the presence of hypertension. A familywise adjustment of significance would not alter the results and after full adjustment, no difference remains significant.
Distinct medications were accompanied by significantly higher costs. Costs were significantly higher regarding pain during dressing change and use of analgetics. Use of analgetics and having pain resulted in the highest costs (12 620€), whereas use of analgetics and less frequent pain resulted in less costs (9647 and 9154€). The absence of analgetics use was associated with lower costs, whereas the ranking of costs for pain subgroups was the same as for analgetic usage (pain: 8055€ , sometimes: 7522€ and no pain: 6860€ during dressing change). Furthermore, the use of antihypertensives, antibiotics and immunosuppressants was associated with higher costs. After adjustment for multiple testing only the use of immunosuppressants remains significant.
Most of subgroup comparisons on costs were significant when addressing characteristics of treatment. Costs were highest when hospitals were the main providers of treatment, followed by wound centres, GP, surgeon and dermatology offices. A special post hoc contrast between the subgroups of GP and wound centre patients showed that wound centre treatment resulted in significantly higher costs than GP treatment. In addition, the usage of a nursing service resulted in higher costs, whereas the dressing change by the patient resulted in lower costs. These differences remain significant regardless of the adjustment for multiple tests applied.
The last three comparisons reflect relevant consequences (instead of potential predictors) of treatment: satisfaction with treatment, satisfaction with wound care and quality of care. From the patient perspective, moderate to poor quality of care is significantly associated with higher costs, whereas the result on the quality of care index shows higher costs for patients treated acceptable according to quality criteria. These results remain significant regardless of adjustment applied. Again the results are better understood, when looking at the bivariate distribution of costs: for patients satisfied with wound care and acceptable quality of care according to the index, mean total costs summed to 9050€, whereas for patients satisfied with wound care and inacceptable quality of care the lowest costs (5750€) were observed.
Discussion
This study was designed to assess the economic impact of community leg ulcers in the Metropolitan area of Hamburg. To capture the full range of patients, a broad sampling strategy integrating all health care providers was used as the first step. This enabled a description of HrQoL, the quality of care and the cost‐of‐illness in the whole region 15, 16. As many of the health care providers, general practitioners as well as home care services, do not treat wound patients on a regular basis, the rather low rate of participating institutions does most probably not mean a selection bias. Given the fact that the prevalence of open venous leg ulcers is below 0·1% and thus of all leg ulcers below 0·2% in the average German population (21), a maximum of about 2000 leg ulcers in the target area of this studies could have been expected. Thus, about 25% of the complete population with leg ulcers have been enrolled in this study.
No significant differences were observed between patient subgroups with respect to sociodemographic variables, indicating a high degree of equity of the German health care system as a major strength. On the other side, patients were highly impaired in their HrQoL and the degree of out‐of‐pocket costs is relative high for a high‐aged population of retired patients with – at least partly – low income. The present data show that the leg ulcer disease imposes a considerable economic burden on the public health services and the patients. The mean total direct costs‐of‐illness were 8288€ and ranged from 0·0€ (no treatment) to 43 245€. Even the total costs for the median patient summed to 7250€ per year.
Compared with other dermatological illnesses, leg ulcer is a financially important illness due to the necessity of intensive care like hospitalisation, nursing service and long duration and recurrence of the ulcer 22, 23, 24.
From the statutory health insurance perspective, the main costs were generated by hospitalisation (3387€) and non drug‐costs (2072€), the latter including medical devices as well as physician and nursing fees. Contrary to a study in specialised wound centres on the cost‐of‐illness of venous leg ulcers (25), in this study the doctors' and nursing salaries (1310€) were less expressed than the costs of the wound dressings (1340€). Interpretation of treatment costs, in some points unexpected, requires to provide an insight into German health care system. Physician fees in outpatient care differ depending on specialisation and are stated by fixed budgets. Accordingly, patient contact can only be charged once in a quarter, treatment costs and procedures are budgeted and capped at different levels for different specialisations. For this reason, treatment by dermatologists was less costly than by other consultants and nurses and not reflected by the time needed for treatment.
Beyond that, it has to be taken into consideration that a mean account of dressing changes of 4·63 times per week is considerably high when modern wound dressings are used. This points to unnecessary costs using relatively expensive modern wound dressings recommended for longer dressing change intervals, normally requiring to 1–2 changes per week.
Wound aetiology decisively influences costs. For example, presence of AOD is accompanied by higher costs due to comorbidities (e.g. coronary heart disease, hypertension, hypercholesteremia and insults), complicated treatment (e.g. vascular interventions, angiography) and more severe course of disease leading to more frequent need for inpatient treatment. Furthermore, unlike in AOD, in many cases of venous insufficiency a cure is possible.
Patients' satisfaction with care is particularly associated with costs, underlined by our findings that lack of satisfaction accompanied with good care leads to the highest amount of costs. This may be a negative influencing factor for compliance, an important cornerstone in economic wound treatment 26, 27. Another cost driver in patients unsatisfied with wound care may be frequent changes of therapists. For the planning of resource allocation, the mean costs are essential, because they are computed from the resources required in the period of observation. While the median costs are lower, they do not allow to extrapolate the resources needed in advance and only describe the costs of illness of a typical patient, without using cost information below and above this patient.
Moreover, the mean costs presented might be an underestimation of the costs for the statutory health insurance population in the future for two reasons: first, only resources documented by the main treatment provider or stated by the patients in the interviews were used to construct the cost‐of‐illness and second, patients without health insurance, probably experiencing high barriers to care and showing low‐health usage behaviour were included.
A weakness of this study lies in the fact that the analysis was performed at only one time point. A follow‐up would allow identification of long‐term effects. For this, the relation of costs to treatment outcomes is impossible. In that sense, treatment by specialised wound centres and structured treatment programs has been shown to shorten time to wound healing and decrease hospital stays (28).
This study showed that the high treatment costs of community leg ulcers are associated with an acceptable level of quality of care as indicated by the health care index. Further studies should focus on the long‐term effects of better health care quality in wounds, Moreover, the impact of better health care on quality of life and costs needs to be verified.
References
- 1. AWMF (Arbeitsgemeinschaft der Wissenschaftlichen Medizinischen Fachgesellschaften Deutschland), DGP . Leitlinien der Deutschen Gesellschaft für Phlebologie, Leitlinie zur Diagnostik und Therapie des Ulcus cruris venosum, 2004.
- 2. Franks PJ, Moffat CJ, Connolly M, Bosanquet N, Oldoyd M, Greenhalgh RM, Mccollum CN. Community leg ulcer clinics: effect on quality of life. Phlebologie 1994;9:83–6. [Google Scholar]
- 3. Olin JW, Beusterien KM, Childs MB, Seavey C, McHugh L, Griffiths RI. Medical costs of treating venous stasis ulcers: evidence from a retrospective cohort study. Vasc Med 1999;4:1. [DOI] [PubMed] [Google Scholar]
- 4. Harrington C, Zagari MJ, Corea J, Klitenic J. A cost analysis of diabetic lower‐extremity ulcers. Diabetes Care 2000;23:1333–8. [DOI] [PubMed] [Google Scholar]
- 5. Apelqvist J, Ragnarson‐Tennvall G, Larsson J, Persson U. Long‐term costs for foot ulcers in diabetic patients in a multidisciplinary setting. Foot Ankle Int 1995;16:388–94. [DOI] [PubMed] [Google Scholar]
- 6. Van Acker K, Oleen‐Burkey M, De Decker L, Vanmaele R, Van Schil P, Matricali G, Dys H, De Leeuw I. Cost and resource utilization for prevention and treatment of foot lesions in a diabetic foot clinic in Belgium. Diabetes Res Clin Pract 2000;50:87–95. [DOI] [PubMed] [Google Scholar]
- 7. Holzer SE, Camerota A, Martens L, Cuerdon T, Crystal‐Peters J, Zagari M. Costs and duration of care for lower extremity ulcers in patients with diabetes. Clin Ther 1998;20:169–81. [DOI] [PubMed] [Google Scholar]
- 8. Ramsey SD, Newton K, Blough D, McCulloch DK, Sandhu N, Reiber GE, Wagner EH. Incidence, outcomes, and cost of foot ulcers in patients with diabetes. Diabetes Care 1999;22:382–7. [DOI] [PubMed] [Google Scholar]
- 9. Purwins S, Herberger K, Debus ES, Rustenbach SJ, Pelzer P, Rabe E, Schafer E, Stadler R, Augustin M. Cost‐of‐illness of chronic leg ulcers in Germany. Int Wound J 2010;7:7–102. [DOI] [PMC free article] [PubMed] [Google Scholar]
- 10. Van Den Oever R, Hepp B, Debbaut B, Simon I. Socio‐economic impact of chronic venous insufficiency. Int Angiol 1997;19:161–7. [PubMed] [Google Scholar]
- 11. Herberger K, Rustenbach SJ, Haartje O, Blome C, Franzke N, Schäfer I, Radtke M, Augustin M. Quality of life and satisfaction of patients with leg ulcers ‐ results of a community‐based study. Vasa 2011;40:131–8. [DOI] [PubMed] [Google Scholar]
- 12. Zschocke I, Bross F, Maier K, Vanscheidt W, Augustin M. Quality of live in different stages of chronic venous insufficiency and leg ulcer. Dermatol Psychosom 2002;3:12631. [Google Scholar]
- 13. Lindholm C, Bjellerup M, Christensen OB, Jederfeldt B. Quality of life in chronic leg ulcer patients. An assessment according to the Nottingham Health Profile. Acta Derm Venereol 1993;73:440–3. [DOI] [PubMed] [Google Scholar]
- 14. Phillips T, Stanton B, Provan A, Lew R. A study of the impact of leg ulcers on quality of life: financial, social, and psychologic implications. J Am Acad Dermatol 1994;31:49–53. [DOI] [PubMed] [Google Scholar]
- 15. Herberger K, Rustenbach SJ, Grams L, Münter KC, Schäfer E, Augustin M. Quality‐of‐care for leg ulcers in the metropolitan area of Hamburg – a community‐based study. J Eur Acad Dermatol Venereol 2011;14:S1468–3083. [DOI] [PubMed] [Google Scholar]
- 16. Augustin M, Rustenbach SJ, Debus S, Grams L, Münter KC, Tigges W, Schäfer E, Herberger K. Quality‐of‐care in chronic leg ulcer in the community ‐ introduction of quality indicators and a scoring system. Dermatology 2011;222:321–9. [DOI] [PubMed] [Google Scholar]
- 17. European Wound Management Association (EWMA) . Position document wound bed preparation in practice. London: MEP Ltd, 2004. [Google Scholar]
- 18. Zschocke I, Bross F, Maier K, Vanscheidt W, Augustin M. Quality of life in different stages of chronic venous insufficiency and leg ulcer. Dermatol Psychosomat 2002;3:126–31. [Google Scholar]
- 19. Augustin M, Dieterle W, Zschocke I, Brill C, Trefzer D, Peschen M, Schöpf E, Vanscheidt W. Development and validation of a disease‐specific questionnaire on the quality of life of patients with chronic venous insufficiency. Vasa 1997;26:291–301. [PubMed] [Google Scholar]
- 20. Schwabe U, Paffrath D. Arzneiverordnungs‐report 2006. Berlin: Springer‐Verlag, 2007. [Google Scholar]
- 21. Pannier‐Fischer F, Rabe E. Epidemiology of chronic venous diseases. Hautarzt 2003;54:1037–44. [DOI] [PubMed] [Google Scholar]
- 22. Berger K, Ehlken B, Kugland B, Augustin M. Cost‐of‐illness in patients with moderate and severe chronic psoriasis vulgaris in Germany. J Dtsch Dermatol Ges 2005;3:511–8. [DOI] [PubMed] [Google Scholar]
- 23. Richert L, Weber R, Doelfs P, Tscheulin D, Augustin M. Stationäre Behandlungskosten von Hautkrankheiten. Hautarzt 2004;55:1047–51. [DOI] [PubMed] [Google Scholar]
- 24. Sohn S, Schoeffski O, Prinz J, Reich K, Schubert E, Waldorf K, Augustin M. Cost of moderate to severe plaque psoriasis in Germany: a mulitcenter cost‐of‐illness study. Dermatology 2005;212:137–144. [DOI] [PubMed] [Google Scholar]
- 25. Augustin M, Siegel A, Heuser A, Vanscheidt W. Chronic leg ulcer: Cost evaluation of two treatment strategies. J Dermatol Treat 1999;10:S21–5. [Google Scholar]
- 26. Trent JT, Falabella A, Eaglstein WH, Kirsner RS. Venous ulcers: pathophysiology and treatment options. Ostomy Wound Manage 2005;51:38–54. [PubMed] [Google Scholar]
- 27. Samson HS, Showalter DP. Stockings and the prevention of recurrent venous ulcers. Dermatol Surg 1996;22:373–6. [DOI] [PubMed] [Google Scholar]
- 28. Gottrup F. A specialized wound‐healing center concept: importance of a multidisciplinary department structure and surgical treatment facilities in the treatment of chronic wounds. Am J Surg 2004;187:38S–43S. [DOI] [PubMed] [Google Scholar]