

Abstract
This study aims to explore the influence of hyaluronic acid (HA) on wound healing during xenogeneic porcine acellular dermal matrix (PADM) composite skin grafting. The results will facilitate the development of methods for improving graft contracture and poor elasticity of composite transplantation. Exogenous HA was added to composite PADM grafts and to thin autologous skin grafts during rabbit full‐thickness skin wound repair. The influence of HA on wound healing was evaluated according to its contracture rate and its expression of collagen types I and III. The possible mechanism was then explored based on HA metabolism and vascularisation in the skin graft. The results show that exogenous HA relieves graft contracture on rabbit wound surfaces, increases collagen I and III expression and decreases the ratio between collagen types. HA stimulates the generation of more CD44 receptors to strengthen its enzymolysis. The resulting metabolites promote the vascularisation of the wound surface, which are conducive for mitigating graft contracture, and further improve the composite grafting effect.
Keywords: Acellular dermal matrix; Hyaluronic acid; Skin grafting; Wound healing
Introduction
Acellular dermal matrices (ADMs) have been clinically applied for wound surface repair (1). However, after repair, skin grafts often exhibit poor elasticity and often contract. Hyaluronic acid (HA) functions as an anti‐inflammatory, regulating collagen synthesis and promoting wound healing during the non‐scar healing of foetal skin 2, 3. Mucopolysaccharides in the extracellular matrix such as HA 4, 5 and chondroitin sulphate are always totally lost during ADM decellularisation 6, 7. Therefore, the addition of exogenous HA to regulate collagen syntheses and to reduce scar formation and graft contracture during porcine acellular dermal matrix (PADM) composite skin grafting appears feasible. CD44 is the most important HA receptor. Among the various mediators during HA embolism, CD44 has been most extensively studied. HA realises many of its functions through its interactions with membrane receptors 8, 9, 10, 11, 12, 13.
In this study, the mechanisms underlying the long‐term changes in the biomechanical characteristics of the skin graft were investigated after composite transplantation in rabbit models. Consequently, the graft contracture rate, syntheses of collagen types I and III, microvessel density (MVD), HA concentration and CD44 expression were detected.
Methods
Preparation of rabbit full‐thickness skin wound surface models
A total of 50 clean‐grade Japanese large‐eared rabbits of either sex, weighing 3·1 ± 0·1 kg, were selected. Four 5 cm × 3 cm rectangular, full‐thickness pieces of skin were symmetrically cut off from both sides of the vertebral column of each rabbit. The space between the pieces was 4 cm. The wound reached the depth of the fascia. A total of 200 wound surfaces were prepared. The full‐thickness skin in the experimental group was reversely chopped using a drum dermatome into approximately 0·4‐mm thin skin (TS) layers using a drum dermatome. Normal skin (NS) was used for the samples in the control group.
PADM was mesh‐pulled to a 1:3 ratio using a sterile skin mesh puller. The obtained PADM was then cut into equal‐sized rectangles (7 meshes × 5 meshes).
Wound surface treatment
According to different treatment methods, the rabbits were divided into five groups with ten rabbits in each group. They included the HA1 + PADM + TS autograft (HA1), HA2 + PADM + TS autograft (HA2), PADM + TS autograft (PADM), TS autograft (TS) and normal skin (NS) groups. For the HA1 group, 0·3 ml of exogenous HA was evenly applied onto the dermal surface of the skin graft (about 0·17 mg/cm2). The wound surface was covered with the mesh‐pulled PADM, and was further covered with the graft containing HA (the dermal surface facing inwards). For the HA2 group, the procedures were the same as those for the HA1 group except the HA dose was doubled (0·6 ml, about 0·34 mg/cm2). For the PADM group, no HA was applied. For the TS group, the thin autograft was sutured in situ. All wound surfaces in the experimental groups were packaged for fixation after suturing. For the NS group, the normal skin on the back was taken post‐mortem. The samples were the same as those in the experimental groups in terms of position, size and texture direction. All the experimental groups were given rip‐prevention and anti‐infection treatment. The surgical procedures are shown in Figure 1.
Figure 1.
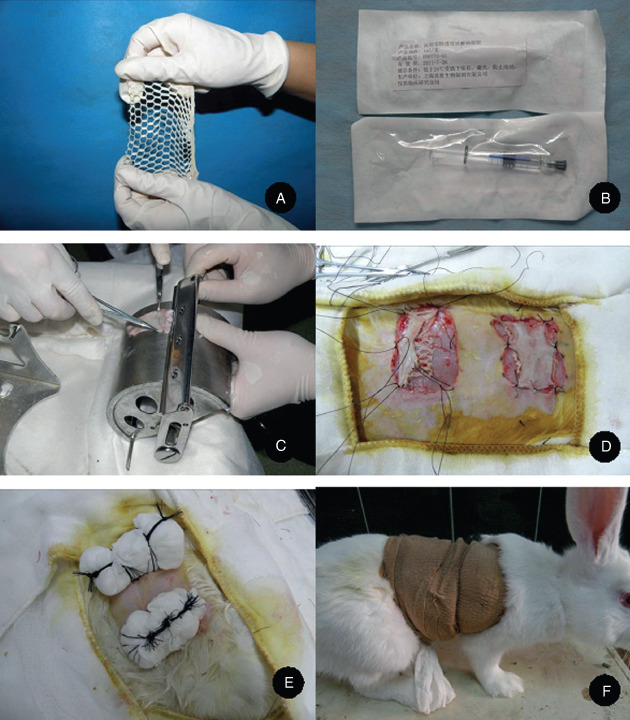
The preparation and treatment of rabbit skin wound surfaces. (A) The mesh‐pulled porcine acellular dermal matrix, (B) the medical hyaluronic acid gel, (C) taking the thin full‐thickness skin from the surface of the drum dermatome, (D) rabbit full‐thickness wound surface and composite skin grafting, (E) fixation after wrapping up and (F) ripping‐preventing treatment using elastic bandages.
Sample collection and treatment
The samples were collected in two separate periods. In the first period, ten rabbits were euthanised on days 28 and 56 after surgery. The gross samples were observed to calculate the contracture rates and the grafted tissues were removed. The samples were divided into two parts. One part was quickly frozen with liquid nitrogen, ground and lysed. The obtained supernatant liquid was extracted for Western blot analysis. The other part was stored in liquid nitrogen.
In the second period, ten rabbits were euthanised on days 3, 7 and 14 after surgery. The four grafted tissues and the control skin on the back of the rabbits were collected. The samples were again divided into two parts. One part and the stored samples in the first period were observed using haematoxylin and eosin (HE) staining and immunohistochemistry, whereas the other part and the rest of the stored samples were analysed using an enzyme immunoassay and a radioimmunoassay.
HE staining
HE staining was performed to compare the sample structures, the fusion of the PADM with its surrounding tissues, the inflammatory cell infiltration and the changes in the collagen fibres among the different groups.
Western blot analysis
The tissues kept in liquid nitrogen were taken out, ground, mixed thoroughly and centrifuged. The obtained supernatant liquid was subpackaged and frozen for storage. A bicinchoninic acid protein quantitative kit was used to quantify the protein concentration in the sample. Electrophoresis, transmembranous immunoblotting, membrane washing, chemiluminescence and grey value analysis were performed for data collection using Image J v1.42.
CD31 immunohistochemical staining
Sample sections were deparaffinised, dehydrated, rinsed and incubated. They were then rinsed and enzymatically digested. Rat anti‐rabbit CD31 monoclonal antibodies were added and then rinsed. Horseradish peroxidase (HRP)‐conjugated goat anti‐mouse immunoglobulin G (IgG) multimers were added, incubated and rinsed. Later, the samples were diaminobenzidine (DAB)‐stained and then rinsed again. The obtained samples were dehydrated and dried. Finally, the specimens were mounted with neutral gum and then dried, and photographs were taken.
Enzyme‐linked immunosorbent assay
The samples were ground and centrifuged. The supernatant liquids were then extracted. The absorbance [optical density (OD) value] was determined and the sample concentration was calculated.
Radioimmunoassay
A competitive radioimmunoassay was performed. The radioactivity of the binding polymers of the HA‐hyaluronic acid binding protein (HABP) compounds and HABP antibody/ secondary antibodies was measured using a computer. The four‐parameter method was used for data processing.
The data are presented as means ± standard error of means ( ). Statistical analysis was carried out with DHISS 2010 software using a q test to compare the differences between groups based on variance analysis. P < 0·05 was considered significant.
Results
Wound healing and the contracture rate
On day 28 after surgery, the skin grafts in all groups grew well with clear boundaries. They were complete and did not show obvious changes in size. The samples in the HA1 and HA2 groups were soft with good elasticity. Those in the PADM group were quite hard, and had poor elasticity. Those in the TS group were thin and susceptible to tearing. On day 56, the grafts contracted slightly (Figure 2). No significant differences in the graft textures were observed among the HA1, HA2 and PADM groups. The graft tissues in the TS group were thin with good elasticity. However, those in the NS group showed the best elasticity among all the groups.
Figure 2.
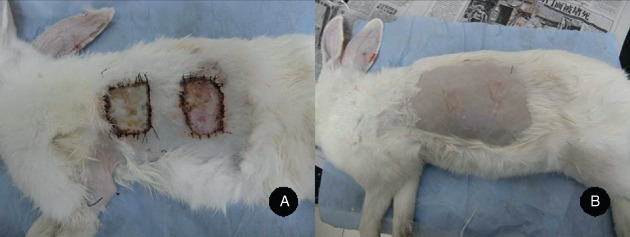
The wound surfaces on days 28 and 56 after surgery. (A) The wound surfaces on day 28 after surgery with the porcine acellular dermal matrix (PADM) group nearer to the head and the hyaluronic acid (HA2) group nearer to the tail and (B) the wound surfaces on day 56 after surgery with the HA2 group nearer to the head and the PADM group nearer to the tail.
The graft area was determined using the transparent film grid method. The contracture rate was calculated based on the following formula: the contracture rate = (the original graft area ‐ the area after healing) / the original graft area × 100%. The contracture rates of the different groups at different times after grafting are shown in Table 1. On day 28, no significant differences were observed among the PADM, HA1 and HA2 groups (P > 0 · 05), but the TS group showed a significant difference (P < 0·01). On day 56, significant differences were observed among the four groups (P < 0·05), among which the contracture rates of the PADM and TS groups were the highest, and that of the HA2 group was the lowest.
Table 1.
Comparisons of the contracture rates among different groups after grafting ( , n = 10)
| Contracture rate on day 28 after grafting (%) | Contracture rate on day 56 after grafting (%) | |
|---|---|---|
| HA1 | 1·6 ± 0·6 * | 19·6 ± 0·6 Δ , * |
| HA2 | 1·4 ± 0·2 * | 10·2 ± 0·6 Δ , * |
| PADM | 2·2 ± 0·9 * | 36·6 ± 0·8 * |
| TS | 10·4 ± 0·8 Δ | 32·7 ± 1·4 Δ |
HA, hyaluronic acid; PADM, porcine acellular dermal matrix; TS, thin skin.
Δ P < 0·05 compared with the PADM group and
* P < 0·05 compared with the TS group.
Histological observation
No obvious difference was observed between the results of days 3 and 7 after grafting. The HA1, HA2 and PADM groups appeared similar under light microscopy. The complete cuticular layer as well as the sectional dermal tissues and skin follicle structure were observed (the sections were from the thin autologous skin, including the full‐thickness cuticular layer and part of the dermal tissues). The surrounding wound tissues and the grafted dermal matrix were clearly delimited. The surrounding tissues had a dense fibrous structure, whereas the matrix had coarse and deformed fibres. A fibrous wrapping had not formed and many inflammatory cells had aggregated. In the TS group, the clearance between the wound base and the skin graft was visible where inflammatory cells were densely aggregated. Capillaries in the HA1 and HA2 groups were captured on day 7. Such a phenomenon in the PADM and TS groups was observed on day 3.
On day 14, fibrous wrapping outside the matrix was found in the HA1 and HA2 groups. The amount of capillaries increased and the inflammatory cells decreased. However, no noticeable difference was observed between these two groups. In the PADM group, no obvious fibrous wrapping was found. The number of capillaries increased, and most of them were concentrated at the juncture. The inflammatory cells were still dense. In the TS group, the capillaries and fibrocytes were dispersed between the skin graft and wound foundation, but inflammatory cell infiltration was still found on the wound surface.
On day 28, the dermal matrix and surrounding tissues were tightly bound in the HA1 and HA2 groups. Numerous fibroblasts had grown into the matrix from the surrounding areas. In the HA2 group, part of the fibrous wrapping outside the matrix had disappeared, and the matrix and its surrounding tissues had fused well. In the PADM group, a few fibroblasts grew into the matrix from the surrounding tissues. Numerous inflammatory cells had infiltrated into the graft area. In the TS group, the matrix had almost blended into the graft, but the healed dermal layer was thin.
On day 56, the composite skin‐grafted tissues in the HA1, HA2 and PADM groups were thinner, and the graft, dermal matrix and wound foundation were densely bound. Among the three groups, the fusion between the dermal matrix and surrounding tissues in the HA1 and HA2 groups was better. The two groups had an even fibre density, regular arrangement of fibres, showed growth of plentiful fibroblasts and capillaries into the spaces among collagen fibres. The direction of fibrocyte growth into the matrix was also observed. In the HA2 group, the matrix was padded with large segments of fibroblasts, whereas an obvious dermal metric structure was still present in the HA1 group. In the PADM group, mass‐gathering dermal matrix was still found with a dense fibrous structure, which sharply contrasted with the surrounding tissues, and a small number of fibroblasts and capillaries grew among the matrix. In the TS group, the graft and wound foundation were tightly bound and the inflammatory cells were clearly decreased. The histological results are shown in Figure 3.
Figure 3.
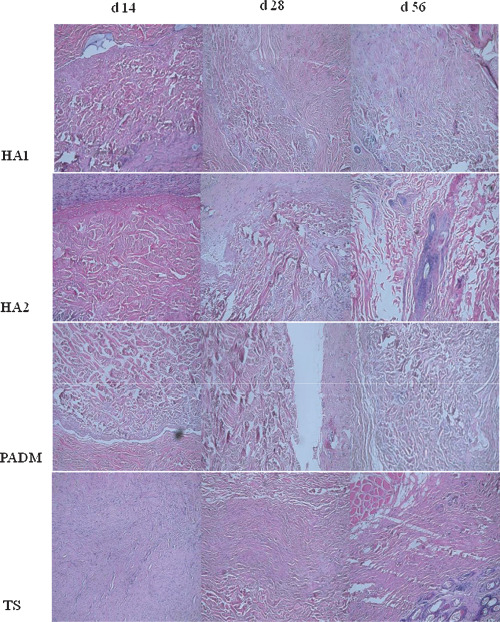
Histological observation of the wound surface after grafting (haematoxylin and eosin ×100).
Western blot analysis
The results of the Western blot analysis of collagen types I and III are shown in 4, 5, 6, and the average grey values are shown in 2, 3, with glyceraldehyde‐3‐phosphate dehyadrogenase (GAPDH) as the internal standard.
Figure 4.
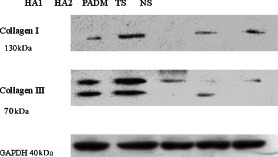
Western blot analyses of collagen I and III expression in different groups.
Figure 5.
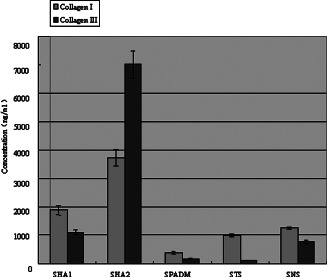
The collagen I and III expression in the composite skin graft in different groups on day 28 after transplantation.
Figure 6.
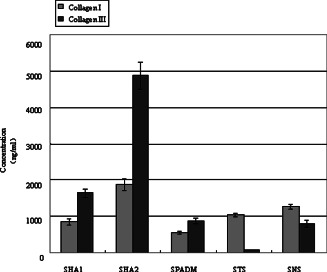
The collagen I and III expression in the skin graft in different groups on day 56 after transplantation.
Table 2.
The average grey values of collagen I and III, and GAPDH in the xenografts on day 28 after transplantation ( , n = 10)
| Groups | Collagen I | Collagen III | Ratio between collagen I and III |
|---|---|---|---|
| HA1 | 1882·04 ± 164·24 Δ , * | 1091·58 ± 90·77 Δ , * | 1·72 |
| HA2 | 3727·16 ± 280·72 Δ , * | 7007·06 ± 480·63 Δ , * | 0·53 |
| PADM | 372·85 ± 37·85 * | 158·09 ± 12·40 Δ , * | 2·38 |
| TS | 986·65 ± 42·64 | 108·53 ± 9·75 | 9·09 |
| NS | 1248·36 ± 50·88 | 761·75 ± 56·48 | 1·64 |
| GAPDH | 3235·58 ± 206·47 |
GAPDH, glyceraldehyde‐3‐phosphate dehyadrogenase; HA, hyaluronic acid; NS, normal skin; PADM, porcine acellular dermal matrix; TS, thin skin.
The PADM group shows significant differences compared with the HA1 and HA2 groups ( Δ P < 0·05) and the NS group shows significant differences compared with the HA1, HA2 and PADM groups ( * P < 0·05).
Table 3.
The average grey values of collagen I and III, and GAPDH in the grafted skin on day 56 after transplantation ( , n = 10)
| Groups | Collagen I | Collagen III | Ratio between collagen I and III |
|---|---|---|---|
| HA1 | 848·38 ± 90·64 Δ , * | 1637·37 ± 106·85 Δ , * | 0·52 |
| HA2 | 1874·68 ± 157·33 Δ , * | 4874·17 ± 366·81 Δ , * | 0·38 |
| PADM | 548·34 ± 42·98 * | 877·35 ± 67·88 | 0·63 |
| TS | 1040·28 ± 45·78 | 81·37 ± 6·45 | 12·5 |
| NS | 1267·44 ± 61·82 | 795·64 ± 91·77 | 1·59 |
| GAPDH | 3235·58 ± 206·47 |
HA, hyaluronic acid; NS, normal skin; PADM, porcine acellular dermal matrix; TS, thin skin.
The PADM group shows significant differences compared with the HA1 and HA2 groups ( Δ P < 0·05) and the NS group shows significant differences compared with the HA1, HA2 and PADM groups *(P < 0·05).
On day 28, the collagen I and III content in the HA1 and HA2 groups were higher than that in the PADM group, and that in the HA1 group was higher than that in the HA2 group. On day 56, the same result was obtained.
The collagen I content in the HA1 and HA2 groups increased with time, whereas that in the PADM group decreased. The collagen III content in the HA1 and PADM groups increased gradually with time, whereas that in the HA2 group decreased.
Microvascular density
Vascular endothelial cells were observed using anti‐CD31 monoclonal antibody‐labelled buffy granules under a microscope. They were counted using the method proposed by Pareek et al.(14). Each isolated buffy vascular endothelial cell or cell cluster was counted as one blood capillary (Figure 7).
Figure 7.
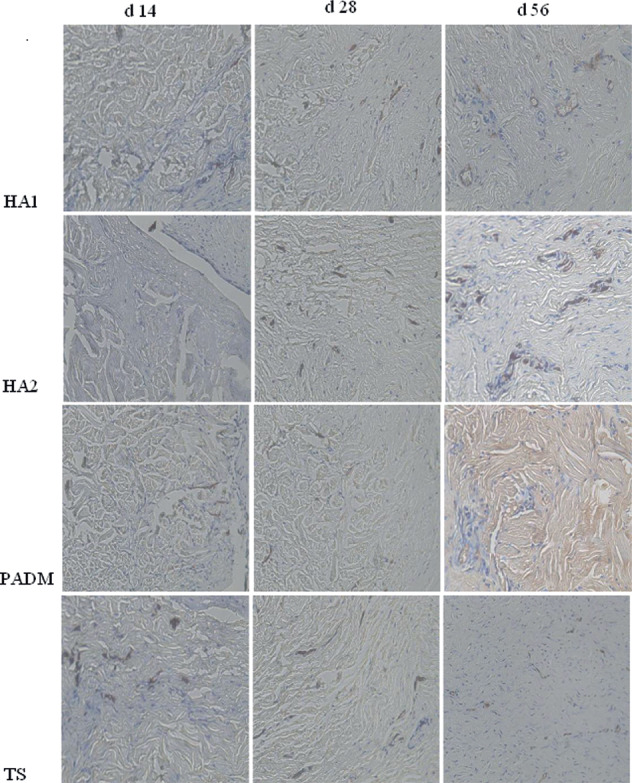
CD31 immunohistochemical observation after grafting (×200).
On day 3 after grafting, no capillaries were found in the HA1 or HA2 group, but some were found in the TS and PADM groups. On day 7, the MVD in the HA2 group was higher than that in the PADM and that in the HA1 group was lower than that in the TS group. On day 14, the MVD in the HA1 group was higher than that in the PADM group, and that in the TS group was lower than that in the HA2 group. On days 28 and 56, the MVD values in the different groups were as follows: HA2 > HA1 > TS > PADM > NS.
From days 3 to 6, the MVD values in the experimental groups initially increased and then decreased (Table 4).
Table 4.
The changes in the microvessel density values in different groups after grafting ( , n = 10)
| Groups | Day 3 | Day 7 | Day 14 | Day 28 | Day 56 |
|---|---|---|---|---|---|
| HA1 | 0Δ,* | 5·3 ± 0·3 * | 7·2 ± 0·5 * | 6·9 ± 0·8 * | 5·3 ± 0·1 Δ , * |
| HA2 | 0Δ,* | 7·2 ± 0·5 Δ , * | 9·4 ± 0·6 Δ , * | 10·5 ± 0·3 Δ , * | 8·3 ± 0·5 Δ , * |
| PADM | 1·1 ± 0·1 * | 5·1 ± 0·3 * | 6·7 ± 0·6 * | 6·2 ± 0·1 * | 3·2 ± 0·2 * |
| TS | 2·1 ± 0·2 | 8·6 ± 0·5 | 6·4 ± 0·7 | 5·1 ± 0·2 | 3·7 ± 0·2 |
| NS | 1·7 ± 0·1 Δ | 1·6 ± 0·1 | 1·7 ± 0·1 Δ | 1·5 ± 0·1 | 1·6 ± 0·1 |
HA, hyaluronic acid; NS, normal skin; PADM, porcine acellular dermal matrix; TS, thin skin.
There was a significant difference between the PADM group and the HA1/HA2 group ( Δ P < 0·05) and there was a significant difference between the NS group and the HA1/HA2/PADM group ( * P < 0·05).
CD44 expression
On days 3 and 7, the CD44 content in the HA2 group was higher than that in the HA1 and PADM groups, with that in the HA1 group being higher than the PADM group. On day 14, the CD44 content in the HA1 and HA2 groups was lower than that in the PADM group. On day 28, the CD44 in the HA1 and PADM groups was higher than that in the HA2 group. On day 56, the CD44 in the HA1 and PADM groups was lower than that in the HA2 group. The results are shown in Table 5.
Table 5.
The mean values of CD44 in the grafted skin at different times ( , n = 10)
| Groups | Day 3 | Day 7 | Day 14 | Day 28 | Day 56 |
|---|---|---|---|---|---|
| HA1 | 2·75 ± 0·15 Δ | 2·47 ± 0·22 Δ | 2·28 ± 0·17 Δ | 3·67 ± 0·27 | 1·77 ± 0·15 |
| HA2 | 2·87 ± 0·76 Δ | 2·73 ± 0·24 Δ | 2·52 ± 0·11 Δ | 3·19 ± 0·28 Δ | 4·29 ± 0·33 Δ |
| PADM | 2·57 ± 0·19 | 2·21 ± 0·11 | 2·90 ± 0·25 | 3·60 ± 0·19 | 1·69 ± 0·14 |
| TS | 2·54 ± 0·25 | 2·62 ± 0·15 | 2·91 ± 0·75 | 2·93 ± 0·28 | 2·90 ± 0·23 |
HA, hyaluronic acid; PADM, porcine acellular dermal matrix; TS, thin skin.
The PADM group shows significant differences compared with the HA1 and HA2 groups ( Δ P < 0·05).
The CD44 content in the HA1 group was very high on day 3. It decreased gradually on days 7 and 14, increased again on day 28 and then subsequently decreased. The HA2 group had a trend similar to the HA1 group. The CD44 content appeared high on day 3, decreased gradually on days 7 and 14 and then increased on day 28. The only difference between these two groups observed on days 28 to 56 during which it kept increasing in the latter group. The CD44 content in the PADM group appeared high on day 3 (but lower than that in the HA1 or HA2 group), decreased slightly on day 7, increased slowly until day 28 and then quickly decreased. The change curves of CD44 content in different groups is shown in Figure 8.
Figure 8.
The change curves of CD44 concentration in different groups.
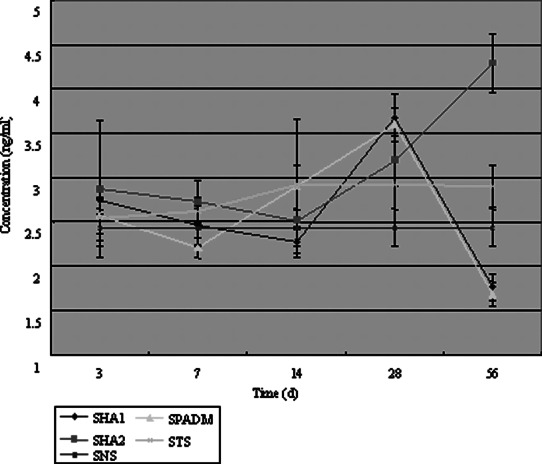
HA concentration
On day 3, the concentration of HA in the HA1 and HA2 groups was higher than that in the PADM group. On day 7, there was no significant difference among the three groups. On day 14, the HA concentration in the PADM group was higher than that in the HA1 or HA2 group. On day 28, the concentration in the HA2 was lower than that in the HA1 or PADM group. On day 56, the concentration in the HA2 group was higher than that in the HA1 or PADM group (Table 6).
Table 6.
The concentration of HA in the grafted skin in different groups ( , n = 10, ng/ml)
| Groups | Day 3 | Day 7 | Day 14 | Day 28 | Day 56 |
|---|---|---|---|---|---|
| HA1 | 1155·6 ± 96·2 Δ | 1137·5 ± 89·8 | 1038·3 ± 98·5 Δ | 1256·4 ± 96·2 | 1127·2 ± 63·5 |
| HA2 | 1195·3 ± 77·8 Δ | 1102·6 ± 99·2 | 1021·6 ± 90·7 Δ | 1193·5 ± 98·1 | 1259·6 ± 69·7 Δ |
| PADM | 1049·7 ± 89·4 | 1174·2 ± 78·5 | 1132·4 ± 86·8 | 1255·1 ± 107·6 | 1126·4 ± 98·4 |
| TS | 1097·1 ± 97·2 | 1036·3 ± 86·7 | 1129·7 ± 91·5 | 1125·7 ± 103·5 | 1112·8 ± 102·8 |
HA, hyaluronic acid; PADM, porcine acellular dermal matrix; TS, thin skin.
The PADM group shows significant differences compared with the HA1 and HA2 groups ( Δ P < 0·05).
Compared with the NS group, the concentration of HA in the HA1 group was kept stable after an increase during days 3–7. It then fluctuated during days 14–56. In the HA2 group, the concentration decreased after an increase, and was kept stable during days 7–14. It then increased from days 14 to 56. In the PADM group, the concentration increased during days 3–7, kept stable during days 7–28 and then decreased during days 28–56 (Figure 9).
Figure 9.
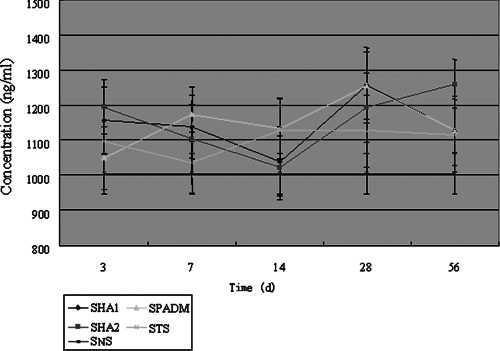
The change curves of hyaluronic acid content in different groups.
Discussion
The effect of HA on collagen types
The results of this study show that the ratios between collagen types I and III in the different groups on days 28 and 56 were as follows: TS > PADM > HA1 > HA2. Given that the influence of the implants itself was excluded, although the expression of collagen types I and III in both the HA1 and HA2 groups increased, the ratios between them were lower than those in the PADM group. The HA2 group was lower than the HA1 group (Table 7). These results suggest that HA inference can bring in better effects on the tension and elasticity of the grafted skin.
Table 7.
The differences in the grey values of collagen I and III in the grafted skin between the HA1/HA2 and PADM groups on days 28 and 56 ( , n = 10)
| Groups Collagen III | Day 28 | Day 56 | ||
|---|---|---|---|---|
| Collagen I | Collagen III | Collagen I | Collagen III | |
| Δ(HA1–PADM) | 1509·19 | 933·49 | 300·04 | 760·02 |
| Δ(HA2–PADM) | 3354·31 | 6848·97 | 1326·34 | 3396·82 |
HA, hyaluronic acid; PADM, porcine acellular dermal matrix.
In this study, collagen types I and III contained in the PADM were also determined using Western blot analysis. The results show only small amounts of collagen types I and III, which were almost negligible.
Table 7 shows that different doses of HA have different effects in promoting the formation of collagen types I and III in implants, that is, the more exogenous HA, the more collagen types I and III are produced. The table also shows that the differences between the HA1/HA2 and PADM groups on day 28 were far higher than those on day 56. Whether the weakening of the effect of HA is caused by the decreased amounts of its decomposition products or the complete loss of the HA environment remains undetermined. In addition, whether continuous administration of exogenous HA will address this requires further study.
The prescribed doses of exogenous HA in this study were five and ten times that of the HA content/per weight unit in foetal normal skin (15).
The metabolism and receptor regulation of HA during wound healing
The HA content in the PADM group in this study was tested using a radioimmunoassay; no HA was detected in the samples.
The local CD44 and HA concentrations in the experimental groups show the following characteristics: (i) the CD44 and HA concentrations in the HA1 and HA2 groups displayed similar tendencies during wound healing, and the HA concentration was positively correlated with that of CD44 and (ii) crosswise comparisons between the HA1 and HA2 groups at different time points indicated that the group with the higher CD44 content was also the one with lower local HA concentration during wound healing (from days 7 to 28); such a phenomenon lasts till day 28. Presumably, this might have been caused by the HA‐carrying effect of CD44. More HA induces the organism to produce more CD44, which in turn carries more HA to reduce the local HA concentration. Such circulation leads to the production of larger amounts of decomposition products, which generally explains the difference between the HA1 and HA2 groups in the late stages of the experiment.
The effect of HA on vascularisation
The rate of vascularisation is critical for tissue repair. In this study, no MVDs were observed in the HA1 and HA2 groups on day 3, whereas some capillaries were observed in the PADM and TS groups at the same time. This finding suggests that the addition of exogenous HA weakens the vascularisation. A similar result was also found by Slevin et al.(16). During days 7–56, the number of capillaries in the HA1 and HA2 groups increased, and the MVDs were higher than those in the PADM and TS groups. This result suggests that HA induces a mechanism to promote the proliferation of capillaries. The components produced after HA degradation promote vascularisation (17). o‐HA, with a relative molecular weight of 600–3200 kDa, promotes vascularisation in vivo and the proliferation of endothelial cells in vitro. In contrast, HA, with a higher molecular weight, inhibits vascularisation in vivo. o‐HA promotes the proliferation and migration of endothelial cells (17). This finding was also proven by Lees et al.(18). Low‐molecular‐weight HA (LMWHA) and LMWo‐HA, through their binding with CD44 and receptor for hyaluronic acid‐mediated motility (RHAMM), activate the protein kinase C signalling pathway and mitogen‐activated protein kinase signal transduction to promote endothelial cell mitosis (19). o‐HA results in collagen deposition, and LMWHA and LMW o‐HA (the relative molecular mass ranging from 600 to 2000) increase the syntheses of collagen types I and VIII. Collagen VIII is the important collagen protein that constitutes vessel walls (20). In this study, the results show that the number of capillaries initially increased in all groups, which then subsequently decreased. This finding suggests that although the repair of the early decomposition products of HA promotes vascularisation, it cannot cause hypervascularisation.
In this study, we investigated the effect of HA on composite skin graft. The TS autograft and allogeneic acellular composite skin graft were used as control, and the NS was used as the blank control, but we did not set the thick autologous skin graft group. The reasons may be that composite skin graft is the thin autologous skin cut and covered with the PADM wound, where the tissue organisation is entirely different from the thick autologous skin graft and the comparison of cytokines and collagen has no significance. In clinical practice, to reduce the secondary injury for skin defect patients, complex skin grafts are widely used.
Conclusions
The addition of exogenous HA during PADM composite grafting relieves the contracture of skin grafts on wound surfaces and optimises the ratio between collagen proteins I and III. Moreover, HA stimulates the production of more CD44 receptors and strengthens its enzymolysis. The obtained metabolites may play a role in improving the effects of composite grafting by promoting vascularisation, increasing collagen I and III expression and decreasing the ratio between collagen types I and III.
References
- 1. Sun T, Han Y, Chai J, Yang H. Transplantation of microskin autografts with overlaid selectively decellularized split‐thickness porcine skin in the repair of deep burn wounds. J Burn Care Res 2011; 32:67–73. [DOI] [PubMed] [Google Scholar]
- 2. Adzick NS, Lorenz HP. Cells, matrix, growth factors, and the surgeon. The biology of scarless fetal wound repair. Ann Surg 1994; 220:10–8. [DOI] [PMC free article] [PubMed] [Google Scholar]
- 3. Day AJ, de la Motte CA. Hyaluronan cross‐linking: a protective mechanism in inflammation? Trends Immunol 2005;26:637–43. [DOI] [PubMed] [Google Scholar]
- 4. Day AJ, Sheehan JK. Hyaluronan: polysaccharide chaos to protein or ganisation. Curr Opin Struct Biol 2001;11:617–22. [DOI] [PubMed] [Google Scholar]
- 5. Ella Z, Benjamin G, Lia A. Initial stages of cell‐matrix adhesion can be mediated and modulated by cell‐surface hyaluronan. Biophysical 2002;82:1848–57. [DOI] [PMC free article] [PubMed] [Google Scholar]
- 6. Tan Q, Zou ZT, Ning GS, Lin ZH, Liang HR, Chen X, Wu JM. Preparation of porcine acellular dermal matrix by low concentration of trypsin digestion and repeated freeze‐thaw cycles. Chin J Burn 2004;20:354–6. [PubMed] [Google Scholar]
- 7. Chen JY, Wei H. Study on expression and distribution of several proteins and extracellular matrix in acellular dermal matrix. Chin J Mod Med 2008;18:1834–40. [Google Scholar]
- 8. Takahashi Y, Li L, Kamiryo M, Moustakas A, Yamashita H, Heldin P. Hyaluronan fragments induce endothelial cell differentiation in a CD44‐and CXCL1/GRO1‐dependent manner. J Biol Chem 2005;280:24195–204. [DOI] [PubMed] [Google Scholar]
- 9. Noble PW. Hyaluronan and its catabolic products in tissue injury and repair. Matrix Biol 2002;21:25–9. [DOI] [PubMed] [Google Scholar]
- 10. Tahar S, Mustapha A, Sitaraman S, Madara JL. Negative regulation of epithelium neutrophil interactions via activation of CD44. Am J Physiol Cell Physiol 2001;280:423–32. [DOI] [PubMed] [Google Scholar]
- 11. Sherman L, Sleeman J, Herrlich P, Ponta H. Hyaluronate receptors: key players in growth, differentiation, migration and tumor progression. Curr Opin Cell Biol 1994;6:726–33. [DOI] [PubMed] [Google Scholar]
- 12. Fraster JR, Laurent TC, Laurent UB. Hyaluronan: its nature, distribution, functions and turnover. J Intern Med 1997;242:27–33. [DOI] [PubMed] [Google Scholar]
- 13. Weigel JA, Raymond RC, McGary C, Singh A, Weigel PH. Ablocking antibody to the hyaluronan receptor for endocytosis (HARE) inhibits hyaluronan clearance by perfused liver. J Biol Chem 2003;278:9808–12. [DOI] [PubMed] [Google Scholar]
- 14. Pareek G, Shevehuk M, Amenakas NA, Vasjovic L, Hochberg DA, Basillote JB, Fracchia JA. The effect of finasteride on the expression of vascular endothelial growth factor and microvessel densit: a possible mechanism for decreased prostatic bleeding in treated patients. J Urol 2002;169:20–3. [DOI] [PubMed] [Google Scholar]
- 15. Song HF, Chai JK, Lin ZH, Liu NF, Chen ML, Zhao YZ, Chen BJ, Song ZY. Expression of hyaluronic acid and its receptor in the process of wound healing in different skin tissues and its significance. Natl Med J Chin 2003;83:1070–4. [PubMed] [Google Scholar]
- 16. Slevin M, West D, Kumar P. Hyaluronan, angiogenesis and malignant disease. Int J Cancer 2004;109:793–4. [DOI] [PubMed] [Google Scholar]
- 17. Sattar A, Rooney P, Kumar S, Pye D, West DC, Scott I, Ledger P. Application of angiogenic oligosaccharides of hyaluronan increases blood vessel numbers in rat skin. Invest Dermatol 1994;103: 576–9. [DOI] [PubMed] [Google Scholar]
- 18. Lees VC, Fan T‐PD, West DC. Angiogenesis in a delayed revascularization model is accelerated by angiogenic oligsaccharides of hyaluronan. Lab Invest 1995;73:259–66. [PubMed] [Google Scholar]
- 19. Slevin M, Kumar S, Gaffney J. Angingenic oligosaccharides of hyaluronan induce multiple signaling pathways affecting vascular endothelial cell mitogenic and wound healing responses. J Biol Chem 2002;277:41046–59. [DOI] [PubMed] [Google Scholar]
- 20. Rooney P, Wang M, Kumar P, Kumar S. Angiogenic oligosaccharides of hyaluronan enhance the production of collagens by endothelial cells. J Cell Sci 1993;105:213–8. [DOI] [PubMed] [Google Scholar]