Abstract
PURPOSE:
To develop a multiscale analysis framework for investigating the relationships between geographic atrophy (GA) growth rate and choriocapillaris (CC) blood flow impairment using optical coherence tomography (OCT) and OCT angiography (OCTA).
DESIGN:
Retrospective case series.
METHODS:
We developed an OCT/OCTA analysis framework that quantitatively measures GA growth rates at global and local scales and CC impairment at global, zonal, and local scales. A geometric GA growth model was used to measure local GA growth rates. The utility of the framework was demonstrated on 7 eyes with GA imaged at 2 time points using a prototype 400-kHz, 1050-nm swept-source OCTA system.
RESULTS:
Qualitatively, there was a trend of increasing GA growth rate with increasing CC impairment. The local analysis model enabled growth rates to be estimated at each point on the GA boundary. However, there was no generally observed trend between local GA growth rates and local CC impairment.
CONCLUSIONS:
The global, zonal, and local analysis framework may be useful for investigating relationships between GA growth and CC impairment at different spatial scales. The geometric GA growth model enables spatially resolved growth measurements that capture the anisotropy of GA growth and may improve the characterization of GA progression.
Geographic atrophy (ga), the nonexudative form of advanced age-related macular degeneration (AMD), is characterized by progressive loss of the photoreceptors, retinal pigment epithelium (RpE), and choriocapillaris (CC). At present, the pathogenesis of AMD remains incompletely understood, with both the RpE and CC being implicated as the primary site of injury.1-4 While the relationship between RPE impairment and GA growth has been extensively studied—the RPE is easily visualized on structural optical coherence tomography (OCT)—systematic, quantitative evaluation of the CC in vivo has proven more difficult. In particular, dye-based angiography, the standard method for visualizing ocular blood flow, is not well suited for CC imaging. Nonetheless, in addition to providing insights into pathogenesis, CC evaluation is of interest in GA-related clinical trials where the CC is a candidate biomarker for stratifying patients into rapid-progressor and slow-progressor cohorts.
The recent development of OCT angiography (OCTA) provides clinicians with a noninvasive modality for rapidly visualizing ocular vasculature.5,6 Compared with dye-based angiography, OCTA has several advantages: it is depth resolved, allowing different vascular plexuses to be distinguished; it is noninvasive, allowing imaging to be performed on each patient visit; it does not suffer from obscuring dye leakage; and it is intrinsically coregistered with OCT data, enabling joint assessment of structure and blood flow. While these advantages make OCTA a promising modality for CC imaging, first-generation commercial OCTA instruments use 850-nm wavelength light sources, which, because of attenuation from ocular opacities and the RPE,7,8 can suffer from low OCT signal artifacts in CC.9-11 Recently, this limitation has been mitigated by the increased availability of swept-source OCTA (SS-OCTA) instruments using 1050-nm wavelength light sources, which are less susceptible to ocular opacities and better penetrate the RPE.7,8
Previous OCTA studies have observed CC blood flow impairment (CC impairment) in GA eyes, both under the areas of atrophy and inhomogeneously around the GA margins.12-15 Several questions arise from these observations: 1) Is global CC impairment correlated with global GA growth rate? 2) Is CC impairment in zones adjacent to the GA margin more correlated with global GA growth rate than is CC impairment in zones farther from the margin? 3) Is local CC impairment correlated with local GA growth rate? Motivated by these questions, this study presents an OCT/OCTA analysis framework for quantitative assessment of the relationships between CC impairment and GA growth rates at global, zonal, and local spatial scales. We demonstrate the utility of this framework using a small retrospective case series of GA eyes imaged with a 400-kHz SS-OCTA prototype instrument. Because of its limited enrollment, this study does not attempt to answer the motivating questions but rather to develop an analysis framework that can be used by future studies with larger enrollments.
METHODS
this was a retrospective case series study conducted at the New England Eye Center of Tufts Medical Center. The study was approved by the institutional review boards at Tufts Medical Center and the Massachusetts Institute of Technology, adhered to the tenets of the Declaration of Helsinki, and complied with the Health Insurance Portability and Accountability Act of 1996. Written informed consent was obtained before imaging. Patients with GA, defined as complete RPE and outer retinal atrophy on structural OCT, and no other macular pathology, were recruited and imaged at baseline and follow-up visits during a 3-year period (June 2014–December 2016). For patients with >2 visits, baseline and follow-up visits were selected according to image quality and length of followup, with longer follow-up periods being preferred. Each subject underwent a complete ophthalmic examination, including a detailed history, refraction, intraocular pressure measurement, anterior segment examination, and a dilated fundus examination by a retinal specialist. Eyes with non–visually significant vitreoretinal interface disease, such as a subtle epiretinal membrane only visible by OCT, were not excluded. Eyes with myopia >6 diopters and/or significant media opacities were excluded.
The general methodology of this study was to correlate measures of GA growth with OCTA measures of CC impairment. This general methodology is outlined in Figure 1, with detailed discussions provided below. Readers who are not interested in the methodologic details can gain sufficient understanding from Figure 1 and Table 1.
FIGURE 1.

Overview of acquisition, processing, and analysis workflow. Acquisition and processing yield optical coherence tomography (OCT) data that are used to trace the baseline and follow-up geographic atrophy (GA) margins and OCT angiography (OCTA) data that are used to generate baseline and follow-up registration fiducials and baseline choriocapillaris (CC) OCTA slabs. The baseline CC OCTA slabs, along with the baseline GA geometry are used to perform CC impairment analysis at global, zonal, and local scales. The baseline and follow-up GA geometries are used to perform GA growth analysis at global and local scales. The CC impairment metrics and the GA growth metrics are then correlated to assess potential relationships. Details of acquisition, processing, and analysis are provided in the Methods section, and an overview of the CC impairment and GA growth metric is shown in Table 1.
TABLE 1.
Description of Choriocapillaris Impairment and Geographic Atrophy Growth Metrics
| Parameter | Metric | Description |
|---|---|---|
| CC impairment analysis | ||
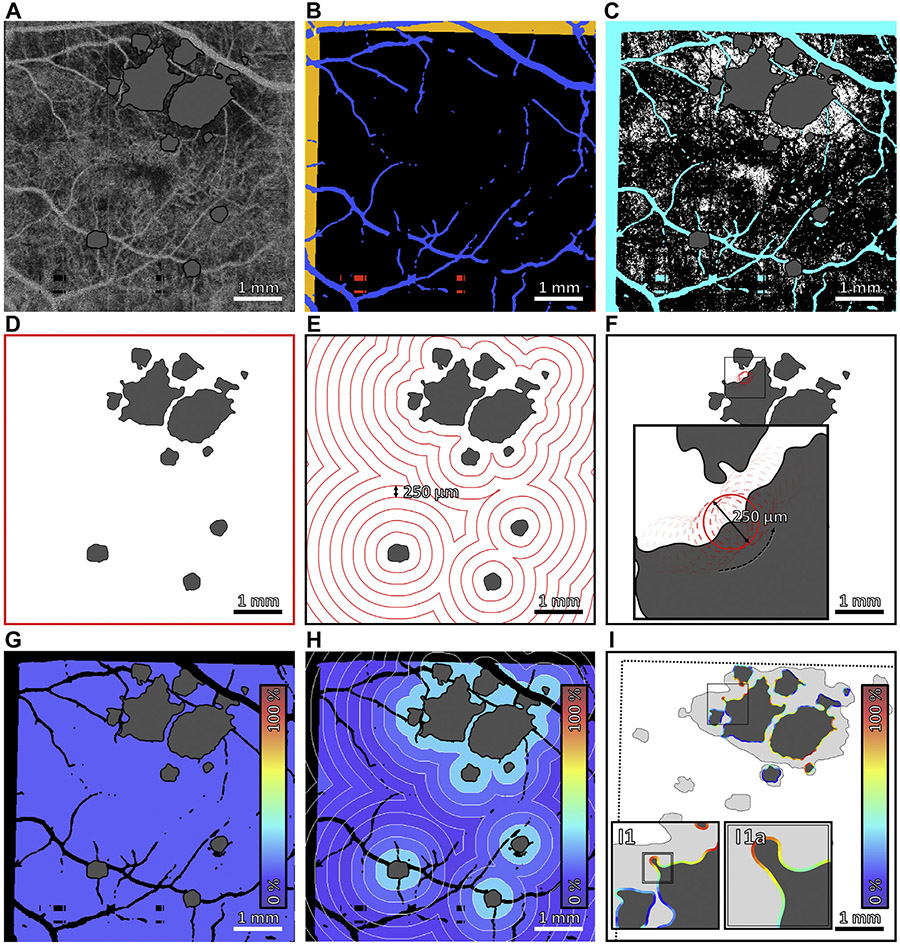
| Global CC impairment | Global flow deficit percentage (%) | Global CC impairment was measured by computing the CC OCTA flow deficit percentage over the entire field-of-view, excluding artifacts and lesion interiors (Figure 2D) |
| Zonal CC impairment | Iso-distance zonal flow deficit percentage (%) | Zonal CC impairment was measured by computing the CC OCTA flow deficit percentage within iso-distance zones, excluding artifacts and lesion interiors. Iso-distance zones were delimited by contours positioned at equally spaced distances from the GA margin in steps of 250-μm (Figure 2E). For multifocal lesions, iso-distance zones from different lesion components were combined |
| Local CC impairment | Local flow deficit percentage (%) | Local CC impairment was measured by computing, for each point along the baseline GA margin, the CC OCTA flow deficit percentage within a 250-μm diameter disk centered at that point, excluding artifacts and lesion interiors (Figure 2F) |
| GA growth analysis | ||
| Global GA growth rate | Square root area growth rate (mm/year) | The square root area growth rate (Figure 3B) was defined as: |
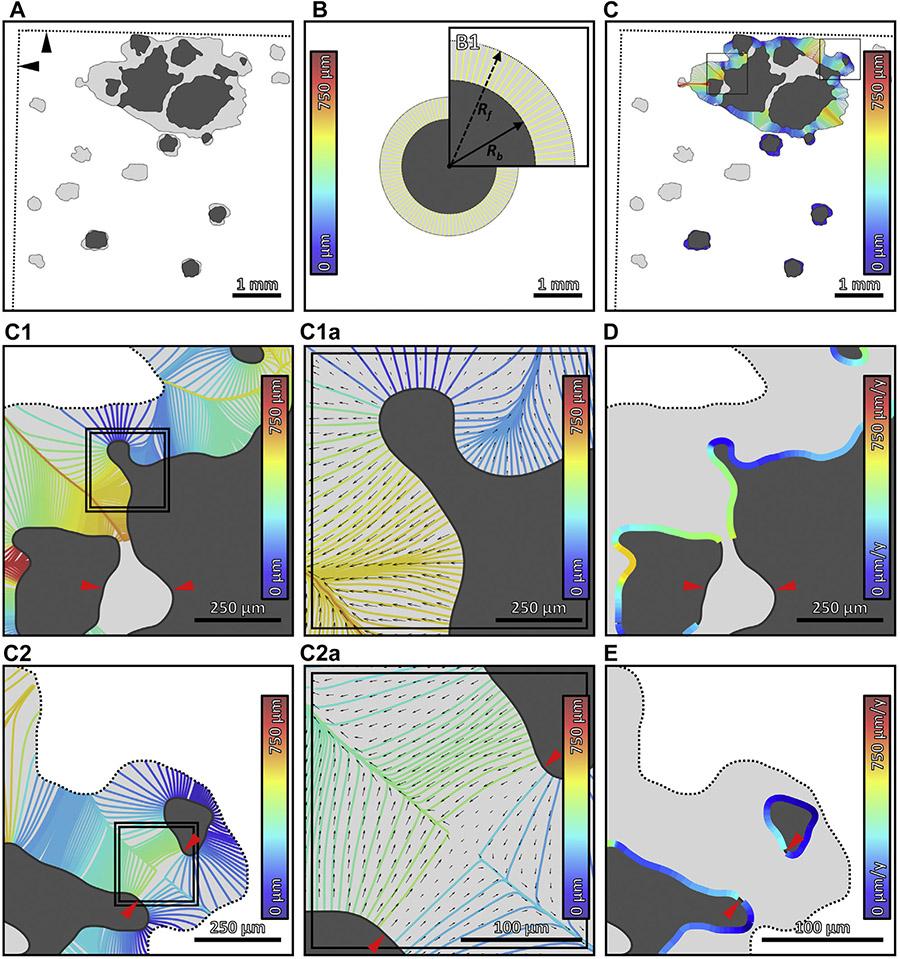
| Local GA growth rate | Growth trajectory Analysis (mm/year) | For each point on the baseline margin, the local GA growth rate was computed as the length of that point’s growth trajectory divided by the intervisit time, as described in the Methods section and Figure 3C-E |
CC = choriocapillaris; GA = geographic atrophy; OCTA = optical coherence tomography angiography.
• OCT IMAGING:
All eyes were imaged with a prototype 400-kHz SS-OCT instrument operating at a wavelength of ~ 1050-nm. The full-width-at-half-maximum axial and transverse optical resolutions were ~9-μm and 20μm in tissue, respectively. OCT volumes were acquired over 6-mm × 6-mm fields-of-view, using a raster of 500 A-scans per B-scan and 5 repeated B-scans per position, with 500 B-scan positions per volume, corresponding to an isotropic 12-μm transverse spatial sampling period. The fundamental interscan time—the time between repeated B-scans—was 1.5-ms. This interscan time, which is shorter than those used in current commercial OCTA instruments, facilitates the detection of flow impairment using variable interscan time analysis (VISTA).12,16
• OCTA PROCESSING:
OCTA volumes corresponding to 1.5-ms and 3.0-ms interscan times were generated using pairwise, amplitude decorrelation VISTA.12,16 In particular, 1.5-ms interscan time OCTA volumes were generated by averaging OCTA data computed using decorrelation of temporally adjacent B-scans (B-scan 1 ↔ B-scan 2, B-scan 2 ↔ B-scan 3, B-scan 3 ↔ B-scan 4, and B-scan 4 ↔ B-scan 5), while 3.0-ms interscan time OCTA volumes were generated by averaging OCTA data computed using decorrelation of every other B-scan (B-scan 1 ↔ B-scan 3, B-scan 2 ↔ B-scan 4, and B-scan 3 ↔ B-scan 5). To avoid the possibility of thresholding artifacts, we used unthresholded OCTA volumes for quantitative analysis.17 Unthresholded OCTA images have noise fluctuations (high OCTA values) in regions with low OCT signal (eg, vitreous or deep choroid) but ensure that the absence of an OCTA signal corresponds to a true flow deficit rather than an attenuation (shadowing) artifact.
• SEGMENTATION:
Because the CC is extremely thin, manual segmentation was used to avoid potential artifacts/errors that can occur with automatic segmentation. For every fifth B-scan location, the Bruch membrane was manually traced (using the Wacom Cintiq Pro 24 [Wacom Co, Ltd, Kazo, Saitama, Japan]) on the OCT B-scan. The location of the Bruch membrane on the remaining B-scans was found by 2-dimensional linear interpolation of the manually segmented data. Linear interpolation was a viable method of segmentation propagation because motion artifacts were compensated by software motion correction, as described below.
• ARTIFACTMANAGEMENT:
Motion artifacts.
Orthogonally scanned (horizontal-fast/“x-fast” and vertical-fast/“y-fast”) raster volumes were acquired for each eye. These 2 orthogonal volumes were then registered and merged using a previously published software motion correction technology, which is similar to the method used in Optovue instruments (Optovue, Inc, Fremont, CA).18-20 Briefly, this software estimates and corrects motion for individual A-scans in all 3 dimensions, and then merges the 2 motion corrected volumes to increase signal and reduce noise. Areas with residual motion artifacts were automatically identified and excluded from analysis (Figure 2B).
FIGURE 2.
Multiscale choriocapillaris (CC) impairment analysis. (A) 1.5-ms interscan time CC optical coherence tomography angiography (OCTA) slab, with areas of geographic atrophy (GA) colored gray. (B) Regions excluded from analysis. Orange indicates regions of the baseline field-of-view that are not within the follow-up field-of-view. Blue indicates projection artifacts from larger retinal vessels. Red indicates missing data caused by eye motion. (C) CC flow deficit image, computed by binarizing the CC OCTA slab in panel A. Flow deficits are shown in white, and teal indicates excluded regions (panel B); the area of GA, colored gray, is also excluded from analysis. (D–F) Boundaries of global, zonal, and local analyses. (G–I) Outputs of global, zonal, and local analyses. Colors correspond to CC flow deficit percentages, as specified by the color bars. In global analysis, the mean CC flow deficit percentage is computed over the entire field-of-view; a single percentage is assigned to the entire image. In zonal analysis, the mean CC flow deficit percentage is computed within 250-μm–wide concentric zones centered on the GA margin; a percentage is assigned to each zone. In local analysis, for each point along the GA margin, the mean CC flow deficit percentage is computed within a 250-μm diameter neighborhood; a percentage is assigned to each point along the margin.
Projection artifacts.
Regions with OCTA projection artifacts were excluded from analysis by automatically masking large retinal vasculature using a projection of the OCTA volume through the RPE. In particular, an image emphasizing the larger retinal vessels was created by median projection of the OCTA volume from 45-μm anterior to the Bruch membrane to the Bruch membrane. Morphologic operations were used to create a vessel mask in order to exclude CC areas underlying large vessels (Figure 2B).
• LESION TRACING AND REGISTRATION:
Baseline and follow-up GA margins were manually traced by an experienced reader (A.Y.A.) using an en face sub-RPE OCT slab formed by mean projection of the OCT volume from the Bruch membrane to 340-μm posterior to the Bruch membrane. Measurements of GA areas using sub-RPE OCT slabs have been shown to correlate well with those performed using fundus autofluorescence (FAF).21-23 FAF images were consulted in regions where the lesion extent was ambiguous on the sub-RPE OCT slab. The reader was blinded to the CC OCTA images during lesion tracing to prevent bias. Tracings from the baseline and follow-up visits were spatially aligned by manually selecting a set of corresponding fiducial points for each of the 2 visits and then automatically rigidly (rotation and translation) registering the fiducial points using the iterative closest point (ICP) algorithm.24 The fiducial points were chosen at bifurcations of retinal vessels on an en face retinal OCTA image. Registration quality was confirmed by overlaying the 2 registered data sets. CC impairment analysis was performed on a field-of-view restricted to the intersection of the fields-of-view of the baseline and follow-up visits; for local growth analysis, lesion tracings were cropped according to the intersection of the 2 fields-of-view. The lesion tracings of the baseline visit were also cropped to be inside the lesion tracings of the follow-up visit, mitigating the effects of small tracing inaccuracies.
• GLOBAL, ZONAL, AND LOCAL ANALYSIS OF CC IMPAIRMENT:
CC impairment was assessed at global, zonal, and local scales (Figure 2). Specifically, CC OCTA slabs were formed by median projection of the unthresholded OCTA volumes from the Bruch membrane to ~45-μm posterior to the Bruch membrane (Figure 2A). The ~ 45-μm projection range, which is larger than that anatomically occupied by the CC, was chosen to make the analysis less sensitive to small segmentation inaccuracies—this strategy works because the CC blood flow produces an OCTA projection signal that persists in the underlying regions. CC OCTA flow deficit images were then computed by binarizing the CC OCTA slabs using a fixed, empirically determined binarization level (Figure 2C)—that is, pixels with OCTA values below the binarization level were interpreted as flow deficits.25 The binarization level—0.21 on an OCTA range of [0,1]—was determined from a separate analysis of healthy eyes performed prior to this study. The rationale for using a fixed binarization level, rather than an adaptive level, is described in Appendix 1. The CC flow deficit percentage was computed at global, zonal, and local scales (Figure 2D-I) from the CC flow deficit images using the metrics described in Table 1. Note that in computing the CC flow deficit percentage, regions of artifacts and GA were excluded. Moreover, as mentioned previously, regions not contained within the fields-of-view of both the baseline and follow-up visits were excluded. Finally, for case 2, there were two strips (~ 13% of the field-of-view) of invalid OCT/OCTA data, which occurred because of OCT scanner error and uncompensated eye motion, and these were excluded.
• GLOBAL AND LOCAL ANALYSIS OF GA GROWTH RATES:
GA growth rates were assessed at global and local scales (Figure 3). Global growth rates were computed using the square root area approach,22,26 as described in Table 1. The square root convention was chosen in order to reduce the effect of varying baseline lesion areas.22,26 A limitation of global analysis is that it is not spatially resolved and therefore does not capture the anisotropy of GA growth. To address this limitation, we introduce the concept of a (local) growth trajectory: the path along which a hypothetical point on the baseline GA margin travels to reach a point on the follow-up GA margin. In the case of a single circular lesion growing at a constant, isotropic rate, the growth trajectories are straight lines, perpendicular to the lesion boundary (Figure 3B). When lesions have more complex geometries or multiple components, growth trajectories become more complex (Figure 3C). A detailed discussion of the model used to compute the growth trajectories is given in Appendices 2 and 3. Growth trajectories are particularly useful because they allow the average local growth rate to be computed as the growth trajectory length divided by the intervisit time (Table 1, Figure 3D, E).
FIGURE 3.
Multiscale growth analysis of geographic atrophy (GA). (A) GA lesion at baseline (dark gray) and follow-up (light gray). The straight dotted lines (indicated by black arrowheads) demarcate the boundary of the follow-up field-of-view (see Figure 2B). (B) Graphic representation of the square root area GA growth metric; panel B1 is an enlargement. The inner and outer circles have areas equal to the baseline and follow-up GA lesions, respectively. Global GA growth analysis implicitly assumes that the lesion grows outward at equal rates in all directions. Thus, the effective growth trajectories in global analysis, which connect the baseline and follow-up circles, are the same length in all directions (yellow lines; color corresponds to the growth trajectory length, as specified by the color bar). The square root area growth rate is proportional to the length of these growth trajectories, or, equivalently, the difference in radii—Rf and Rb—of the circles. (C) Local GA growth analysis. The growth trajectories, which are computed using a geometric model of GA growth (Appendices 2 and 3), connect the baseline and follow-up lesions, and are colored according to their lengths (see color bars). (C1, C2) Enlargements of panel C. (C1a, C2a) Enlargements of panels C1 and C2, respectively. In addition to growth trajectories, panels C1a and C2a show the local growth velocity as a vector field (black arrows); arrow lengths are proportional to growth rates, and arrow directions indicate growth directions. (D, E) Growth trajectories of panels C1 and C2 mapped into local growth rates along the GA margin, respectively (see color bars). Red arrowheads in panels C1, C2, C2a, D, and E indicate GA margin segments that were directly involved in merging during GA growth, and which were excluded from the analysis (Appendix 2). y = year.
RESULTS
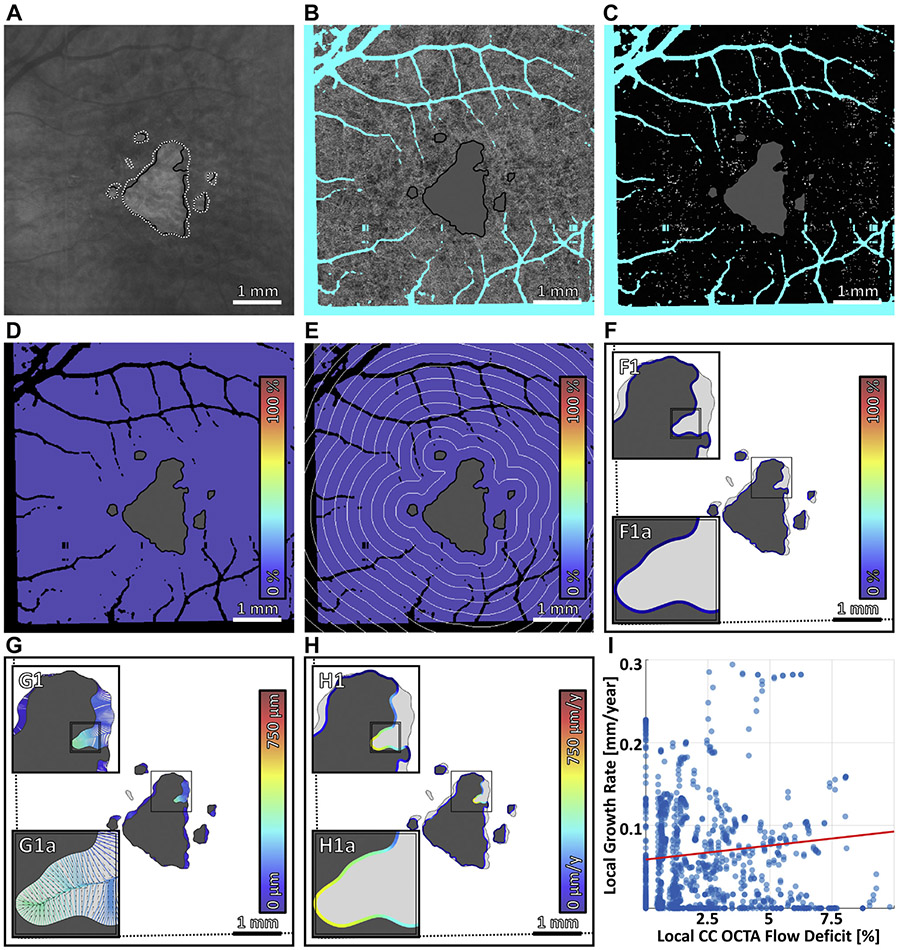
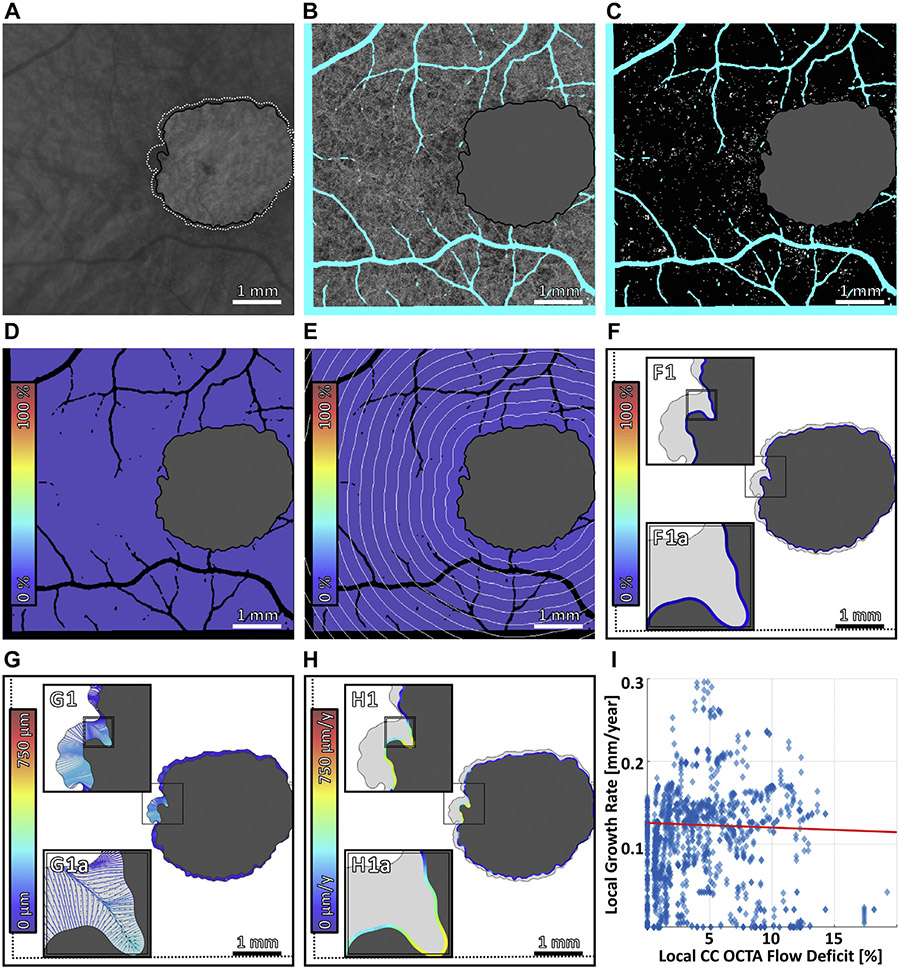
seven eyes from 5 patients were included in the study (Table 2). Figure 4-7 show analyses of cases 1, 4, 5, and 7, which correspond to the lesions with the slowest and fastest global square root area growth rates in the multifocal and unifocal groups, respectively. Figure 8 displays scatter plots of the global GA growth rates versus global (Figure 8A) and zonal (Figure 8B-H) CC impairments.
TABLE 2.
Subject Descriptions
| Case No. | Age (y) | Lesion Location |
Baseline VA | Intervisit Time (months) |
Follow-Up VA |
Lesion Area at Baseline (mm2) |
Lesion Area at Follow-Up (mm2) |
Global Area Growth Rate (mm2/year) |
Global Square Root Area Growth Rate (mm/year) |
|---|---|---|---|---|---|---|---|---|---|
| Multifocal | |||||||||
| 1 | 80 | F | 20/50 | 9 | 20/100 | 1.83 | 2.18 | 0.48 | 0.17 |
| 2a | 86 | EF | 20/30 | 16 | 20/40 | 0.59 | 2.06 | 1.10 | 0.50 |
| 3 | 72 | EF | 20/70 | 22 | 20/70 | 7.31 | 13.66 | 3.46 | 0.54 |
| 4a | 86 | F | 20/100 | 16 | 20/200 | 3.15 | 6.62 | 2.60 | 0.60 |
| Mean ± SD | 81.0 ± 6.6 | 20/63 | 15.7 ± 5.4 | 20/103 | 3.22 ± 2.92 | 6.13 ± 5.45 | 1.91 ± 1.36 | 0.45 ± 0.19 | |
| Unifocal | |||||||||
| 5 | 73 | EF | 20/30 | 10 | 20/25 | 0.05 | 0.07 | 0.03 | 0.06 |
| 6b | 70 | F | 20/100 | 7 | 20/100 | 6.14 | 6.53 | 0.67 | 0.13 |
| 7b | 70 | F | 20/100 | 7 | 20/100 | 5.91 | 6.53 | 1.10 | 0.22 |
| Mean ± SD | 71.0 ± 1.7 | 20/77 | 8.1 ± 2.1 | 20/75 | 4.03 ± 3.45 | 4.38 ± 3.73 | 0.60 ± 0.54 | 0.14 ± 0.08 |
EF = extrafoveal; F = foveal; SD = standard deviation; VA = visual acuity.
Eyes from the same patient.
FIGURE 4.
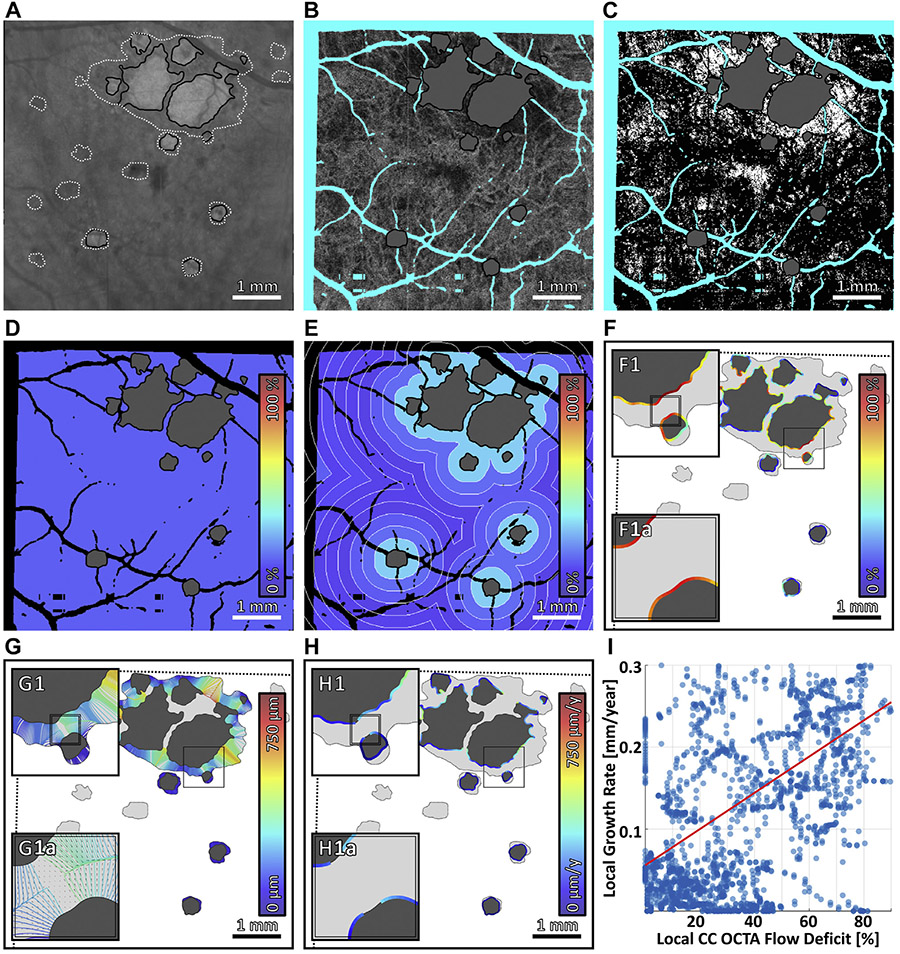
Multiscale analysis of choriocapillaris (CC) impairment and geographic atrophy (GA) growth in case 1, the slowest growing multifocal lesion. (A) Baseline sub–retinal pigment epithelium optical coherence tomography angiography (OCTA) slab. The baseline and follow-up GA margins are delineated by the solid black and dashed white contours, respectively. (B) Baseline CC OCTA slab (1.5-ms interscan time). Artifacts are shown in teal and are excluded from analysis (see Figure 2B); the region of baseline GA is colored gray, and is also excluded from analysis. (C) CC flow deficit image, formed by binarizing the CC OCTA slab of panel B (white pixels indicate flow deficits). (D–F) Flow deficit percentage analyzed at global, zonal, and local scales, respectively (see Figure 2). (G) Growth trajectories. (H) Local growth rates. (I) Scatterplot of the local growth rate of panel H vs the local CC impairment of panel F, with linear regression line (red). Note that the x axis scale differs for Figure 4-7.
FIGURE 7.
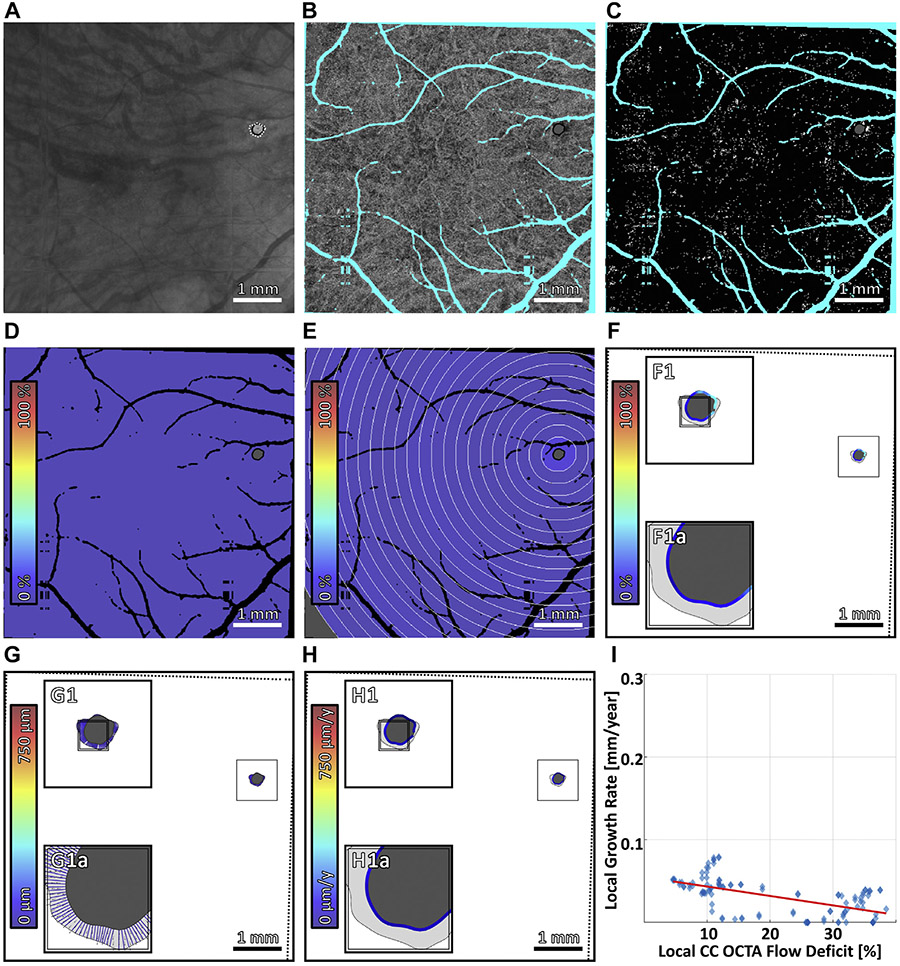
Multiscale analysis of choriocapillaris (CC) impairment and geographic atrophy (GA) growth in case 7, the fastest growing unifocal lesion. (A) Baseline sub–retinal pigment epithelium optical coherence tomography angiography (OCTA) slab. The baseline and follow-up GA margins are delineated by the solid black and dashed white contours, respectively. (B) Baseline CC OCTA slab (1.5-ms interscan time). Artifacts are shown in teal and are excluded from analysis (see Figure 2B); the region of baseline GA is colored gray, and is also excluded from analysis. (C) CC flow deficit image, formed by binarizing the CC OCTA slab of panel B (white pixels indicate flow deficits). (D–F) Flow deficit percentage analyzed at global, zonal, and local scales, respectively (see Figure 2). (G) Growth trajectories. (H) Local growth rates. (I) Scatterplot of the local growth rate of panel H vs the local CC impairment of panel F, with linear regression line (red). Note that the x axis scale differs for Figure 4-7.
FIGURE 8.
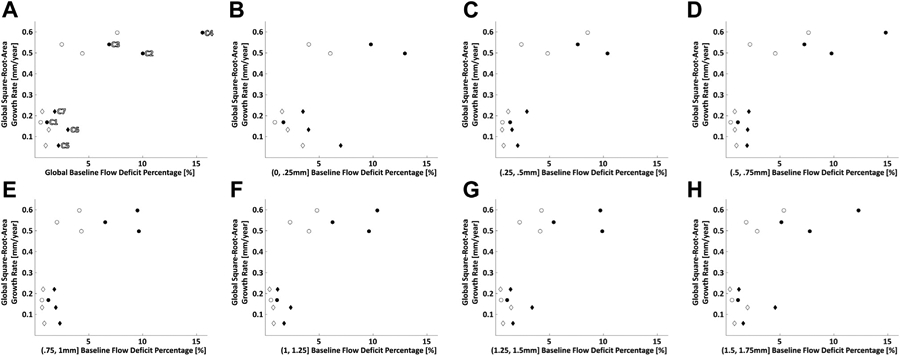
Scatterplots of global geographic atrophy (GA) growth rate vs global and zonal baseline choriocapillaris (CC) impairment. (A) Scatterplot of global GA growth rate vs global baseline CC flow deficit percentage. (B–H) Scatterplots of global GA growth rate vs zonal baseline CC flow deficit percentage in 250-μm-wide zones; each scatterplot corresponds to zones located at a particular distance away from the GA margin, as specified by the x axis labels. For all plots, circular markers indicate multifocal lesions and diamond markers indicate unifocal lesions; filled markers correspond to 1.5-ms interscan time CC optical coherence tomography angiography (OCTA) slabs, and open markers correspond to 3.0-ms interscan time CC OCTA slabs. In panel A, cases 1 through 7 are labeled C1 through C7, respectively.
DISCUSSION
in this study we developed an oct/octa analysis framework to quantitatively assess relationships between CC impairment and GA growth rates at global, zonal, and local scales. The rationale for multiscale spatial analysis (Table 3) is motivated by the following questions: 1) is global CC impairment correlated with global GA growth rate?; 2) is CC impairment in zones adjacent to the GA margin more correlated with global GA growth rate than is CC impairment in zones farther from the margin?; and 3) is local CC impairment correlated with local GA growth rate? While the characteristics of our case series (eg, small enrollment and heterogenous follow-up period) preclude our study from answering these questions, we believe that it is valuable to qualitatively discuss the results of our case series.
TABLE 3.
Comparison of Different Spatial Scales of Choriocapillaris Impairment and Geographic Atrophy Growth Analysis
| Scale | Metric | Advantages | Disadvantages |
|---|---|---|---|
| Global | Global flow deficit percentage | • Simplicity • Incorporates CC impairment from entire field-of-view |
• Does not capture inhomogeneity of CC impairment |
| Square root area growth rate | • Simplicity | • Does not capture anisotropy of GA growth | |
| Zonal | Iso-distance zonal flow deficit percentage | • Incorporates CC impairment information from entire field-of-view • Captures inhomogeneity of CC impairment along one dimension (distance from the GA margin) |
• Does not capture inhomogeneity of CC impairment along the GA margin |
| Local | Local flow deficit percentage | • Captures inhomogeneity of CC impairment along the GA margin | • Only incorporates CC impairment from within the immediate neighborhood of the GA margin |
| Growth trajectory analysis | • Captures anisotropy of GA growth | • Complexity • Multiple model parameters |
CC = choriocapillaris; GA = geographic atrophy.
Regarding the first question, our data show a trend of increasing global GA growth rate with increasing global baseline CC impairment (Figure 8A). If this trend holds in future studies, global CC impairment, a parameter easily derived from the CC slab of commercial OCTA instruments, may be a useful biomarker for risk-stratifying patients into slow-progressor and fast-progressor subgroups. Regarding the second question, for each evaluated zone, our data show a trend of increasing global GA growth rate with increasing zonal baseline CC impairment (Figure 8B-H). Finally, regarding the third question, our data show mixed trends (Figure 4-7), with only 1 case exhibiting a clear trend of increasing local GA growth rate with increasing local CC impairment; interestingly, that case (case 4; Figure 5) also had the fastest growing lesion and most severe CC impairment.
FIGURE 5.
Multiscale analysis of choriocapillaris (CC) impairment and geographic atrophy (GA) growth in case 4, the fastest growing multifocal lesion. (A) Baseline sub–retinal pigment epithelium optical coherence tomography angiography (OCTA) slab. The baseline and follow-up GA margins are delineated by the solid black and dashed white contours, respectively. (B) Baseline CC OCTA slab (1.5-ms interscan time). Artifacts are shown in teal and are excluded from analysis (see Figure 2B); the region of baseline GA is colored gray, and is also excluded from analysis. (C) CC flow deficit image, formed by binarizing the CC OCTA slab of panel B (white pixels indicate flow deficits). (D–F) Flow deficit percentage analyzed at global, zonal, and local scales, respectively (see Figure 2). (G) Growth trajectories. (H) Local growth rates. (I) Scatterplot of the local growth rate of panel H vs the local CC impairment of panel F, with linear regression line (red). Note that the x axis scale differs for Figure 4-7.
There are several important caveats that should be noted when interpreting our observations: 1) the number of cases studied was small and heterogeneous, and our observations could be influenced by baseline GA area, lesion focality, severity of baseline CC impairment, growth rate, or other details of GA pathology; (2) although having been extensively used as a metric of CC alteration,25,27-31 CC flow deficit percentage, or OCTA-derived metrics more generally, may not provide a sufficiently sensitive or specific measure of the true physiological CC blood flow; (3) the times between the baseline and follow-up visits were heterogeneous and all ≥7 months; and, (4) our small enrollment precludes statistical analyses, so our observations are limited to qualitative descriptions.
The CC and RPE are known to have a mutual relationship4; however, it remains a topic of debate whether GA progresses from initial CC impairment to RPE impairment, or vice versa.1-4 Histopathology studies by McLeod et al. found a linear relationship between CC loss and RPE loss in GA, and a 50% decrease of CC vascular area within regions of complete RPE atrophy.1,2 From these results, they concluded that the RPE was the initial site of injury. In contrast, an electron microscopy study of areas transitioning between different stages of RPE impairment led Biesemeier et al. to conclude that the CC was the initial site of injury. As noted previously, OCTA has been used to visualize CC impairment beyond the GA margin.12-15 Moreover, CC impairment, as assessed by OCTA, has been reported to occur in FAF iso-autofluorescent regions adjacent to the lesion margin, as well as in regions of nascent GA and drusen-associated geographic atrophy.32-34
Of the 7 eyes examined, only 1 case (case 4) showed a clear trend of increasing local GA growth rate with increasing CC impairment. If local CC impairment were directly causal in the local growth of GA, we might expect that the other cases would also show a trend of increasing local GA growth rate with increasing CC impairment. However, the previously listed limitations mean that our observations do not preclude local causality. Furthermore, even if the CC were not the primary causative driver of GA locally, global CC impairment might still be the primary event in GA development. For example, a distributed, global CC impairment may cause RPE/photoreceptor impairment, which then drives local atrophy development. Alternatively, noting the trend observed in case 4, the causal roles of the RPE and CC may vary as a function of disease phenotype or stage (eg, local CC impairment being correlated with local GA growth rate in cases having severe CC impairment). Further longitudinal OCTA studies with larger patient cohorts and shorter and more homogenous follow-up periods should help clarify these different possibilities.
To investigate local relationships between CC impairment and GA growth rates we introduced the concept of a local growth trajectory, which we computed using a geometric model of GA growth (Appendices 2 and 3). It should be noted that the model used is extensible, and may be more broadly useful, for example, in more accurately measuring or predicting the spatiotemporal progression of GA. Moreover, while the model here was purely geometric (ie, it used only information from the lesion geometry), it can be extended to incorporate imaging data (eg, CC OCTA signals) or to encode physiologic rules (eg, interaction terms31). Our analysis framework (Figure 1) is also generalizable. While our framework was used in this study to assess relationships between CC impairment and GA growth rates, it can also be used as a general pipeline for assessing potential imaging biomarkers (Figure 9). These imaging biomarkers and GA growth metrics may even be derived from different modalities (eg, OCTA and FAF), assuming sufficiently accurate intermodality registration, a feature that could prove useful for incorporating data collected before the introduction of OCTA. We believe that local imaging biomarkers that strongly correlate with local GA growth rates may be particularly useful for improving understanding of GA pathogenesis.
FIGURE 9.

General scheme for assessing local biomarkers of geographic atrophy (GA) growth. In this scheme, a hypothetical biomarker X is derived from en face images and is then correlated with a local GA growth metric. Note that the en face images and GA tracings can be obtained from different modalities.
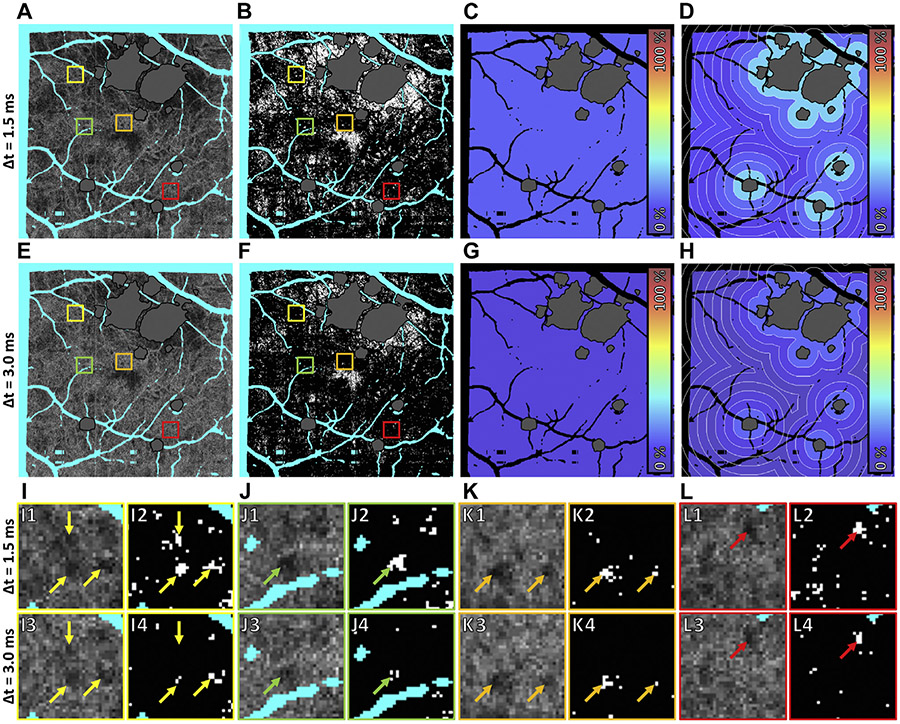
A relatively unique aspect of our study is the use of VISTA to generate OCTA images from different interscan time OCT data, a functionality that is not currently available on commercial instruments. Qualitatively, different interscan times did not substantially alter trends in the global (Figure 8A), zonal (Figure 8B-H), or local (data not shown) associations between CC impairments and GA growth rates. However, 1.5-ms OCTA data did show substantially more CC flow impairment than 3.0-ms OCTA data (Figure 10). Examining individual flow deficits Figure 10I-L), we observed varying differences in flow deficits computed with short and long interscan time OCTA data: some flow deficits were present at shorter interscan times but not at longer interscan times (Figure 10I); some flow deficits were present at both interscan times, but had marked differences in their sizes (Figure 10I, J); and other flow deficits were relatively invariant to changes in the interscan time (Figure 10K, L). In general, longer interscan times are more sensitive to slow blood flows, but less sensitive to blood flow impairment; that is, longer interscan time OCTA is limited in its ability to distinguish slow (eg, impaired) from fast (eg, normal) blood flow.12 Because of this, it is interesting to consider whether CC impairments computed with shorter interscan times might be more correlated with GA growth rates than CC impairments computed with longer interscan times. However, answering this question requires, in addition to larger enrollments, determination of optimal binarization levels for each interscan time (in this study we used the same binarization level for both 1.5-ms and 3.0-ms OCTA data).
FIGURE 10.
Effect of interscan time on choriocapillaris (CC) flow deficit analysis in case 4. Panels A–D correspond to 1.5-ms interscan time analysis, and panels E–H correspond to 3.0-ms interscan time analysis. (A, E) Baseline CC optical coherence tomography angiography (OCTA) slabs. Artifacts are colored teal and the region of baseline GA is colored gray. (B, F) CC flow deficit image (white pixels indicate flow deficits). (C, G) Global flow deficit percentage. (D, H) Zonal flow deficit percentage. (I–L) Closer examination of individual flow deficits. Panels I1, J1, K1, and L1 are extracted from the colored boxes of panel A; panels I2, J2, K2, and L2 are extracted from the colored boxes of panel B; panels I3, J3, K3, and L3 are extracted from the colored boxes of panel E; and panels I4, J4, K4, and L4 are extracted from the colored boxes of panel F. Arrows in panels I–L point to flow deficits. Note that some flow deficits are present at shorter interscan times but not at longer interscan times (panel I); some flow deficits are present at both interscan times, but are markedly different in their sizes (panels I and J); and other flow deficits are relatively invariant to changes in the interscan time (panels K and L).
This study has several additional limitations, many of which are common to other OCTA CC studies. First, in some cases, portions of the lesion(s) were outside of the OCT field-of-view at baseline or follow-up. Although this might influence the estimated global growth rates—local growth rates are largely unaffected—we believe that, given the relatively small areas of exclusion, this did not alter the observations of this study. Second, because the fields-of-view did not precisely overlap, we excluded some OCTA data that could potentially contain useful information. Third, many of the iso-distance zones were not completely contained within the fields-of-view. These 3 limitations are related to our OCTA instrument’s limited, 6 mm × 6 mm field-of-view. Instruments offering larger fields-of-view are being developed by our group, as well as by commercial OCTA manufacturers. Unfortunately, larger fields-of-view can trade off A-scan sampling density, interscan time, number of repeated OCT B-scans, and imaging time, which underscores the need for higher A-scan rate technology. Another limitation of our study is that excluded regions (eg, projection artifacts from larger retinal blood vessels) near the GA margin can potentially alter local CC impairment measurements because: 1) they decrease the number of valid pixels included in the local neighborhood, potentially changing the pixel statistics (eg, increasing variances), and 2) they can change the distribution of the pixel-to-margin distances of the valid pixels (eg, increasing the proportion of pixels farther from the lesion margin). While we would expect that the approximately random (relative to the GA margins) distribution of excluded features decreases the likelihood of bias, it nevertheless remains a limitation. Unfortunately, vessel projection artifacts, the most prominent artifact occurring near GA margins, are an inherent part of current OCTA imaging. While methods have been proposed to recover the OCTA signal underlying projection artifacts, these approaches risk introducing artifacts themselves (eg, artificially increasing/decreasing the OCTA signal). This is a concern for larger retinal vessels, which, because of their high blood flux, likely saturate the OCTA signal, making the “true” OCTA signal from underlying vasculature unrecoverable.
There are also limitations in our local CC impairment and local GA growth rate analyses. For local CC impairment analysis, it is plausible that a differently sized neighborhood (Figure 2F) could alter our findings. In general, larger neighborhoods incorporate more CC data, farther from the lesion, while smaller neighborhoods improve spatial resolution. Although the “correct” neighborhood size is not well defined, we subjectively determined the 250-μm diameter neighborhood used in this study as a reasonable balance between these factors. Future studies are needed to better understand the effect of this choice. For local GA growth rate analysis, our GA growth model assumes an analytical form, which does not fully capture the true lesion growth dynamics (Appendices 2 and 3). In addition, because of the limited number of cases and the lack of a ground truth, the parameter values of our model (Appendix 3, Table A1) were determined by qualitative examination of model behavior. Despite these limitations, the growth trajectories computed using the model are, prima facie, physically plausible and, more importantly, represent a generalizable approach for estimating local growth rates. Moreover, the model contains only 2 parameters (α and β; Appendix 3, Table A1) that directly influence the computed growth trajectories, and, qualitatively, the growth trajectories are not particularly sensitive to changes in these parameters. Given GA growth data from a larger number of subjects measured at shorter, more regular time intervals, these parameter values could be rigorously optimized.
In conclusion, we developed an OCT/OCTA analysis framework that enables quantitative assessment of relationships between CC impairment and GA growth rates at global, zonal, and local spatial scales. We demonstrated the utility of the framework on a small retrospective case series of GA eyes imaged with a 400-kHz 1050-nm SS-OCTA prototype. The geometric model developed for local growth rate analysis is generalizable and may enable more accurate measurement and/or prediction of GA progression and treatment response.
Supplementary Material
FIGURE 6.
Multiscale analysis of choriocapillaris (CC) impairment and geographic atrophy (GA) growth in case 5, the slowest growing unifocal lesion. (A) Baseline sub–retinal pigment epithelium optical coherence tomography angiography (OCTA) slab. The baseline and follow-up GA margins are delineated by the solid black and dashed white contours, respectively. (B) Baseline CC OCTA slab (1.5-ms interscan time). Artifacts are shown in teal and are excluded from analysis (see Figure 2B); the region of baseline GA is colored gray, and is also excluded from analysis. (C) CC flow deficit image, formed by binarizing the CC OCTA slab of panel B (white pixels indicate flow deficits). (D–F) Flow deficit percentage analyzed at global, zonal, and local scales, respectively (see Figure 2). (G) Growth trajectories. (H) Local growth rates. (I) Scatterplot of the local growth rate of panel H versus the local CC impairment of panel F, with linear regression line (red). Note that the x axis scale differs for Figure 4-7.
Acknowledgments
Funding/Support: Supported by National Eye Institute grant 5-R01-EY011289-31 (Bethesda, MD), AFOSR FA9550-15-1-0473 (Arlington, VA), Beckman-Argyros Award in Vision Research (Irvine, CA), Champalimaud Vision Award (Lisbon, Portugal), Massachusetts Lions Clubs (Belmont, MA), and the Macula Vision Research Foundation (MVRF, West Conshohocken, PA). Financial Disclosures: Drs Moult and Ploner own intellectual property related to variable interscan time analysis OCTA. Dr Duker has received financial support from and has been a consultant for Optovue (Fremont, CA), Topcon (Oakland, NJ), and Carl Zeiss Meditec (Dublin, CA). Dr Waheed has been a consultant for Optovue (Fremont, CA) and has received financial support from Carl Zeiss Meditec (Dublin, CA), Heidelberg (Franklin, MA), and Nidek (Fremont, CA). Dr Fujimoto has personal financial interest in and intellectual property licensed to Optovue (Fremont, CA), intellectual property licensed to Carl Zeiss Meditec (Dudlin, CA), has received research support from Topcon (Oakland, NJ), and owns intellectual property related to variable interscan time analysis optical coherence tomography angiography. Drs Alibhai, Lee, Yu, Chen, and Maier have no financial disclosures. All authors attest that they meet the current ICMJE criteria for authorship.
Footnotes
ALL AUTHORS HAVE COMPLETED AND SUBMITTED THE ICMJE FORM FOR DISCLOSURE OF POTENTIAL CONFLICTS OF INTEREST.
Contributor Information
ERIC M. MOULT, Department of Electrical Engineering and Computer Science, Research Laboratory of Electronics, Massachusetts Institute of Technology, Cambridge, Massachusetts
A. YASIN ALIBHAI, New England Eye Center, Tufts Medical Center, Boston, Massachusetts.
BYUNGKUN LEE, Department of Electrical Engineering and Computer Science, Research Laboratory of Electronics, Massachusetts Institute of Technology, Cambridge, Massachusetts.
YUE YU, Department of Electrical Engineering and Computer Science, Research Laboratory of Electronics, Massachusetts Institute of Technology, Cambridge, Massachusetts, Department of Biomedical Engineering, Peking University, Beijing, China..
STEFAN PLONER, Department of Computer Science, Pattern Recognition Lab, Friedrich-Alexander University Erlangen-Nürnberg, Erlangen, Germany.
SIYU CHEN, Department of Electrical Engineering and Computer Science, Research Laboratory of Electronics, Massachusetts Institute of Technology, Cambridge, Massachusetts.
ANDREAS MAIER, Department of Computer Science, Pattern Recognition Lab, Friedrich-Alexander University Erlangen-Nürnberg, Erlangen, Germany.
JAY S. DUKER, New England Eye Center, Tufts Medical Center, Boston, Massachusetts
NADIA K. WAHEED, New England Eye Center, Tufts Medical Center, Boston, Massachusetts
JAMES G. FUJIMOTO, Department of Electrical Engineering and Computer Science, Research Laboratory of Electronics, Massachusetts Institute of Technology, Cambridge, Massachusetts
REFERENCES
- 1.McLeod DS, Taomoto M, Otsuji T, Green WR, Sunness JS, Lutty GA. Quantifying changes in RPE and choroidal vasculature in eyes with age-related macular degeneration. Invest Ophthalmol Vis Sci 2002;43(6):1986–1993. [PubMed] [Google Scholar]
- 2.McLeod DS, Grebe R, Bhutto I, Merges C, Baba T, Lutty GA. Relationship between RPE and choriocapillaris in age-related macular degeneration. Invest Ophthalmol Vis Sci 2009;50(10):4982–4991. [DOI] [PMC free article] [PubMed] [Google Scholar]
- 3.Biesemeier A, Taubitz T, Julien S, Yoeruek E, Schraermeyer U. Choriocapillaris breakdown precedes retinal degeneration in age-related macular degeneration. Neurobiol Aging 2014;35(11):2562–2573. [DOI] [PubMed] [Google Scholar]
- 4.Bhutto I, Lutty G. Understanding age-related macular degeneration (AMD): relationships between the photoreceptor/retinal pigment epithelium/Bruch’s membrane/choriocapillaris Complex. Mol Aspects Med 2012;33(4):295–317. [DOI] [PMC free article] [PubMed] [Google Scholar]
- 5.Spaide RF, Fujimoto JG, Waheed NK, Sadda SR, Staurenghi G. Optical coherence tomography angiography. Prog Retin Eye Res 2018;64:1–55. [DOI] [PMC free article] [PubMed] [Google Scholar]
- 6.Kashani AH, Chen CL, Gahm JK, et al. Optical coherence tomography angiography: a comprehensive review of current methods and clinical applications. Prog Retin Eye Res 2017;60:66–100. [DOI] [PMC free article] [PubMed] [Google Scholar]
- 7.Unterhuber A, Považay B, Hermann B, Sattmann H, Chavez-Pirson A, Drexler W. In vivo retinal optical coherence tomography at 1040 nm-enhanced penetration into the choroid. Opt Express 2005;13(9):3252–3258. [DOI] [PubMed] [Google Scholar]
- 8.Povazay B, Hermann B, Unterhuber A, et al. Three-dimensional optical coherence tomography at 1050 nm versus 800 nm in retinal pathologies: enhanced performance and choroidal penetration in cataract patients. J Biomed Opt 2007;12(4):41211. [DOI] [PubMed] [Google Scholar]
- 9.Novais EA, Adhi M, Moult EM, et al. Choroidal neovascularization analyzed on ultrahigh-speed swept-source optical coherence tomography angiography compared to spectral-domain optical coherence tomography angiography. Am J Ophthalmol 2016;164:80–88. [DOI] [PMC free article] [PubMed] [Google Scholar]
- 10.Lane M, Moult EM, Novais EA, et al. Visualizing the choriocapillaris under drusen: comparing 1050-nm swept-source versus 840-nm spectral-domain optical coherence tomography angiography. Invest Ophthalmol Vis Sci 2016;57(9):OCT585–OCT590. [DOI] [PMC free article] [PubMed] [Google Scholar]
- 11.Miller AR, Roisman L, Zhang Q, et al. Comparison between spectral-domain and swept-source optical coherence tomography angiographic imaging of choroidal neovascularization. Invest Ophthalmol Vis Sci 2017;58(3):1499–1505. [DOI] [PMC free article] [PubMed] [Google Scholar]
- 12.Choi W, Moult EM, Waheed NK, et al. Ultrahigh-speed, swept-source optical coherence tomography angiography in nonexudative age-related macular degeneration with geographic atrophy. Ophthalmology 2015;122(12):2532–2544. [DOI] [PMC free article] [PubMed] [Google Scholar]
- 13.Nassisi M, Shi Y, Fan W, et al. Choriocapillaris impairment around the atrophic lesions in patients with geographic atrophy: a swept-source optical coherence tomography angiography study. Br J Ophthalmol 2018;103(7):911–917. [DOI] [PubMed] [Google Scholar]
- 14.Sacconi R, Corbelli E, Carnevali A, Querques L, Bandello F, Querques G. optical coherence tomography angiography in geographic atrophy. Retina 2017;38(12):2350–2355. [DOI] [PubMed] [Google Scholar]
- 15.Waheed NK, Moult EM, Fujimoto JG, Rosenfeld PJ. Optical coherence tomography angiography of dry age-related macular degeneration. Dev Ophthalmol 2016;56:91–100. [DOI] [PMC free article] [PubMed] [Google Scholar]
- 16.Ploner SB, Moult EM, Choi W, et al. Toward quantitative optical coherence tomography angiography: visualizing blood flow speeds in ocular pathology using variable interscan time analysis. Retina 2016;36(suppl 1):S118–S126. [DOI] [PMC free article] [PubMed] [Google Scholar]
- 17.Cole ED, Moult EM, Dang S, et al. The definition, rationale, and effects of thresholding in OCT angiography. Ophthalmol Retina 2017;1(5):435–447. [DOI] [PMC free article] [PubMed] [Google Scholar]
- 18.Kraus MF, Potsaid B, Mayer MA, et al. Motion correction in optical coherence tomography volumes on a per A-scan basis using orthogonal scan patterns. Biomed Opt Express 2012;3(6):1182–1199. [DOI] [PMC free article] [PubMed] [Google Scholar]
- 19.Kraus MF, Liu JJ, Schottenhamml J, et al. Quantitative 3D-OCT motion correction with tilt and illumination correction, robust similarity measure and regularization. Biomed Opt Express 2014;5(8):2591–2613. [DOI] [PMC free article] [PubMed] [Google Scholar]
- 20.Ploner SB, Kraus MF, Husvogt L, et al. 3-D OCT motion correction efficiently enhanced with OCT angiography. Invest Ophthalmol Vis Sci 2018;59(9):3922. [Google Scholar]
- 21.Lujan BJ, Rosenfeld PJ, Gregori G, et al. Spectral domain optical coherence tomographic imaging of geographic atrophy. Ophthalmic Surg Lasers Imaging Retina 2009;40(2):96–101. [DOI] [PubMed] [Google Scholar]
- 22.Yehoshua Z, Rosenfeld PJ, Gregori G, et al. Progression of geographic atrophy in age-related macular degeneration imaged with spectral domain optical coherence tomography. Ophthalmology 2011;118(4):679–686. [DOI] [PMC free article] [PubMed] [Google Scholar]
- 23.Yehoshua Z, Garcia Filho CAA, Penha FM, et al. Comparison of geographic atrophy measurements from the OCT fundus image and the sub-RPE slab image. Ophthalmic Surg Lasers Imaging Retina 2013;44(2):127–132. [DOI] [PubMed] [Google Scholar]
- 24.Bergström P, Edlund O. Robust registration of point sets using iteratively reweighted least squares. Comput Optim Appl 2014;58(3):543–561. [Google Scholar]
- 25.Spaide RF. Choriocapillaris flow features follow a power law distribution: implications for characterization and mechanisms of disease progression. Am J Ophthalmol 2016;170:58–67. [DOI] [PubMed] [Google Scholar]
- 26.Feuer WJ, Yehoshua Z, Gregori G, et al. Square root transformation of geographic atrophy area measurements to eliminate dependence of growth rates on baseline lesion measurements: a reanalysis of age-related eye disease study report no. 26. JAMA Ophthalmol 2013;131(1):110–111. [DOI] [PMC free article] [PubMed] [Google Scholar]
- 27.Uji A, Balasubramanian S, Lei J, Baghdasaryan E, Al-Sheikh M, Sadda SR. Choriocapillaris imaging using multiple en face optical coherence tomography angiography image averaging. JAMA Ophthalmol 2017;135(11):1197–1204. [DOI] [PMC free article] [PubMed] [Google Scholar]
- 28.Borrelli E, Uji A, Sarraf D, Sadda SR. Alterations in the choriocapillaris in intermediate age-related macular degeneration. Invest Ophthalmol Vis Sci 2017;58(11):4792–4798. [DOI] [PubMed] [Google Scholar]
- 29.Al-Sheikh M, Phasukkijwatana N, Dolz-Marco R, et al. Quantitative OCT angiography of the retinal microvasculature and the choriocapillaris in myopic eyes. Invest Ophthalmol Vis Sci 2017;58(4):2063–2069. [DOI] [PubMed] [Google Scholar]
- 30.Zhang Q, Zheng F, Motulsky EH, et al. A novel strategy for quantifying choriocapillaris flow voids using swept-source OCT angiography. Invest Ophthalmol Vis Sci 2018;59(1):203–211. [DOI] [PMC free article] [PubMed] [Google Scholar]
- 31.Spaide RF. Ising model of choriocapillaris flow. Retina 2018;38(1):79–83. [DOI] [PubMed] [Google Scholar]
- 32.Wu Z, Luu CD, Ayton LN, et al. Optical coherence tomography-defined changes preceding the development of drusen-associated atrophy in age-related macular degeneration. Ophthalmology 2014;121(12):2415–2422. [DOI] [PubMed] [Google Scholar]
- 33.Wu Z, Luu CD, Ayton LN, et al. Fundus autofluorescence characteristics of nascent geographic atrophy in age-related macular degeneration. Invest Ophthalmol Vis Sci 2015;56(3):1546–1552. [DOI] [PMC free article] [PubMed] [Google Scholar]
- 34.Moult EM, Waheed NK, Novais EA, et al. Swept-source optical coherence tomography angiography reveals choriocapillaris alterations in eyes with nascent geographic atrophy and drusen-associated geographic atrophy. Retina 2016;36(suppl 1):S2–S11. [DOI] [PMC free article] [PubMed] [Google Scholar]
Associated Data
This section collects any data citations, data availability statements, or supplementary materials included in this article.


