Abstract
Dystrophin proteomic regulation in Muscular Dystrophies (MD) remains unclear. We report that a long noncoding RNA (lncRNA), H19, associates with dystrophin and inhibits E3 ligase-dependent poly-ubiquitination at Lys3584 (referred to as Ub-DMD) and its subsequent protein degradation. In-frame deletions in BMD and a DMD non-silent mutation (C3340Y) result in defects in the protein’s ability to interact with H19, causing elevated Ub-DMD levels and dystrophin degradation. Dmd C3333Y mice exhibited progressive muscular dystrophy, elevated serum CK, heart dilation, blood vessel irregularity, and respiratory failure with concurrently reduced dystrophin and increased Ub-DMD status. H19 RNA oligonucleotides conjugated with Agrin (AGR-H19) and Nifenazone competed-with/inhibited TRIM63. Dmd C3333Y animals, iPSC-derived skeletal muscle cells from BMD patients, or mdx mice subjected to exon-skipping exhibited inhibited dystrophin degradation, preserved skeletal/cardiac muscle histology, and improved strength/heart function following AGR-H19 or Nifenazone treatment. Our study paves the way to meaningful targeted therapeutics for BMD and certain DMD patients.
Keywords: Long noncoding RNA, H19, Muscle Dystrophy, Dystrophin, Ubiquitination, TRIM63, E3 ligase inhibitor, lncRNA mimics
Muscular dystrophies (MD) are a heterogeneous group of inherited diseases of skeletal, smooth, and cardiac muscle that cause progressive weakness and degeneration of muscle fibers. Although a number of factors have been linked to different types of muscular dystrophies1, disrupting (DMD) or non-disrupting (BMD) mutations of the dystrophin (DMD) gene reading frame are the causative genetic defects of these diseases2,3, resulting in the absent or reduced level of the 427-kDa protein. While DMD and BMD have been considered X-linked recessive disorders4,5, approximately 8% of female DMD patients exhibit muscle weakness6–9. A phenotype-based frame-type analysis held true for 92% of in-frame deletions in 1024 BMD patients and 10% of in-frame deletions in 2688 DMD patients10. A cohort of point-mutations in the DMD gene also leads to a decrease in dystrophin protein levels in vivo11. The absence/reduction of dystrophin could be the consequence of genomic, epigenomic, transcriptomic, and proteomic pathways.
The importance of long noncoding RNAs (lncRNAs) in regulating homeostasis and inherited diseases is largely unknown. We report that H19 associates with dystrophin at the C-termini. H19-dystrophin interactions inhibit TRIM63-dependent, K48-linked poly-ubiquitination of dystrophin at Lys3584, preventing protein degradation. Human induced Pluripotent Stem Cells (hiPSC) derived from BMD patients exhibited elevated Ub-DMD levels in iPSC-differentiated skeletal muscle cells and cardiomyocytes, which was reversed following expression of H19. Mice harboring the Dmd C3333Y mutant, which models DMD C3340Y, exhibit progressive muscular dystrophy, elevated serum CK, heart dilation, blood vessel irregularity, and respiratory failure. We determined the minimal lncRNA sequence of H19 required to compete with TRIM63-dystrophin interactions and conjugated it with a muscle-enriching peptide, resulting in the development of AGR-H19. We also determined a small molecule inhibitor of TRIM63, Nifenazone, as a potential E3 ligase inhibitor. Administration of AGR-H19 or Nifenazone significantly alleviated muscular dystrophy, and improved muscle strength and cardiac function in Dmd C3333Y animals in vivo. Additionally, mdx mice subjected to Dmd exon-skipping exhibit robust levels of Ub-DMD, which were inhibited following administration of AGR-H19 or Nifenazone. Our findings suggested the importance of lncRNAs and lncRNA-related signaling events in inherited genetic muscle disorders and shed light on the therapeutic potential of RNA oligonucleotides as an innovative treatment option for these diseases.
Results
Dystrophin associates with H19
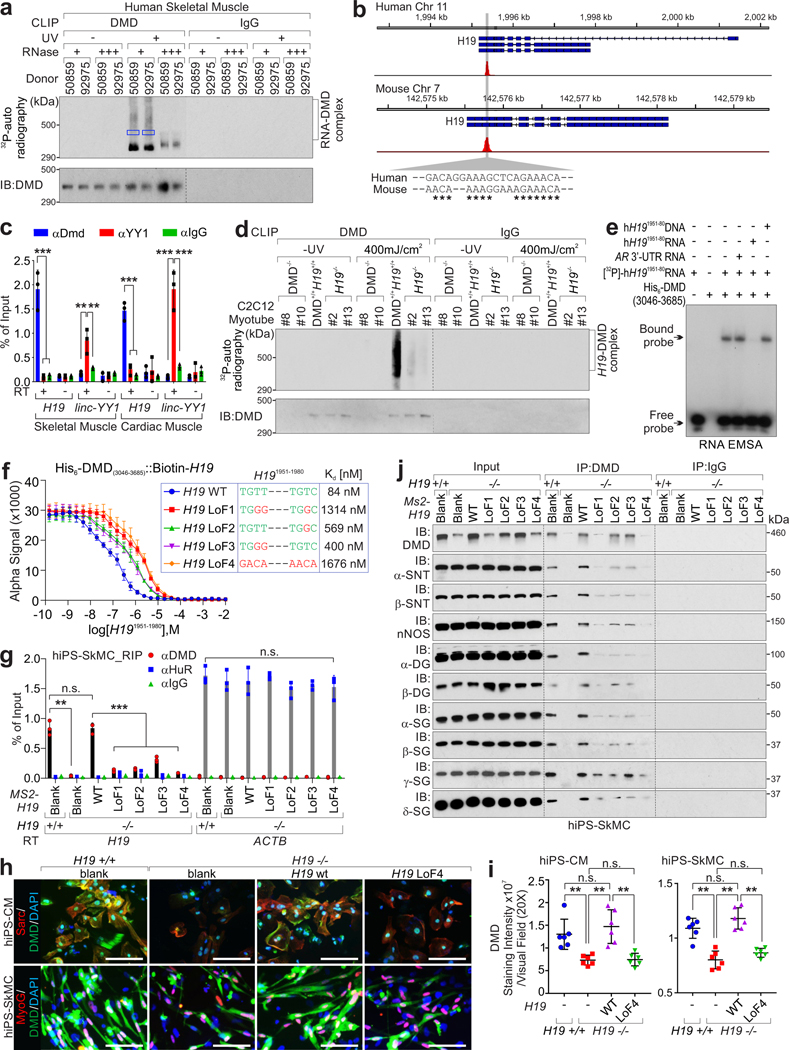
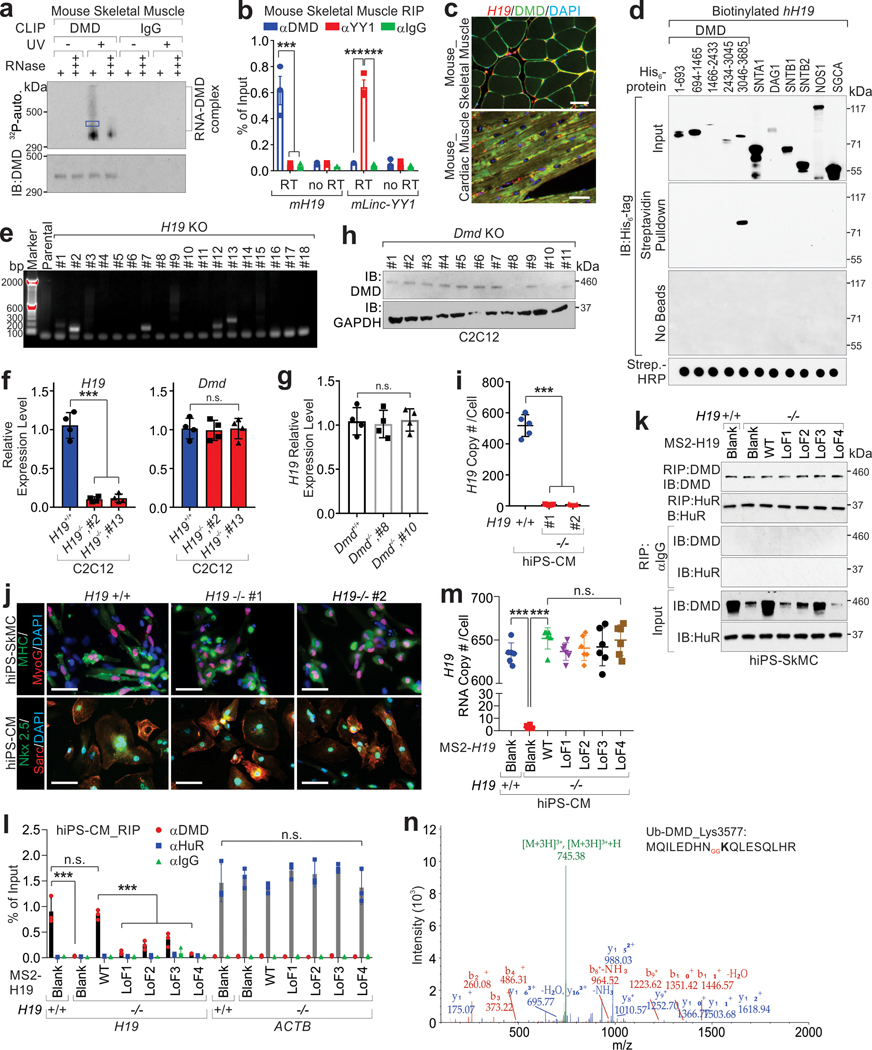
The C-terminal zinc finger domain (ZNF) of dystrophin assists with the formation of the dystrophin-associated protein complex12, and ZNF could potentially serve as an atypical RNA binding domain13. In human and mouse skeletal muscle tissues, CLIP assay indicated that dystrophin associates with RNA motifs of lncRNA H19: hH19 (nt. 1954–1974) and mH19 (nt. 1907–1924) (Fig. 1a–b and Extended Data Fig. 1a, Supplementary Table 1–2). These interactions were confirmed using RNA Immunoprecipitation (RIP) Assays and RNA Fluorescence in situ hybridization (FISH) coupled with immunofluorescence staining (Fig. 1c and Extended Data Fig. 1b–c). The dystrophin C-termini (a.a. 3046–3685) exhibited interaction with biotinylated H19 in vitro, but neither the other domains of dystrophin nor the other components of the dystrophin-associated protein complex (DAPC) we tested (Extended Data Fig. 1d).
Figure 1. H19 interacts and stabilizes dystrophin.
a, CLIP assays using human skeletal muscle tissues were visualized by autoradiography. DMD-bound RNA (indicated by blue box) were subjected to Sanger sequencing. b, Summary of Sanger sequencing of CLIP assay. The chromatin sequences corresponding to RNA (negative-stranded) bound by DMD are shown. *: the conserved nucleotides between human and mouse. c, RIP assay using indicated antibodies in human skeletal/cardiac muscle. The linc-YY1-YY1 interaction was included as the positive control. Mean values±SEM, n=3 independent experiments, two-way ANOVA. d, Autoradiography (top) or immunoblotting (IB, bottom) of CLIP assay in H19- or Dmd-deficient C2C12 differentiated myotubes. #8 and #10: DMD KO; #2 and #13: H19 KO. e, EMSA using His-tagged DMD (aa.3046–3685) and [γ−32P]-labeled human H19 RNA (nt. 1951–1980). The unlabeled-H19 RNA/DNA (nt. 1951–1980) or AR 3’-UTR RNA serve as competitor. f, Competition binding assay to determine Kd of the interaction between His-tagged DMD (aa.3046–3685) and biotinylated-H19 full-length. Unlabeled H19 RNA wild type (WT) or indicated mutants serve as competitor. Mean values±SD, n=3 independent experiments. The sequence of H19 nt. 1951–1980 of wt or mutants are shown. g, RIP assay using indicated antibodies in H19-depleted hiPS-SkMCs expressing H19 WT or indicated mutants. Mean values±SD, n=3 independent experiments, two-way ANOVA. h-i, Representative images (h) and statistical analysis (i) of DMD staining intensities in H19-depleted hiPS-CMs or hiPS-SkMCs expressing H19 WT or indicated mutants. Sarc: Sarcomeric alpha Actin; MyoG: Myogenin. Scale bars: 50 μm (h). Mean values±SD (i), n=6 independent experiments, one-way ANOVA. j, Immunoprecipitation (IP) and IB detection of indicated proteins in H19-depleted iPS-SkMCs expressing with H19 WT or indicated mutants. SNTA1: α1-Syntrophin; SNTB1: β1-Syntrophin; α-DG: α-dystroglycan; β-DG: β-dystroglycan; α-SG: α-sarcoglycan; β-SG: β-sarcoglycan; γ-SG: γ-sarcoglycan; δ-SG: δ-sarcoglycan. No significance [n.s.], p > 0.05, *, p < 0.05, **, p < 0.01, ***, p < 0.001, and ****, p < 0.0001. Autoradiography and immunoblots are representative of two independent experiments. Statistical source data and unprocessed immunoblots are provided as Source Data Fig. 1.
Mouse C2C12 myoblasts with H19 or Dmd knockout differentiated to myotubes, showed minimally altered Dmd or H19 expression (Extended Data Fig. 1e–h). CLIP rescue assays indicated that Dmd or H19 depletion abolished RNA-DMD complexes (Fig. 1d). Electrophoretic mobility shift assay (EMSA) suggested that RNA, but not DNA oligonucleotides representing hH19 (nt. 1951–1980) associated with dystrophin (Fig. 1e). Non-radioactive labeled hH19 RNA, but not androgen receptor (AR) 3’-UTR RNA or hH19 DNA served as a competitor (Fig. 1e).
AT-rich motifs play essential roles in mediating interactions between RNA and ZNF14. H19 RNA motif (nt. 1951–1980) contains two AT-rich motifs: nt. 1954–1957 and nt. 1970–1973 (Fig. 1f). Loss-of-function (LoF) mutations, LoF1–4 all exhibited impaired H19-DMD interactions; LoF4 exhibited the lowest defect (Fig. 1f). H19-deficient hiPSCs were differentiated into skeletal muscle cells (SkMCs) or cardiomyocytes (CMs) (Extended Data Fig. 1i–j). H19-DMD interactions were rescued by expression of H19 wild-type (WT) but not the LoF mutants (Fig. 1g and Extended Data Fig. 1k–m). The interaction between HuR and Actin15 was included as positive control. Upon H19 depletion, dystrophin’s status was reduced, which was rescued by the expression of H19 WT but not the LoF mutant (Fig. 1h–j).
H19 competes with TRIM63 to inhibit the poly-ubiquitination and protein degradation of dystrophin
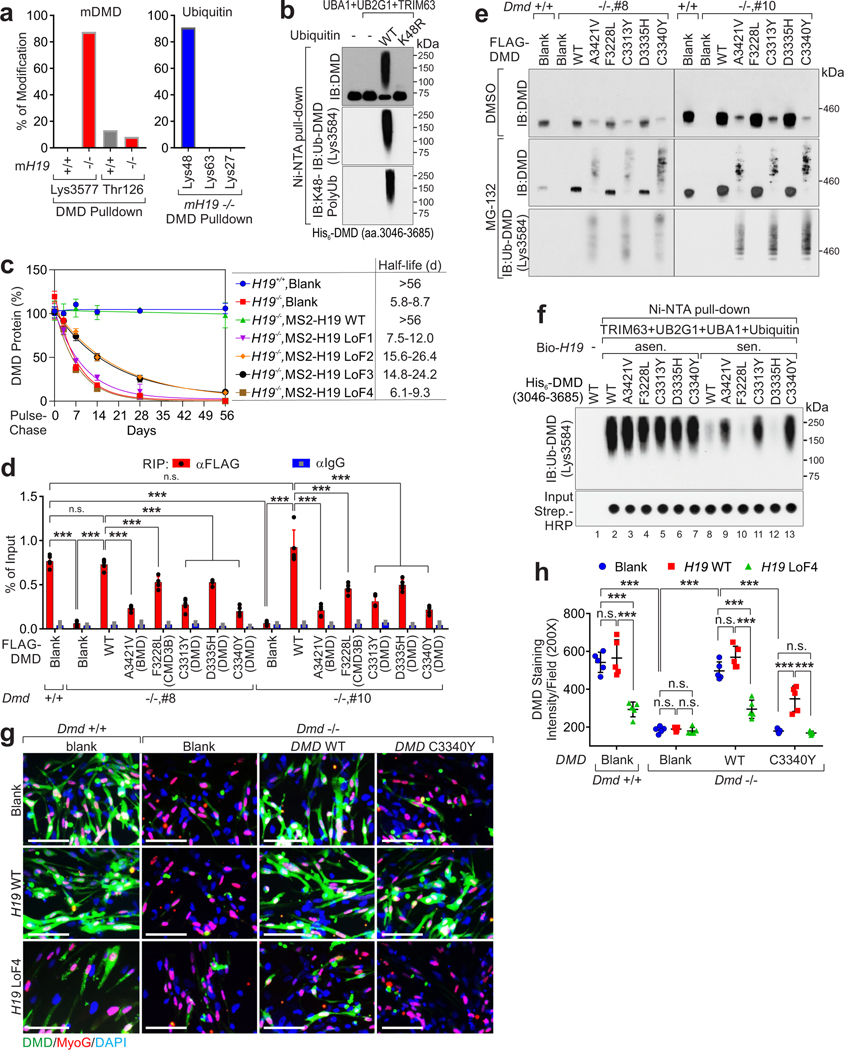
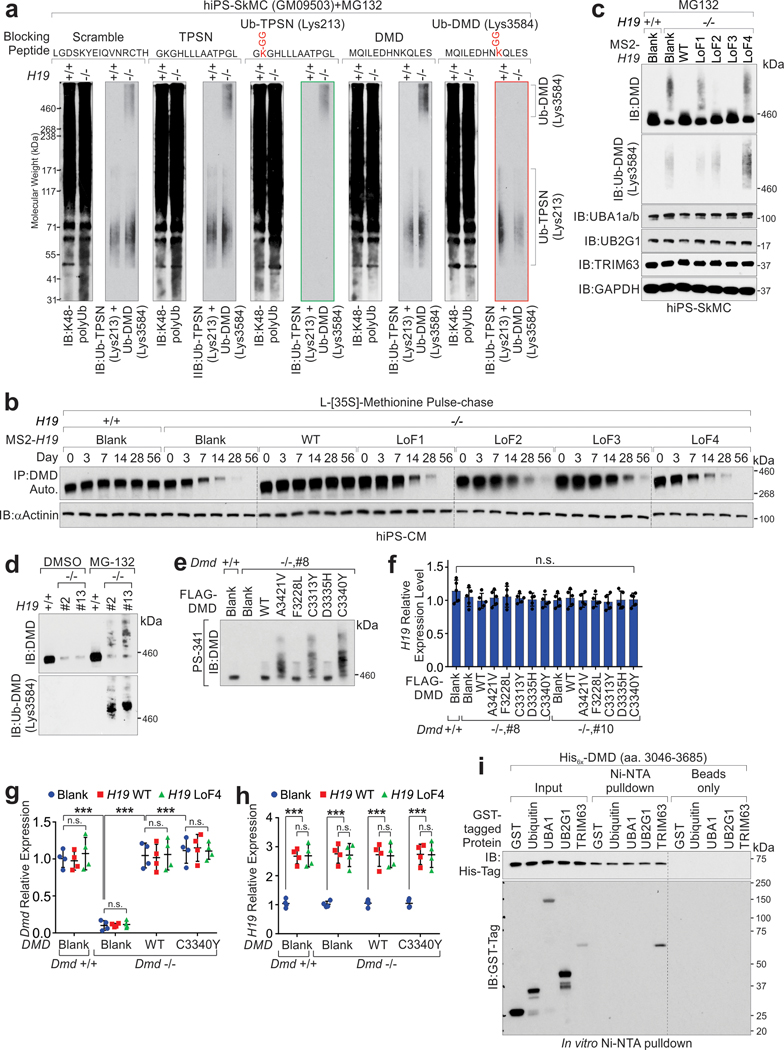
Mass spectrometry indicated that in mH19 WT myotubes, dystrophin associates with DAPC components; however, in mH19 KO myotubes, mDMD associated with UBA1, UB2G1, TRIM63 and ubiquitin (Supplementary Table 3). In mH19 KO cells, mDMD was modified with K48-linked poly-ubiquitination (poly-Ub) at Lys3577 (Fig. 2a and Extended Data Fig. 1n). We generated a modification-specific antibody targeting human poly-ubiquitinated DMD (Lys3584), which is conserved with mDMD Lys3577, using a double glycine (GG)-modified peptide (referred to Ub-DMD). Blocking Peptide representing Ub-DMD, but not Ub-TPSN16, diminished the recognition of Ub-DMD antibody in iPS-SkMCs (Extended Data Fig. 2a). TRIM63 catalyzed Ub-DMD in K48 ubiquitin-dependent manner (Fig. 2b). [35S] methionine pulse-chase assay suggested that H19-depletion leads to a reduced half-life of dystrophin and elevated Ub-DMD, which was restored upon expression of exogenous H19 WT but not LoF mutants (Fig. 2c and Extended Data Fig. 2b–d).
Figure 2. H19 antagonizes poly-Ubiquitination of DMD.
a, Percentage of modified vs. total number of peptides harboring indicated residues of mDMD (left) in H19+/+ or −/− cells or ubiquitin (right) in H19 −/− cells upon DMD pulldown. b, In vitro poly-Ub chain formation using His-tagged DMD (aa.3036–3685), UBA1, UB2G1 and TRIM63, and Ubiquitin wild type (WT) or K48R mutant. c, Half-life determination of DMD protein in human H19-depleted iPSC-CMs expressing H19 WT or indicated mutants. Mean values±SD, n=3 independent experiments in each experimental condition. d, RIP assay using indicated antibodies in Dmd+/+ or Dmd−/− C2C12-differentiated myotubes expressing indicated FLAG-tagged DMD WT or mutants. Mean values±SD, n=4 independent experiments, two-way ANOVA. e, IB detection of DMD or Ub-DMD in Dmd+/+ or Dmd−/− C2C12-differentiated myotubes expressing indicated FLAG-tagged DMD WT or mutants upon DMSO or MG-132 (5 μmol/L) treatment. f, In vitro poly-Ub chain formation using His-tagged DMD (aa.3036–3685), WT or indicated mutants, UBE1, UB2G1, TRIM63, Ubiquitin, and sense (sen.) or anti-sense (asen.) of biotinylated hH19. Streptavidin (Strip.)-HRP detection were shown to indicate the presence of biotinylated H19 transcripts. g and h, Representative images of immunofluorescence staining (g) and statistical analysis of DMD staining intensities in myotubes derived from (h) Dmd+/+ or Dmd−/− C2C12 expressing DMD or H19 WT or indicated mutants. Scale bars (h): 50 μm. Mean values±SD (i), n=5 independent experiments, two-way ANOVA. No significance [n.s.], p > 0.05, *, p < 0.05, **, p < 0.01, ***, p < 0.001, and ****, p < 0.0001. Immunoblots are representative of two independent experiments. Statistical source data and unprocessed immunoblots are provided as Source Data Fig. 2.
We expressed five previously reported non-silent mutations of the DMD adjacent to the ubiquitination site: A3421V in BMD17, F3228L in CMD3B18, and C3313Y19, D3335H20, C3340Y21, which might be involved in interacting with β-dystroglycan22,23, in Dmd-deficient C2C12-diffentriated myotubes. Compared to dystrophin WT, all mutants exhibited impaired interactions with H19, robust Ub-DMD and unaltered expression of H19 (Fig. 2d–e and Extended Data Fig. 2e–f). The presence of hH19 sense transcript (sen.), but not anti-sense (asen.) inhibited the Ub-DMD of dystrophin WT and mutants (Fig. 2f). WT dystrophin expression in DMD-deficient hiPSC-SkMCs rescued dystrophin expression; DMD C3340Y expression resulted in reduced protein detection (Fig. 2g–h and Extended Data Fig. 2g–h). WT H19 expression in DMD C3340Y-expressing hiPS-SkMCs led to significantly increased dystrophin status compared to blank vectors or the H19 LoF4 mutant (Fig. 2g–h). These observations suggested that overexpression of H19 may restore dystrophin stability in DMD patients.
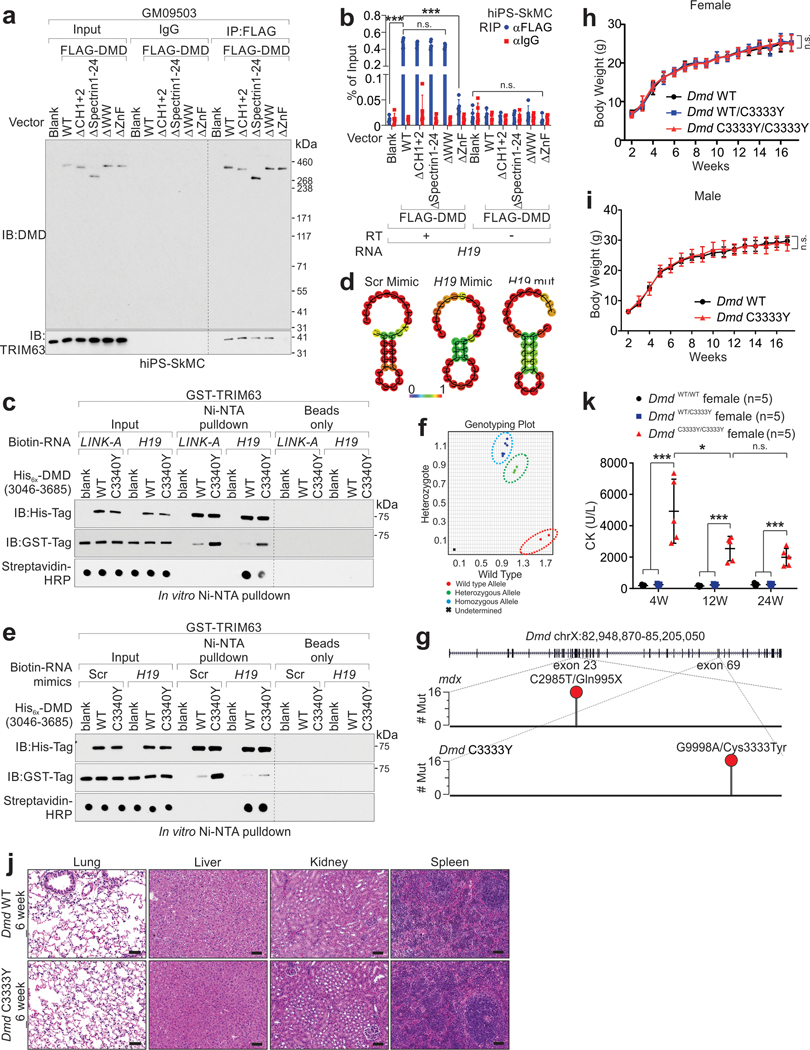
TRIM63 and H19 associated with the C-terminal ZNF of dystrophin, (Extended Data Fig. 2i, 3a–b). We hypothesized that H19 competes with TRIM63 to inhibit the dystrophin degradation. Dystrophin-TRIM63 interactions were reduced in the presence H19 RNA (Supplementary Fig. 1). C3340Y mutant exhibited increased binding to TRIM63, however, the presence of H19 decreased this association (Extended Data Fig. 3c). We synthesized RNA mimics representing scramble (Scr), H19 WT, or H19 Lof4 mutant (referred to as H19 mut). The Lof4 mutant showed minimal effect on the secondary structure of H19 RNA mimics (Extended Data Fig. 3d). H19 mimics abolished the interaction between dystrophin C3340Y and TRIM63 (Extended Data Fig. 3e). This suggested that H19 associates with dystrophin’s ZNF, inhibiting TRIM63-dependent Ub-DMD.
Dmd C3333Y mutant leads to muscular dystrophy
We introduced a one-nucleotide mutation into the mouse Dmd gene ChrX:85,141,770 G>A to achieve a Dmd C3333Y mutant in a C57B/6N genetic background (Fig. 3a and Extended Data Fig. 3f–g). Male and female Dmd C3333Y animals exhibited unaffected body weight and normal embryonic development (Extended Data Fig. 3h–i). Dmd C3333Y animals showed slightly reduced viability and fertility (Supplementary Table 4, 5). By four weeks-of-age, the blood creatine kinase (CK) concentrations of both male and female Dmd C3333Y animals were elevated compared to wild-type or heterozygous littermates (Fig. 3b and Extended Data Fig. 3k). By 20 weeks-of-age, Dmd C3333Y animals showed muscular tremors and incoordination (Supplementary Video 1–2). The mean survival time of Dmd C3333Y animals was about 46 weeks (Fig. 3c). Animal death was predated with respiratory failure, dysphagia, and potential heart failure. Deceased animals exhibited calcified skeletal and abdominal wall muscles (Fig. 3d).
Figure 3. Dmd C3333Y models progressive muscular dystrophy.
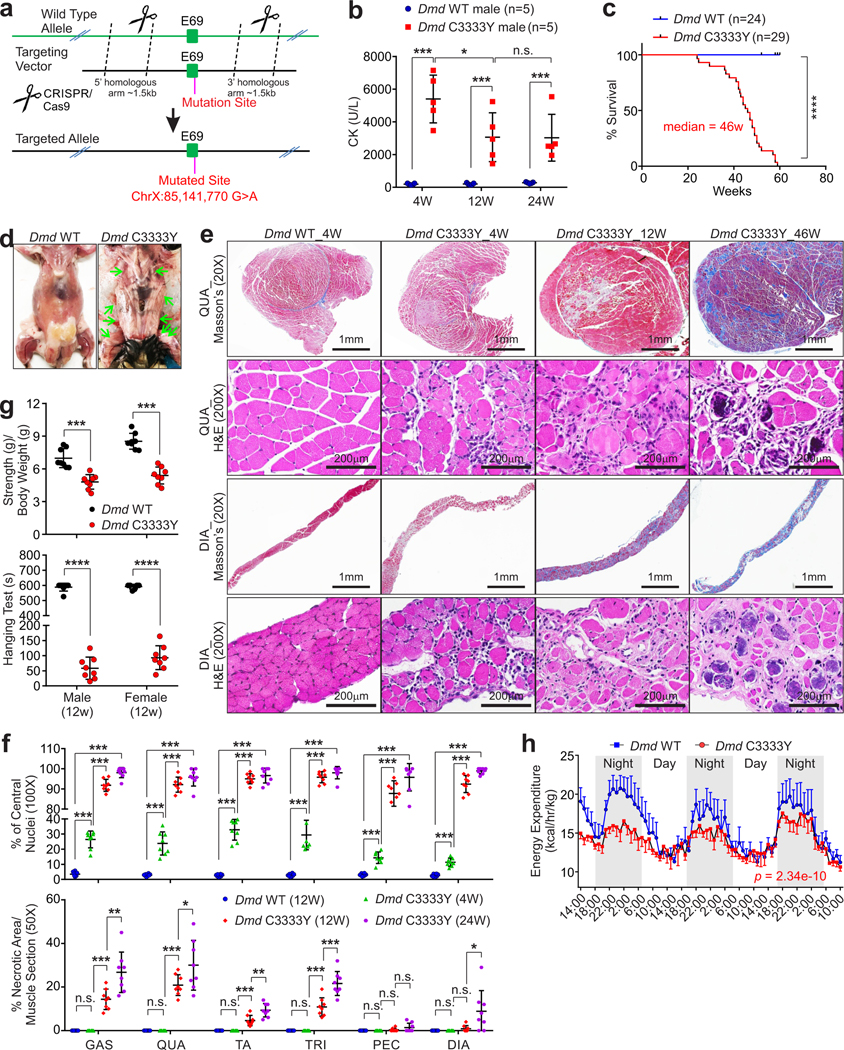
a, Schematic of CRISPR-cas9 method used to generate Dmd C3333Y mice. b, Creatine kinase (CK) concentration comparison of male Dmd C3333Y and Dmd WT mice at indicated ages. Mean values±SD, n=5 animals per experimental group, two-way ANOVA. c, Kaplan-Meier survival analysis of Dmd WT and Dmd C3333Y mice, (n=24 and 29 animals respectively, log rank test). d, Dissection images of the deceased animals indicate the skeleton muscle, respiratory muscle thoroughly calcified, indicated by green arrows. e, Masson’s trichrome staining and H&E staining of quadriceps (QUA) and diaphragm (DIA) of Dmd WT and Dmd C3333Y mice at the indicated age. Scale bars: 1 mm or 200 μm. f, Statistical analysis of percentage of central nucleic muscle fiber (top) and necrotic area of indicated muscle pieces (bottom) of Dmd WT and Dmd C3333Y mice at the indicated ages. GAS: gastrocnemius, QUA: quadriceps, TA: tibialis anterior, TRI: triceps, PEC: pectoralis, DIA: diaphragm. Mean values±SD, n=8 animals per experimental group, two-way ANOVA. g, Muscle strength test (top) and hanging test (bottom) of 12 weeks old male or female Dmd WT and Dmd C3333Y mice. Mean values±SD, n=8 animals per experimental group, unpaired Student’s t-test. h, Energy expenditure measurement of Dmd WT and Dmd C3333Y mice. Mean values±SEM, n=4 animals in each group, two-way ANOVA. No significance [n.s.], p > 0.05, *, p < 0.05, **, p < 0.01, ***, p < 0.001, and ****, p < 0.0001. Statistical source data are provided as Source Data Fig. 3.
The mRNA statuses of the DAPC complex components were minimally altered in Dmd C3333Y mice (Extended Data Fig. 4a). Dmd C3333Y mice harbored increased serum cytokines in comparison with Dmd WT mice (Extended Data Fig. 4b–d), which were consistent with the serum tests of DMD patients24,25. Heterozygous female animals are histologically unaffected (Extended Data Fig. 4e). In both male and female Dmd C3333Y mice, the gastrocnemius (GAS), quadriceps (QUA), tibialis anterior (TA), triceps (TRI), and pectoralis (PEC) at 4 week-of-age, and the diaphragm (DIA) at 20 week-of-age, exhibited excessive atrophy with loss of normal muscle fibers (Fig. 3e). Changes in fiber size, degeneration of fibers, and proliferation of sarcolemmal nuclei were observed in homozygous animals at 4 weeks of age (Fig. 3e). By 12 weeks of age, Dmd C3333Y animals exhibited extensive degeneration and necrosis, accompanied by endomysial fibroblasts (Fig. 3e–f and Extended Fig. 4f). Fibrosis and phagocytosis of necrotic muscle tissues were observed, with fat tissues replacing lost muscle tissues (Fig. 3e–f). Both male and female Dmd C3333Y animals showed significantly reduced muscular strength compared to heterozygous or wild-type littermates, indicated by gripping strength, hanging time, running distance, and time to exhaustion (Fig. 3g and Extended Data Fig. 4g, Supplementary Video 3–4). The animals also exhibited decreased kyphotic index, and extensive lung fibrosis when decease, which represents the respiratory failure observed in DMD patients (Extended Data Fig. 5h–i).
Comprehensive Lab Animal Monitoring System (CLAMS) analysis indicated that Dmd C3333Y animals exhibited similar food intake, but significantly reduced VO2, VCO2, and energy expenditure compared to wild-type littermates (Fig. 3h and Extended Data Fig. 4j–k). The Dmd C3333Y animals also exhibited elevated ACR (Urine Albumin-to-creatinine ratio), BUN (Blood urea nitrogen), and 24 hours serum creatinine compared to wild-type littermates (Extended Data Fig. 4l–m), which was consistent with typical indications of muscle damage and proteinuria.
Dmd C3333Y leads to cardiomyopathy and smooth muscle impairment
BMD and DMD patients experience cardiomyopathy26,27. Right ventricular ejection fraction (RVEF) and fraction shorting (RVFS) based on MRI imaging as well as left ventricular ejection fraction (LVEF) and fraction shorting (LVFS) based on echocardiography were found to be reduced in 24 week-old Dmd C3333Y mice (Fig. 4a–c). Electrocardiographic monitoring of the 46 week-old mice indicated atrioventricular blocks (AV block), irregularities in the PR intervals, and increased QRS intervals in Dmd C3333Y animals (Fig. 4d–e and Supplementary Video 5). Histological analysis indicated that 46-week old Dmd C3333Y hearts exhibit multiple areas of necrosis and fibrosis in both papillary muscles and interventricular septum (Fig. 4f–h).
Figure 4. Dmd C3333Y mutation causes heart and blood vessel irregularity.
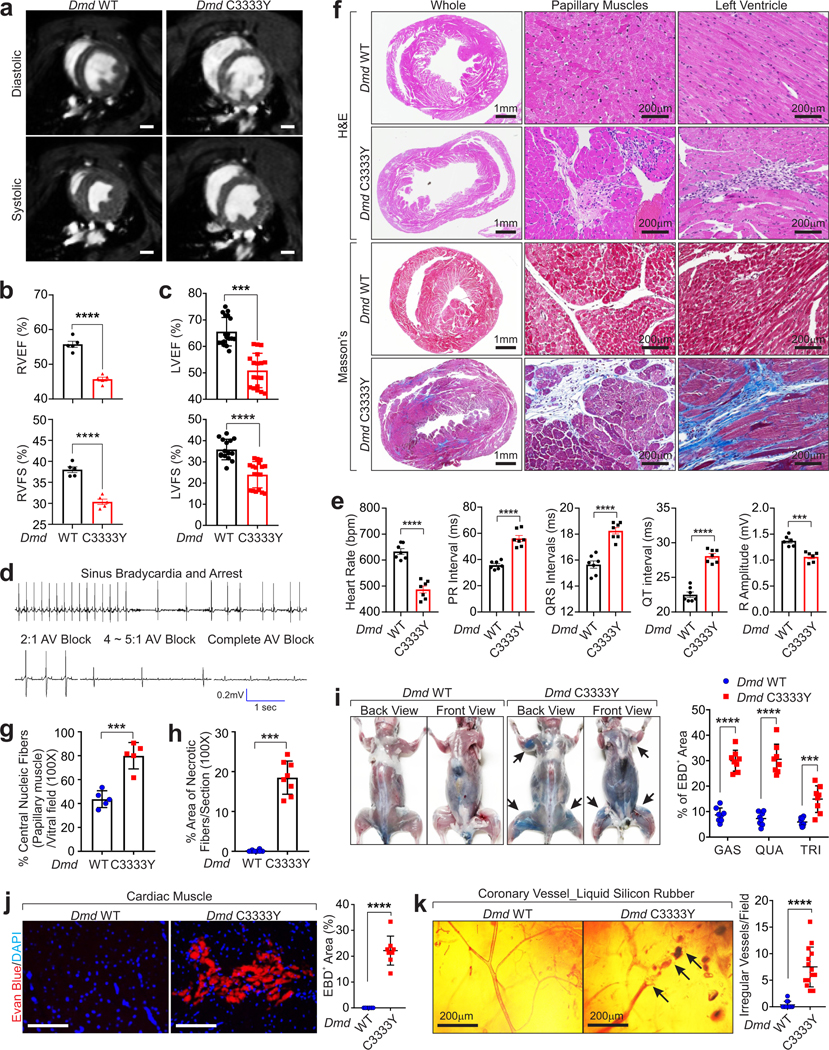
a, End-diastolic and end-systolic cine-MRI images from Dmd WT and Dmd C3333Y mice. Scale bars, 1 mm. b, RVEF (top) and RVFS (bottom) was measured with Image J based on the MRI images of Dmd WT and Dmd C3333Y mice at 24-week-old (n=5animals per group). Mean values±SEM, unpaired Student’s t-test. c, LVEF (top) and LVFS (bottom) of Dmd WT (n=15 animals) and Dmd C3333Y mice (n=18 animals) measured by echocardiography at 24-week-old. Mean values±SD, unpaired Student’s t-test. d, Representative ECG traces of Dmd C3333Y mice, showing sinus bradycardia, sinus arrest, and atrioventricular (AV) block. e, Statistical analysis of heart rate, PR interval, QRS duration over time, QT interval and R amplitude plotted from Dmd WT and Dmd C3333Y mice Lead II ECG at 46-week-old. Mean values±SEM, n=7 animals per group, unpaired Student’s t-test. f, Masson’s trichrome and H&E staining of cardiac cross sections of Dmd WT and Dmd C3333Y mice at 46-week-old. Scale bars, 1 mm or 200 μm. g-h, Percentage of central nucleic fiber (g) or necrotic area (h) of Dmd WT and Dmd C3333Y heart. Mean values±SD, n=5 (g) or 8 (h) animals per group, unpaired Student’s t-test. i, Left: front and back view of Dmd WT and Dmd C3333Y mice 24 hr-post EBD injection. Right: statistical analysis of EBD staining-positive area per muscle of Dmd WT and Dmd C3333Y mice. Mean values±SD, n=8 animals per group, two-way ANOVA. j, Representative images of IF detection of EBD penetration in cardiac muscle (left) and statistical analysis of EBD-positive area in Dmd WT and Dmd C3333Y heart (right). Scale Bars, 100 μm. Mean values±SD, n=8 animals per group, unpaired Student’s t-test. k, Left: transillumination microscope virtualization of silicon rubber perfused coronary arteries in Dmd WT and Dmd C3333Y mice, scale bars: 200 μm. Right: statistical analysis of the number of irregular blood vessels in Dmd WT and Dmd C3333Y hearts. Mean values±SD, n=11 animals per group, unpaired Student’s t-test. ***, p < 0.001, and ****, p < 0.0001. Statistical source data are provided as Source Data Fig. 4.
Dmd C3333Y mice displayed multiple areas of Evans blue dye (EBD) uptake in skeletal muscle fibers corresponding with acute histopathological features of necrosis (Fig. 4i). Cardiac muscle also showed EBD uptake in Dmd C3333Y mice, which was undetectable in wild-type littermates (Fig. 4j).
Microfil perfusion indicated that Dmd WT mice exhibit coronary microvessles, which were distributed normally and smoothly tapered in wild-type mice (Fig. 4k). In contrast, Dmd C3333Y mice displayed numerous areas of pronounced constrictions, as well as pre- and post-stenotic dilation and micro-aneurysms (Fig. 4k). Areas with extensive focal vascular lumen narrowing and sparseness of perfusion were observed, but not in wild-type littermates (Fig. 4k). These results suggested that Dmd C3333 plays important roles in the onset of myocardial ischemic lesions.
H19 mimic and Nifenazone inhibit TRIM63-dependent Ub-DMD
Dmd C3333Y skeletal muscle exhibits elevated Ub-DMD and concurrently reduced-but-measurable dystrophin protein levels; both Ub-DMD and dystrophin levels diminished at the age of 46 weeks (Extended Data Fig. 5a–c). These observations aligned with the reduced, yet detectable dystrophin levels measured in DMD C3340Y patients21. We hypothesized that inhibition of Ub-DMD could prolong the half-life of dystrophin and alleviate the symptoms of MD patients.
Two strategies were considered for potentially inhibiting Ub-DMD: 1) increase DMD-H19 interactions; 2) block the enzymatic activity of the E3 ligase TRIM63. To address this hypothesis, we collected iPS cell lines derived from a healthy donor and BMD patients (Extended Data Fig. 5d–e and Supplementary Table 1), which we further differentiated into SkMCs or CMs; Ub-DMD was robustly detected in BMD-derived cells (Supplementary Fig. 2a–c).
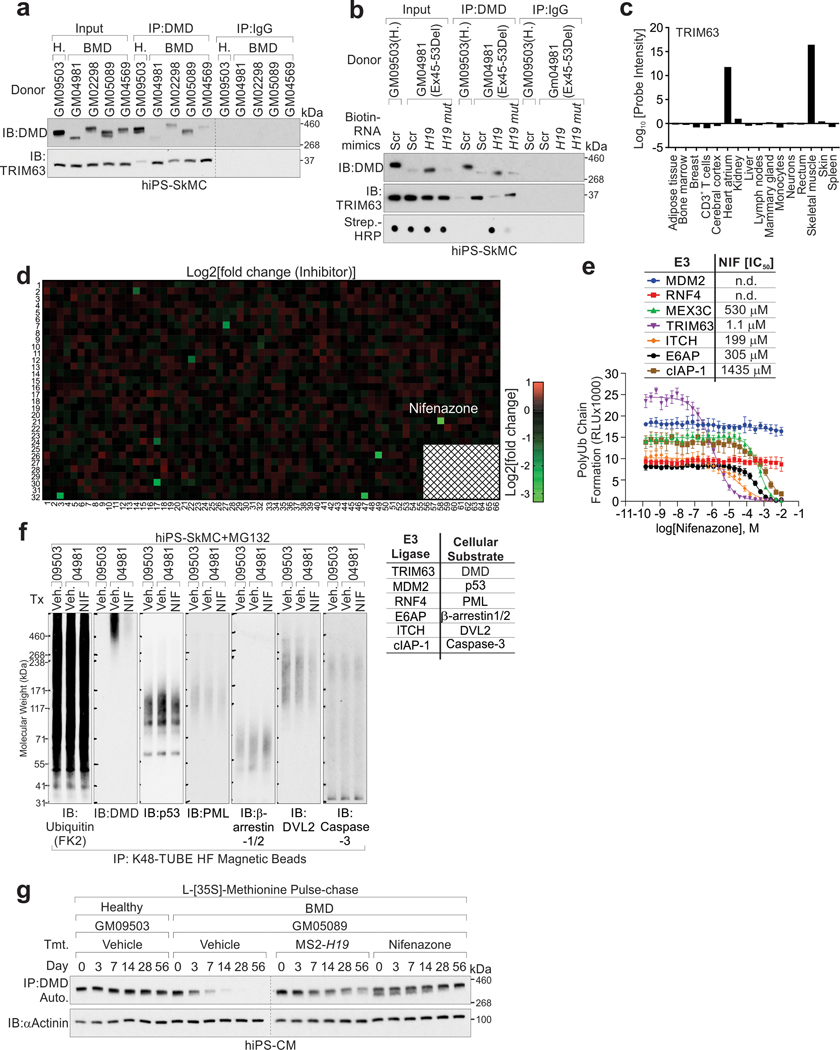
Compared to healthy donors, BMD iPS-SkMCs harbored reduced-yet-detectable dystrophin and DMD-H19 interactions (Fig. 5a–b). Conversely, TRIM63-dystrophin was increased compared to healthy donors (Extended Data Fig. 6a). H19 RNA mimics delivery, but not the mutant, blocked TRIM63-dystrophin interactions (Extended Data Fig. 6b).
Figure 5. H19 mimics and Nifenazone attenuate Ub-DMD.
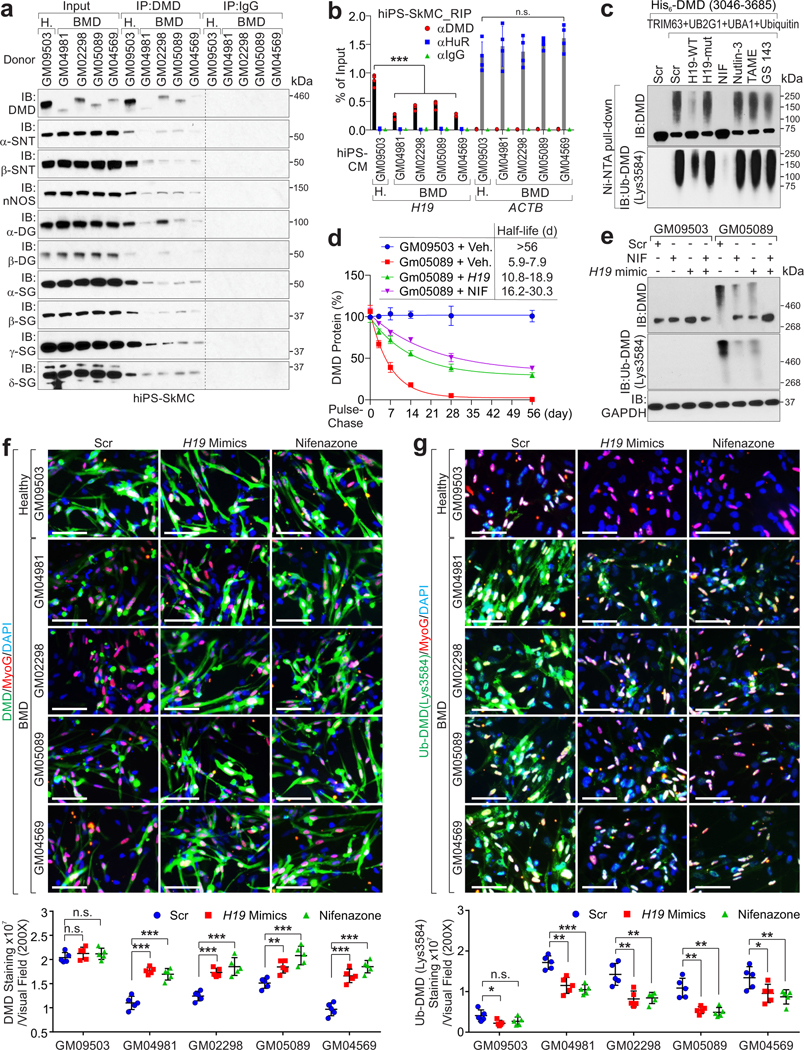
a, IP and IB detection of indicated proteins in hiPS-SkMCs derived from healthy donor (GM09503) or BMD patients (GM04981, GM02298, GM05089, GM04569). b, RIP assay using indicated antibodies in hiPS-SkMCs derived from healthy donor (GM09503) or BMD patients (GM04981, GM02298, GM05089, GM04569). Mean values±SD, n=4 independent experiments, two-way ANOVA. c, In vitro poly-Ub chain formation using His-tagged DMD (aa.3046–3685), UBA1, UB2G1, TRIM63, Ubiquitin, and indicated mimics or small molecular inhibitors. The Ub-DMD were subjected to Ni-NTA affinity resin pulldown and IB detection using indicated antibodies. d, Half-life determination of DMD protein in human iPSC-CMs introduced with H19 mimics or Nifenazone. Mean values±SD, n=3 independent experiments. e, IB detection of indicated proteins in iPS-SkMCs derived from healthy donor or BMD patient upon transfection of Scr mimic, H19 mimic or treatment Nifenazone (10 μM) for 72 hours. f, Representative images of IF using indicated antibody (top) and statistical analysis of DMD staining intensities (bottom) of hiPS-SkMCs derived from healthy donor or BMD patients, upon indicated treatments. Scale bars, 50 μm. Mean values±SD, n=5 independent experiments, two-way ANOVA. g, Representative images of IF using indicated antibodies (top) and statistical analysis of Ub-DMD (Lys3584) staining intensities (bottom) of hiPS-SkMCs derived from healthy donor or BMD patients, upon indicated treatments. Scale bars, 50μm. Mean values±SD, n=5 independent experiments, two-way ANOVA. No significance [n.s.], FDR > 0.05, *, FDR < 0.05, **, FDR < 0.01, ***, FDR < 0.001, and ****, FDR < 0.0001. Immunoblots are representative of two independent experiments. Statistical source data and unprocessed immunoblots are provided as Source Data Fig. 5.
TRIM63 exhibits specific expression in cardiac and skeletal muscles (Extended Data Fig. 6c). Using a screening platform that takes advantage of Ub-DMD antibodies, we indicated that Nifenazone (NIF), an analgesic for rheumatic conditions, exhibited effective inhibition of the enzymatic activities of TRIM63 in vitro (Extended Data Fig. 6d and Supplementary Table 6–7). In vitro Ub-DMD was inhibited in the presence of H19 WT or NIF, but not H19 LoF4 or the other E3 ligase inhibitors (Fig. 5c). We determined the IC50 value of NIF against representative E3 ligases including Ring-finger E3 ligase (TRIM63, MDM228, RNF429, MEX3C30, cIAP131), HECT family of E3 ligases (ITCH)32, and U-box E3 ligase (E6AP)33; finding that NIF exhibited effective inhibition against TRIM63 (IC50 value of 1.1 μM) and low inhibition of other E3 ligases (Extended Data Fig. 6e). The Ub-DMD, but not poly-Ub of MDM2-dependent p5328, RNF4-mediated PML34, E6AP-catalyzed β-arrestin-1/235, ITCH-dependent DVL236 or cIAP-1-mediated caspase-331 was inhibited by NIF (Extended Data Fig. 6f).
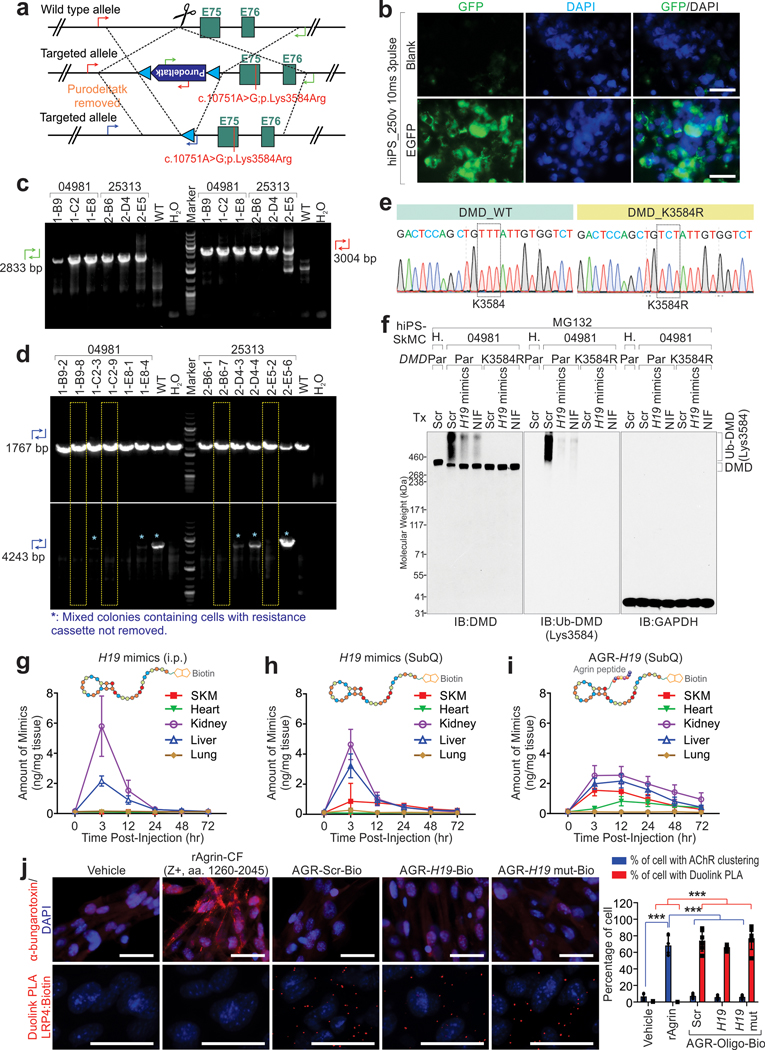
Compared to healthy donors, BMD iPS-CMs exhibited reduced dystrophin half-life (Fig. 5d and Extended Data Fig. 6g). H19 mimics or NIF stabilized dystrophin and attenuated the status of Ub-DMD (Lys3584) in the iPS-SkMCs and iPS-CMs derived from BMD patients (Fig. 5e–g, Extended Data Fig. 7a–g and Supplementary Fig. 3a–b). K3584R mutant knockin in BMD iPS-SkMCs exhibited abolished Ub-DMD, which was minimally affected following AGR-H19 or NIF treatment (Extended Data Fig. 8a–f), mechanistically validating the TRIM63-dependent poly-Ub of dystrophin.
AGR-H19 and Nifenazone alleviate muscular dystrophy
Inspired by peptide-facilitated macromolecular delivery37, we applied a Agrin (AGR)-derived peptide to improve skeletal and cardiac muscle-enriched distribution of H19 mimics in vivo. Agrin Z8 loop associates with LRP4 (low-density lipoprotein receptor-related protein 4) and MuSK (muscle-specific kinase)38, leading to formation of muscle acetylcholine receptor (AChR) clustering39. Peptides representing Agrin Z8 loop (AGR) were conjugated to the 2’-F-C modified40 H19 mimics, referred to as AGR-H19 (Fig. 6a and Supplementary Fig. 4). We determined the pharmacokinetics (PK) of biotin-labeled H19 or AGR-H19 mimics, finding a substantial amount of AGR-H19 in skeletal and cardiac muscles 3–72 hours after dosing (Extended Data Fig. 8g–i, 9a). AGR-tagged RNA mimics showed minimal effect on the formation of AChR clusters, but interactions with LRP4 (Extended Data Fig. 8j).
Figure 6. AGR-H19 alleviates the muscular dystrophy and cardiomyopathy.
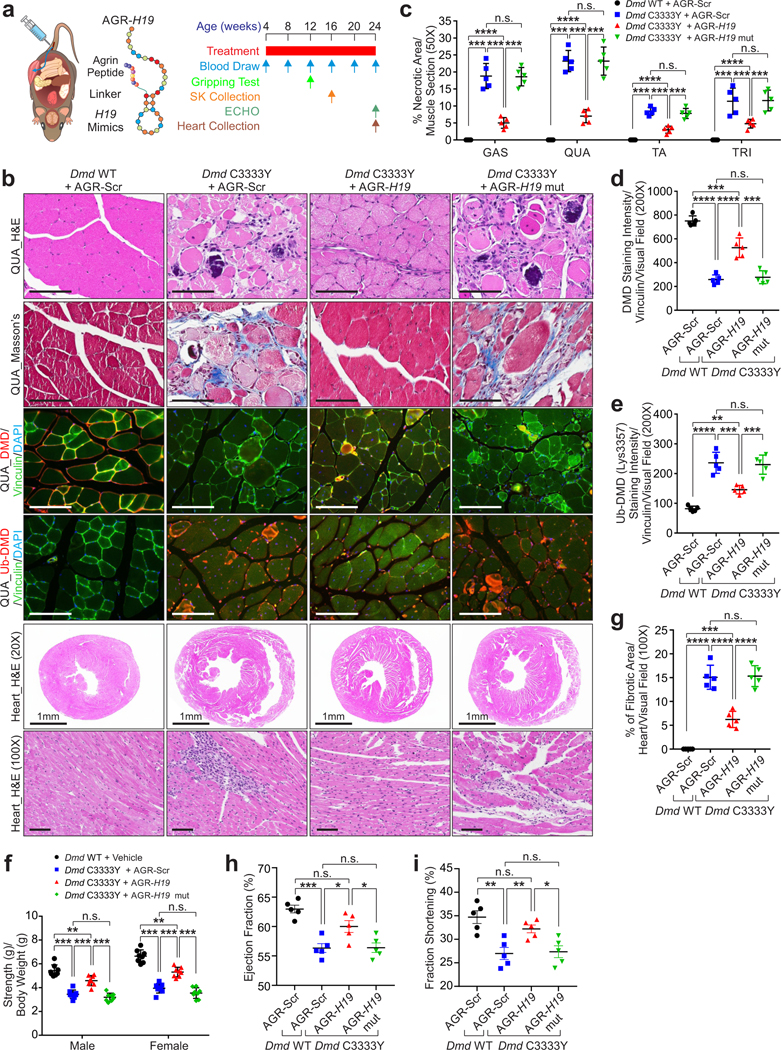
a, Left: schematic illustration of AGR-H19. Right, scheme of the experimental approach. b, Representative images of H&E staining, Masson’s staining, IF of DMD, Ub-DMD (Lys3584) of QUA and heart tissue H&E staining of Dmd WT or Dmd C3333Y mice subjected to AGR-Scr, AGR-H19 or AGR-H19 mut mimics as indicated. Scale bars: 1 mm (specified) or 100 μm (unspecified). c, Percentage of necrotic area of Dmd WT or Dmd C3333Y mice subjected to indicated AGR-Scr, AGR-H19 or AGR-H19 mut mimics. Mean values±SD, n=5 animals per group, two-way ANOVA. d-e, Statistical analysis of DMD (d) and Ub-DMD (Lys3584) (e) staining intensities of QUA muscle of Dmd WT or Dmd C3333Y mice subjected to indicated AGR-Scr, AGR-H19 or AGR-H19 mut mimics. Mean values±SD, n=5 animals per group, one-way ANOVA. f, Mouse forelimb muscle strength test of male or female Dmd WT or Dmd C3333Y mice subjected to indicated AGR-Scr, AGR-H19 or AGR-H19 mut mimics. Mean values±SD, n=8 animals per group, two-way ANOVA. g, Percentage of fibrotic area in the heart of Dmd WT or Dmd C3333Y mice subjected to indicated AGR-Scr, AGR-H19 or AGR-H19 mut mimics. Mean values±SD, n=5 animals per group, one-way ANOVA. h-i, Ejection fraction % (h) or fraction shortening % (i) assessment of Dmd WT or Dmd C3333Y mice subjected to indicated AGR-Scr, AGR-H19 or AGR-H19 mut mimics. Mean values±SD, n=5 animals in each group, one-way ANOVA. No significance [n.s.], p > 0.05, *, p < 0.05, **, p < 0.01, ***, p < 0.001, and ****, p < 0.0001. Statistical source data are provided as Source Data Fig. 6.
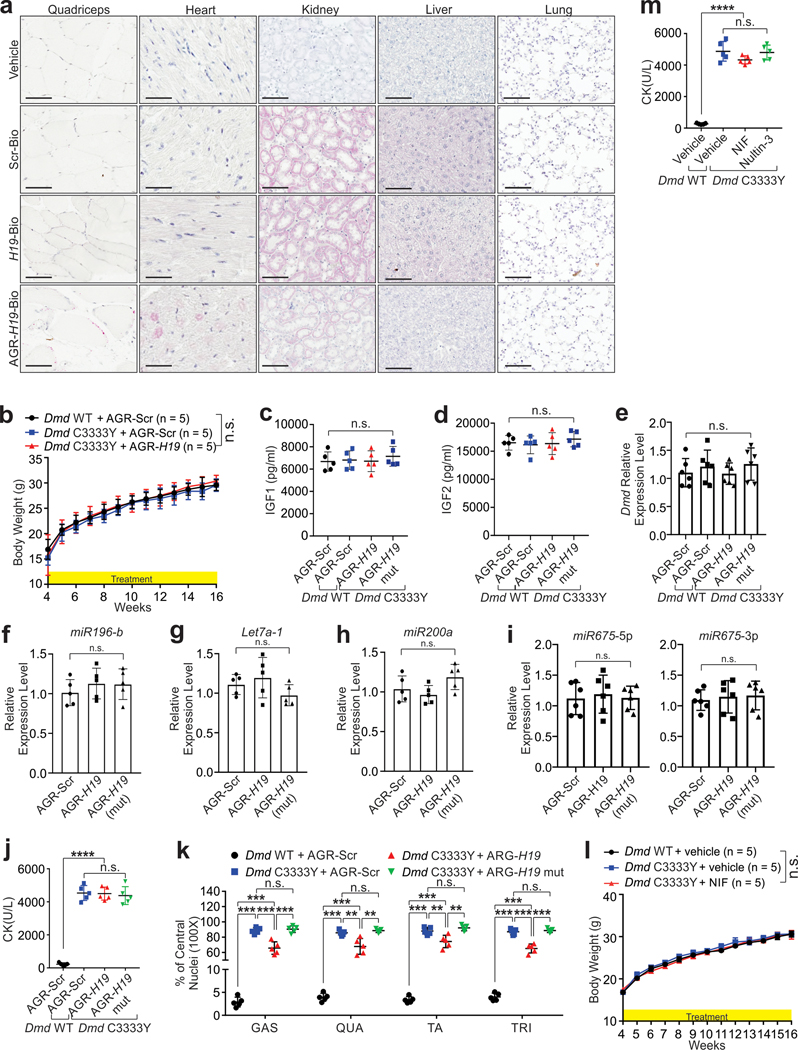
We applied the AGR-H19 mimics to Dmd C3333Y mice from 4 to 16 or 24 weeks-of-age to determine skeletal or cardiac muscle function, respectively (Fig. 6a). To rule out potential indirect effects, we included an AGR-H19 mut as a negative control. AGR-H19 exhibited minimal effects on the body weight, liver or kidney function, serum IGF1/IGF2, or expression status of microRNAs we tested in Dmd C3333Y animals (Extended Data Fig. 9b-i and Supplementary Table 8). Although Dmd C3333Y animals subjected to AGR-H19 treatment exhibited similar blood CK levels compared to Scr-treated animals, Dmd C3333Y skeletal muscles exhibited reduced necrotic area and percentages of central nuclei-containing fibers (Fig. 6b–c and Extended Data Fig. 9j–k). Animals treated with AGR-H19 exhibited elevated dystrophin and reduced Ub-DMD levels in sarcolemma, as well as improved strength (Fig. 6b–f). Treated Dmd C3333Y hearts showed reduced fibrotic area and increased left ventricular ejection fraction and fraction shortening H19 (Fig. 6b and 6g–i).
Treatment of NIF minimally affected on body weight, blood CK levels, and liver and kidney function (Fig. 7a, Extended Data Fig. 9l–m and Supplementary Table 8). NIF, but not Nultin-3, significantly reduced the necrotic area and central nucleic fibers of Dmd C3333Y animals, with restored dystrophin and decreased Ub-DMD levels (Fig. 7a–d). Administration of Nifenazone significantly improved the strength of Dmd C3333Y animals (Fig. 7e). Furthermore, Dmd C3333Y hearts showed reduced fibrotic area and improved function upon NIF treatment (Fig. 7f–g).
Figure 7. Nifenazone relieves muscular dystrophy and improves skeletal and cardiac muscles function.
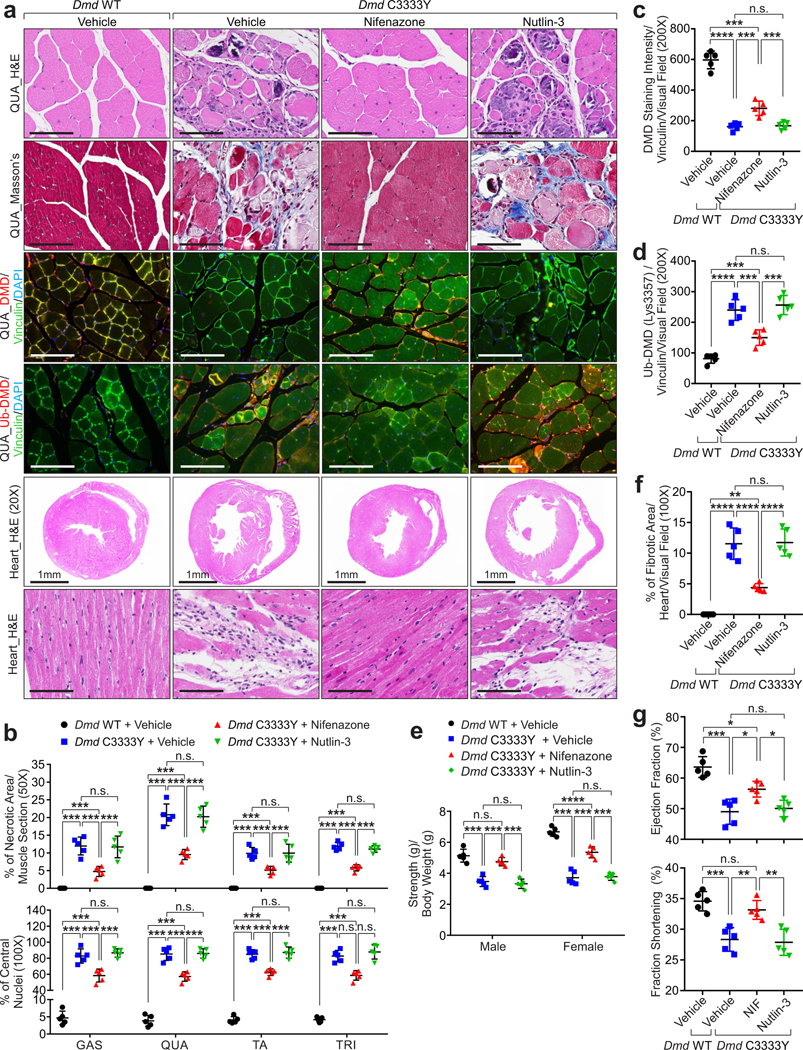
a, Representative images of H&E staining, Masson’s staining, IF of DMD, Ub-DMD (Lys3584) of QUA and heart tissue H&E staining of Dmd WT or Dmd C3333Y mice subjected to vehicle, Nifenazone or Nutlin-3 treatment. Scale bars: 1 mm (specified) or 100 μm (unspecified). b, Percentage of muscle fiber necrotic area (top) or muscle fibers with centrally located nuclei (bottom) of Dmd WT or Dmd C3333Y mice subjected to vehicle, Nifenazone or Nutlin-3 treatment. Mean values±SD, n=5 animals per experimental group, two-way ANOVA. c-d, Statistical analysis of DMD (c) and Ub-DMD (Lys3584) (d) staining intensities of QUA of Dmd WT or Dmd C3333Y mice subjected to vehicle, Nifenazone or Nutlin-3 treatment. Mean values±SD, n=5 animals per experimental group, one-way ANOVA. e, Mouse forelimb muscle strength test of male or female Dmd WT or Dmd C3333Y mice subjected to vehicle, Nifenazone or Nutlin-3 treatment. Mean values±SD, n=5 animals per experimental group, two-way ANOVA. f, Percentage of fibrotic area in the heart of Dmd WT or Dmd C3333Y mice subjected to vehicle, Nifenazone or Nutlin-3 treatment. Mean values±SD, n=5 animals per experimental group, one-way ANOVA. g, Left ventricular Ejection Fraction % (top) or Fraction Shortening % (bottom) assessment of Dmd WT or Dmd C3333Y mice subjected to vehicle, Nifenazone or Nutlin-3 treatment. Mean values±SD, n=5 animals in each group, one-way ANOVA. No significance [n.s.], p > 0.05, *, p < 0.05, **, p < 0.01, ***, p < 0.001, and ****, p < 0.0001. Statistical source data are provided as Source Data Fig. 7.
Antisense oligonucleotides-mediated exon-skipping results in elevated dystrophin status in both animals and clinical trials41. Phosphorodiamidate morpholino antisense oligonucleotides (PMO), have been shown to be effective in improving DMD patient strength and walking distances42. However, the administration of exon-skipping leads to the development of a BMD-like phenotype, by which the expressed dystrophin might exhibit increased Ub-DMD and protein degradation. iPSCs derived from DMD patients subjected to h44AON1-mediated exon-skipping showed partially restored protein expression of dystrophin, with robust Ub-DMD status (Fig. 8a–c). H19 mimics interacted with truncated dystrophin (Ex45Del) and inhibited the recruitment of TRIM63 to truncated dystrophin (Extended Data Fig. 10a). H19 mimics or NIF treatment significantly reduced the Ub-DMD status and improved the protein level of dystrophin in K3584-dependent manner (Fig. 8a–c and Extended Data Fig. 10b–f).
Figure 8. AGR-H19 or Nifenazone enhances DMD protein in combination with exon-skipping therapy.
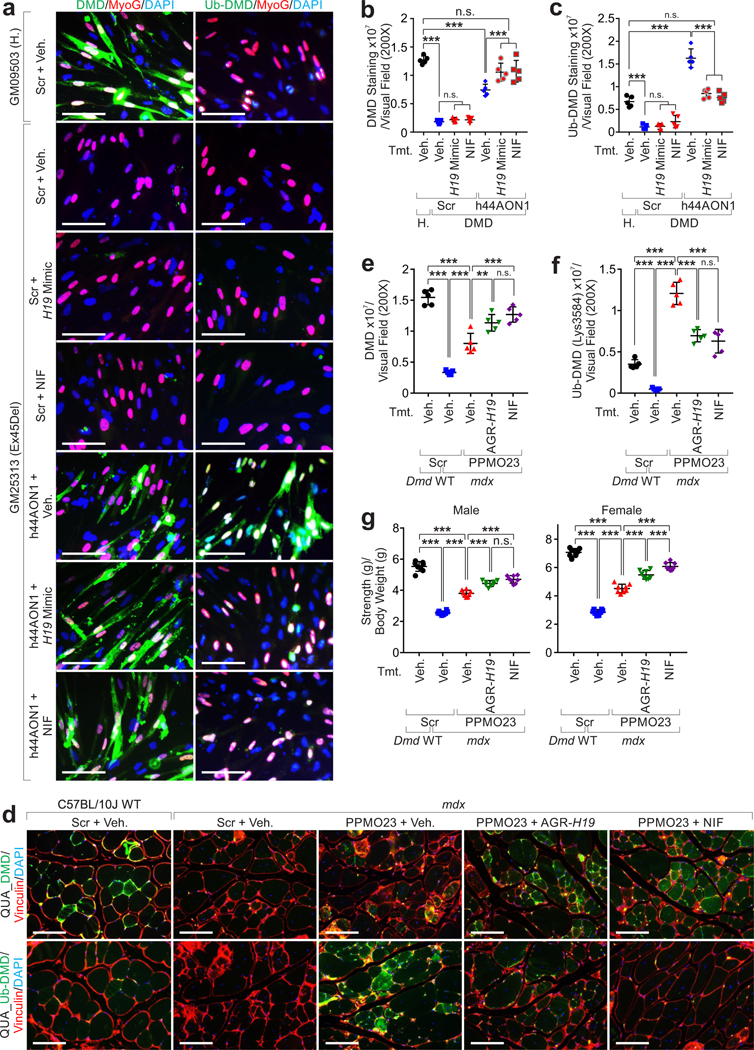
a-c, Representative images (a), statistical analysis of DMD (b) and Ub-DMD (c) of IF staining of iPS-SkMCs derived from health donor (GM09503) or DMD patient (GM25313), treated with scramble and vehicle, h44AON1, in combination with H19 mimics or Nifenazone, respectively. Scale bars (a), 50 μm. Mean values±SD (b, c), n=5 independent experiments, one-way ANOVA. d-f, Representative images (d), statistical analysis of DMD (e) and Ub-DMD (f) intensities of IF staining of C57BL/10J QUA treated with scramble RNA and vehicle, or mdx QUA treated with scramble, PPMO23 alone or in combination with AGR-H19 or Nifenazone, respectively. Scale bars (d), 100 μm. Mean values±SD (e, f), n=5 animals per experimental condition, one-way ANOVA. g, Forelimb strength of both male and female C57BL/10J mice treated with scramble RNA and vehicle, or mdx mice treated with scramble, PPMO23 alone or in combination with AGR-H19 or Nifenazone, respectively. Forelimb strength was tested and normalized by bodyweight. Mean values±SD, n=8 animals per group, two-way ANOVA. No significance [n.s.], p > 0.05, *, p < 0.05, **, p < 0.01, ***, p < 0.001, and ****, p < 0.0001. Statistical source data are provided as Source Data Fig. 8.
Mdx mice subjected to PMO conjugated with a cell-penetrating peptide (PPMO23) as previously reported43,44, exhibited partially restored expression of dystrophin in skeletal muscle and robust poly-Ub (Fig. 8d–f). Co-treatment with AGR-H19 or NIF significantly increased the protein levels of dystrophin and reduced the status of Ub-DMD and animal strength in PPMO23-treated mdx mice (Fig. 8d–g).
Taken together, our research findings suggested that dystrophin is subjected to TRIM63-mediated poly-Ub and protein degradation (Supplementary Fig. 5), illustrating one of the mechanisms of muscular dystrophy. Administration of AGR-H19 or Nifenazone may alleviate the progression of muscular dystrophy, providing a promising therapeutic strategy for BMB and certain DMD patients both alone or in combination with exon-skipping therapy strategies.
Discussion
The low or undetectable levels of dystrophin protein in BMD and certain DMD patients harboring point mutations and in-frame deletions might be at least partially due to the shortened half-life of dystrophin, mediated by TRIM63-dependent poly-Ub. H19 competes with TRIM63 in interacting with ZNF of dystrophin to hinder the poly-Ub and degradation of the protein. Genetic evidence suggested that Dmd C3333Y animals exhibit a progressive muscular dystrophy phenotypes that model human DMD patients harboring C3340Y. BMD hiPSC-SkMCs and CMs exhibit elevated Ub-DMD, suggesting that a cohort of BMD patients exhibit increased incidence of dystrophin poly-Ub and expeditious dystrophin turn-over. Antibody targeting Ub-DMD could potentially identify BMD patients who could benefit from a treatment that inhibits dystrophin degradation. Administration of AGR-H19 and Nifenazone provides potential therapeutic complements in combination with current exon-skipping technologies to stabilize dystrophin protein following PMO treatment, improving the efficacy of alleviating the progression of muscular dystrophy.
The reduced life-span of C3333Y mice might due to the dystrophy of the diaphragm, cardiac muscles, and smooth muscles, which could be less affected in mdx mice45. Micro-dystrophins, including dp116 and dp71 could be degraded in C3333Y mice. Transgenic expression of dp116 extends the lifespan of animals lacking both dystrophin and utrophin46. The AAV-mediated expression of dp116 in mdx TA was subjected to fast loss46. One possibility is that the AAV-expressed dp116 might also being subjected to TRIM63-mediated poly-Ub and interstitial protein degradation, which could be attenuated by AGR-H19 or Nifenazone.
ZNF has been established as a typical RNA binding domain14 and plays important roles in mediating the interactions between dystrophin and β-dystroglycan47. C3340 serves as one of the conserved residues of typical C2-H2 zinc fingers48. It is possible that C3340Y impairs the docking of zinc ions, causing potential conformational changes in this domain. In-frame deletion of DMD in BMD patients leads to a truncated form of dystrophin49. Given the binding of N- and C-termini of dystrophin to the cytoskeleton50, truncated dystrophin experiences potential conformational changes in the ZNF. For DMD patients, exon-skipping technologies convert out-of-frame deletions into in-frame deletions51, producing BMD-like phenotypes; the newly translated, yet truncated form of dystrophin is subjected to fast turn-over. To overcome these impairments, AGR-H19 competes with TRIM63 in interacting with mutated/truncated dystrophin; and Nifenazone inhibits enzymatic activities of TRIM63.
H19 has been shown to be upregulated in multiple tumor types and serves as a microRNA precursor52; however, the 30-nt. H19 mimics we developed did not affect the status of these microRNAs. H19 mimics administration H19 minimally affected the RNA expression status of H19, the RNA/protein levels of IGF1 and IGF2, and the mRNA levels of DMD. Hence, our data suggested that the administration of AGR-H19 leads to minimal risk of tumorigenesis.
The skeletal and cardiac muscle-specific expression of TRIM63 situates this protein as a promising therapeutic target for muscular dystrophy. Nifenazone effectively inhibited the TRIM63-dependent protein degradation of dystrophin and possibly other cellular targets. Nifenazone has been used as an analgesic for certain rheumatic disorders53, and the mild side effects53 ensure safe long-term application. Hence, our data situates Nifenazone as a promising candidate for alleviating the clinical impact associated with muscular dystrophies.
Methods
In vivo murine models and treatment
All animal-based research was conducted according to the guidelines and requirements set forth by the Public Health Service Policy on Humane Care and Use of Laboratory Animals, the U.S. Department of Health and Human Services Guide for the Care and Use of Laboratory Animals, and the Animal Welfare Act of 1966 as amended by the Institutional Animal Care and Use Committee of the University of Texas M.D. Anderson Cancer Center. The study is compliant with all relevant ethical regulations regarding animal research. Using a CRISPR/cas9 Extreme Genome Editing System (EGE™ Biocytogen), we knocked in a one-nucleotide mutant into the mouse Dmd gene (ChrX:85,141,770 G>A in C57BL/6N mice) to achieve a mouse Dmd C3333Y mutant. Two independent pronuclear injections and six founder mice were initially achieved, and all the conducted studies were based on the offspring of the six founder mice; we included Dmd WT littermates as a control. StepOne™ Software (ThermoFisher) was used for data acquisition for TaqMan genotyping PCR. The blood CK concentration was determined at the age of 4, 12, and 24 weeks of age. The survival time of the mice was recorded as the mice natural death or requested euthanasia by the veterinarian due to weakness or moribund status. To obtain unbiased and reliable results, all the mice of the same age and the same gender were randomly grouped and housed in the same housing room. All animals were housed with a 12 h light/ 12 h dark cycle in the animal facility with free access to water and food. All of the mice were housed at temperatures of 65–75°F (~18–23°C) with 40–60% humidity.
For the AGR-H19 treatment, AGR-Scr, AGR-H19 or AGR-H19 mut was applied (10 mg/kg, subQ, every three days) starting from 4 weeks of age till 16 or 24 week-of-age. Body weight was measured weekly. For the Nifenazone treatment, Nifenazone or nutlin-3 was applied (10 mg/kg i.p. daily) starting from 4 weeks of age 16 or 24 week-of-age. The control group was injected an equal volume of vehicle. Both male and female Dmd WT and Dmd C3333Y mice were included in the experimental settings. General health condition, grooming, and behavior for all animals were monitored daily, and injection sites were checked for signs of redness or edema.
Human tissues and induced pluripotent stem cells (iPSC)
De-identified fresh frozen human skeletal muscle tissues were purchased from ProteoGenex Inc. The study protocol was approved by the Institutional Review Board of MD Anderson Cancer Center, University of Texas. Clinical information is summarized in Supplementary Table 1.
All hiPSC studies were approved by HEIP Stem Cell committee of the University of Texas, MD Anderson Cancer Center. De-identified human BMD patient’s donor fibroblasts cells (GM04569, GM05089, GM02298 and GM04981) and healthy donor fibroblast cells (GM09503) were obtained from Coriell Institute and reprogramed to iPS cells at Human Stem Cell Core (Baylor College of Medicine). The human DMD patients donor iPS cells (GM25313) were obtained from Coriell Institute. Clinical information is summarized in Supplementary Table 1. IPS cells were cultured on hESC-Qualified Matrigel (Corning) coated plates and maintained in feeder-free mTeSR™1 medium (Stemcell Technologies). The pluripotency of these iPSCs were verified using Human Pluripotent Stem Cell Functional Identification Kit (R&D Systems, Catalog # SC027). Antibodies with dilution information are listed in Supplementary Table 10. hiPS cells were differentiated to cardiomyocytes and skeletal muscle cells using the STEMdiff™ Cardiomyocyte Differentiation Kit (Stemcell Technologies) and skeletal muscle differentiation protocol previously described54.
Exon skipping therapies combined with H19 mimics or Nifenazone treatment
Mdx (C57BL/10ScSn-Dmdmdx/J) mice and wild type C57BL/10J mice were obtained from The Jackson Laboratory. The phosphorodiamidate morpholino modified antisense oligomer against the exon 23 of DMD gene (PPMO23) was synthesized and conjugated to the cell-penetrating peptide (RXRRBRRXRRBRXB) (Gene-Tools, LLC.). Male mdx mice were subjected to PPMO23 (15 mg/kg, i.v., biweekly), from 4 week of age, and combined with AGR-H19 (10 mg/kg s.q., every three days) or Nifenazone (10 mg/kg i.p. daily), and the experiment was terminated at 24 week of age. Male wild type C57BL/10J mice of same age were included as control group. The human antisense oligonucleotide (AON) against the exon 44 (h44AON1) of the human DMD gene was synthesized using phosphorothioated 2’O-Methyl RNA oligomers (Biosynthesis Inc.) and delivered to iPS-SkMCs/-CMs, scramble RNA was delivered as the negative control. H19 mimics and Nifenazone was used to treat the iPS-SkMCs/-CMs in combined with h44AON1, vehicle was used as the negative control. All cells were harvested 7 days post-treatment. Oligonucleotide sequences are included in the Supplementary Table 9.
Dystrophin protein half-life detection by Pulse chase assay
The half-life of dystrophin protein (DMD) was evaluated by pulse-chase assay. Human iPS derived cardiomyocytes were dissociated and passaged into 6-well plates at a density of 3×10⁵ cells/well in a cardiomyocyte maintenance medium (Stemcell Technologies) on day 14 of cardiomyocyte differentiation. 24 hours later, the hiPC-CM derived from the healthy donor (GM09503) were induced with 1 μg/ml doxycycline to knocked out H19 and transfected with MS2-tagged WT or mutants H19. 48 hours after passaging, the hiPS-CMs were treated with 0.1 mCi [35S] methionine (Perkin-Elmer) in methionine-free DMEM (Thermo Fisher Scientific) with 1% dialyzed bovine serum for 48 hrs. After [35S]-methionine treatment, the media was then changed to a cardiomyocyte maintenance medium. The cells were harvested at varying chase points (72 hrs after replacing the medium was counted as the 0 day of half-life detection), and the cell lysates were used to do the immunoprecipitation experiments. Antibodies with dilution information are listed in Supplementary Table 10. Immunoprecipitates were analyzed by autoradiography. The autoradiography signals corresponding to dystrophin protein (~430 kDa) were quantified using ImageJ software. Protein levels at varying chase points were normalized to the 0 day intensity of dystrophin protein and expressed as relative % integrated intensity.
Pharmacokinetics (PK) studies of RNA mimics
The RNA mimics were synthesized by Bio-synthesis Inc, and the oligonucleotide sequences are listed in the Supplementary Table 9. The linker connecting peptide and RNA oligonucleotide is succinimidyl 4-(N-maleimidomethyl) cyclohexane-1-carboxylate (SMCC). To characterize the pharmacokinetics of H19 mimics and AGR-H19, the biotinylated H19 mimics or AGR-H19 (10 mg/kg) were subcutaneously or intraperitoneally injected into wild type C57BL/6 mice. The skeletal muscles, cardiac muscles, livers, kidneys, and lungs of animals 3, 12, 24, 48, or 72 hr post-injection were collected (n=5 animals per time point). Tissues were subjected to immunohistochemistry using streptavidin alkaline phosphatase conjugates and small RNA isolation as manufacture’s instructed using miRCURY™ RNA Isolation Kits (Qiagen). Using a dot-blot, we titrated the biotin-labeled H19 mimic or AGR-H19 mimics using a 2-fold dilutions ranging from 1 μg to 1pg. We also plotted the RNA extracted from skeletal muscle, cardiac muscle, liver, kidney, and lung at indicated time points. The blotted biotin-labeled H19 mimics and AGR-H19 mimics were detected using streptavidin-HRP. By comparing the blot densities, we calculated the concentrations of H19 mimics and AGR-H19 as ng/g tissue. Pharmacokinetic parameters were determined by nonlinear regression analysis.
Generation of iPS knockin cell lines
sgRNAs were designed to target upstream of the Exon 75 of the gene DMD located in Chromosome X. For the targeting site, candidate guide RNAs were designed by the CRISPR design tool (http://www.sanger.ac.uk/). Guide RNAs were screened for on-target activity use UCA™. UCA™ (Universal CRISPR Activity Assay), a sgRNA activity detection system developed by Biocytogen, is simpler and more sensitive than MSDase assay. To minimize random integrations, we employ a circular donor vector. The targeting vector containing PuroDeltatk cassette and 2 homology arms of left (1428 bp) introducing a point mutation with a single base substitution (c.10751A>G) and right (1286 bp) each was used as a template to repair the DSBs generated by Cas9/sgRNA. sgRNA1 and targeting vector were electroporated into iPS cell line. For electroporation, 500 μL of cell suspension, 7.5 μg gRNA plasmid, 7.5 μg spCas9 plasmid, and 10 μg DNA template plasmid were mixed in a 4 mm cuvette (Bio-Rad) and immediately electroporated with a Bio-Rad Gene Pulser. Electroporation parameters were set at 250 V, 500 μF, and infinite resistance. After drug resistance selection (puromycin 2 μg/ml), 96 resistant single cell derived colonies were picked for each parental cell line and expanded. 6 homozygous clones for each parental cell line were obtained by further genotyping characterization and PCR product sequencing. The colonies harboring the resistance cassette were further subjected to cre-recombinase mediated removal of the resistance cassette as described previously55. pCAG-CRE, expressing the Cre recombinase gene, was obtained from Addgene. The primers for genotyping are listed in Supplementary Table 9. The primer used for each genotyping were indicated in the corresponding figure legend.
CRISPR/Cas9-mediated gene editing
H19 and Dmd knockout mouse cell lines and hiPS-CMs and hiPS-SkMC cells were generated using the CRISPR/Cas9 genome editing system. 293FT cells were obtained from ThermoFisher (Cat # R70007). gRNA sequence listed in the Supplementary Table 9.
Cells and tissues immunofluorescence (IF) staining and AChR clustering
The myoblasts cell-derived human iPS cells were passaged into 24 well plates, which were placed with cover glasses inside and coated with collagen I. When the myoblasts reached confluence after being maintained in the skeletal myoblast medium for 4–6 days, H19 KO lentivirus was induced followed by transfection with lentivirus carrying wild type H19 or mutants. The medium was switched to a myotube medium 24 hours after transfection. After being cultured in the myotube medium for 4 days, the skeletal myotubes were fixed with 4% paraformaldehyde solution. AChR clustering was performed as previously described56. The images were visualized with a Zeiss Axioskop2 plus Microscope. AxioVision Software v4.8.2.0 (Carl Zeiss) was used for acquisition of microscopic images. All immunostained slides were scanned on the APERIO Scan Scope XT (Leica Biosystems) for quantification by digital image analysis. The quantification of IF staining density was performed by Image-pro plus 6.0 (Media Cybernetics) and calculated based on the average staining intensity and the percentage of positively stained cells.
Crosslinking and ImmunoPrecipitation (CLIP)
CLIP assays were performed as previously described57. After immunoprecipitation using antibodies targeting DMD (Abcam, ab15277), the RNA-protein complexes were digested under the + RNase condition or +++ RNase over-digestion condition (negative control) and subjected to SDS-PAGE and autoradiography. The RNAs fragments were extracted, ligated, reverse transcribed, and ligated into the vector pCR-Blunt for Sanger sequencing. RNA linkers for ligation: RL5: 5’-AGG GAG GAC GAU GCG G-3’; RL3: 5’-GUG UCA GUC ACU UCC AGC GG-3’. DNA primers for reverse transcription are DP5: 5-AGG GAG GAC GAT GCG G-3’; and DP3: 5’-CCG CTG GAA GTG ACT GAC AC-3’. Antibodies with dilution information are listed in Supplementary Table 10.
RNA Immunoprecipitation (RIP) assay, immunoprecipitation, and MS2-TRAP
RIP assays were performed as previously described58. CFX Manager™ Software v3.1 (BioRad) was used for data acquisition for quantitative PCR. To perform MS2-TRAP (MS2-tagged RNA affinity purification) assay59, MS2-tagged H19 RNA, wild type or mutant, and MS2-binding protein (MS2-BP) was expressed in H19-deficient cells. MS2-tagged H19 was immunoprecipitated and MS2-tagged H19-associated DMD protein was detected using immunoblotting. Antibodies with dilution information are listed in Supplementary Table 10.
RNA electrophoretic mobility shift assay (EMSA)
Electrophoretic mobility-shift assays (EMSA) were used to confirm the direct binding of H19 with DMD as previously described16, using 500 ng recombinant His-tagged DMD (aa. 3046–3685), 0.035 pmol γ−32P labeled human H191951−80 probe with or without 7 pmol cold RNA competitors as indicated.
Determination of Kd value using alpha assay
Alpha binding assay was used to quantitatively assess the interaction between H19 and DMD using biotinylated H19 and His-tagged DMD C-termini (aa. 3046–3685) as the donor and acceptor pair. The Kd was determined by a competition experiment in which WT H19 or four potential loss-of-function (LoF) mutations (LoF1, LoF2, LoF3 and LoF4) was titrated (2-fold dilution) from 10 μM to 0.1 nM. Streptavidin donor beads and anti-His6 AlphaLISA acceptor beads were used in these assays (PerkinElmer). The plates were read on the EnSpire Multimode Plate Reader (PerkinElmer). The competitive inhibition curves were calculated based on alpha signal readings by fitting to a “log (inhibitor) vs. response-variable slope (four parameters)” model (GraphPad Prism 8 software).
Mass spectrometry analysis
Mouse DMD protein pulldown was performed in H19-proficient or deficient C2C12 differentiated myotubes to identify binding proteins and post-translational modification of DMD protein as previously described16. The eluted peptides were sent to the MD Anderson Cancer Center Proteomics Facility for Liquid chromatography–mass spectrometry (LC-MS) analysis. Xcalibur version 2.2 SP1.48 (Thermo Fisher Scientific) in cooperation with Q Exactive tune application version 2.2 SP1 Build 1646 (Thermo Fisher Scientific) was used for data acquisition for proteomics analyses.
In vitro ubiquitination assay
In vitro ubiquitination assay was performed as previously described16. The reactants were subjected to immunoblotting using the indicated antibodies.
Tissue collection and immunohistochemistry (IHC)
Unless otherwise indicated, mice were fasted for 4–6 h, anesthetized with isoflurane, used to collect blood via heart puncture, and then sacrificed. Tissues were dissected, weighed, and either dipped in liquid nitrogen or fixed in 10% formalin solution. Pectoralis, triceps, quadriceps, gastrocnemius and tibialis anterior muscles were dissected on one side of the body. H&E and Masson’s trichrome staining was performed to characterize skeletal and cardiac muscle pathology. The samples were sectioned to 4 μm thickness for the H&E, IHC and IF staining, and 7 μm for the Masson’s Trichrome staining. Antibodies with dilution information are listed in Supplementary Table 10.
Comprehensive Lab Animal Monitoring System (CLAMS)
Comprehensive Lab Animal Monitoring System was used to record the food, water intake, O2 consumption, CO2 expenditure and energy expenditure. The 12 weeks old mice were grouped randomly, and 4 mice were included in each group. Data read and record was proceeding 7 times per hour, and each mouse was housed and recorded for 72 hours.
Forelimb grip strength test and hanging test
A forelimb grip strength test was used to measure the strength of the mice forelimbs, as previously described60. The body weights of the mice were recorded prior to the test. The maximum grip strength was determined and normalized by body weight. A four-limb hanging test was introduced to assess the balance, coordination, and muscle dysfunction of the mice61. The test session ended when the mice were able to hang for duration of 600 sec. The test was performed three times for each mouse, and the maximum hanging time was adopted for further analysis.
Run-to-Exhaustion test
Exhaustion treadmill running was performed as previously described62. Mice were repeatedly exercised twice weekly for 2 weeks using a treadmill with X-PAD software v1.0 (Ugo Basile, 57631, Stoelting). When performing the exhaustion test, the mice were placed on a treadmill with a 15° incline. We increased the speed from 6 m/min to 26 m/min with 2 m/min increments and each increment lasting 2 min. Mice were considered to have reached the point of exhaustion when they made contact with the grid for a period of greater than 5 s.
Echocardiography and Magnetic Resonance Imaging (MRI)
Rodent echocardiography were performed by placing the anesthetized mice in a supine position atop a heating pad to maintain body temperature. The concentration of isoflurane was adjusted to keep a target heart rate of 450 ± 50 beats per minute (bpm). A rectal probe was gently inserted to continuously monitor and adjust body temperature (37.0 °C ± 0.5 °C) via the heating pad. Electrode gel was applied to all four paws, which were then taped to the ECG electrodes. The mice were subjected to transthoracic echo using Vevo 2100 (MS-550D, 22–55MHz, VisualSonics Inc., Toronto, ON, Canada). 7T small animal MR system (Bruker Biospin MRI, Billerica, MA) was used to evaluate the heart morphology of the mice.
Electrocardiogram (ECG)
Surface Lead II ECG recordings were performed in consciousness and freely mobile mice of 40 weeks old. Implantable radio transmitters (EasyTEL S-ETA, 1.8 cc, 3.1g, EMKA Technologies) were implanted in the peritoneal cavity of the mice. The negative lead was sutured on the intercostal muscles on right thoracic rib 3 or 4, and the positive lead was sutured on the left rectus fascia between the xyphoid process and rib cage. Electrical signal recordings were made on the fourth day postoperatively, and dynamic electrocardiography was recorded for 24 hours. The ECG parameters were analyzed by IOX (v1.0) Base software (EMKA Technologies).
Evans Blue dye injection
Evans blue dye was used to evaluate the blood vessels and cellular membrane permeability63 using 24-week-old mice Dmd C3333Y mice and Dmd WT littermates. Quadriceps and heart tissues were collected and cryosectioned at 7 μm. The Evans blue dye permeation areas in the skeletal and cardiac muscles were evaluated and visualized with a Zeiss Axioskop2 plus Microscope (540/610nM).
Silicone rubber (Microfil Perfusion)
The Microfil injection compound (MV-120, Flow Tech) was perfused into the left atrium of each mouse, as previously described64. The heart was removed from the body rapidly after contraction stopped and put on ice for about 10 min to solidify the silicon rubber. The heart was fixed in 4% PFA 24 hr at 4°C, and cleared by alcohol-methyl salicylate clearing produces (sequential immersed in 25%, 50%, 75%, 95% and absolute ethyl alcohol for 24 hr). Micro vascular perfusion was visualized after the heart was placed in methyl salicylate for 24 hr on day 6 and examined under 10X magnification. The number of irregular blood vessels in Dmd C3333Y and Dmd WT mice was counted at the age of 6 months. The mean number of abnormal blood vessels was calculated individually and the average number for each group was then calculated.
Screen of small molecule inhibitors targeting TRIM63
The small molecular inhibitor screening was performed as previously described65 using Ub-DMD (Lys3584) antibody. A validated library of 2027 bioactive compounds (Selleckchem) was tested. The poly-Ub formation of DMD was detected by incubation with Ub-DMD (Lys3584) antibody. Background-subtracted average absorbance of each tested compounds were normalized to DMSO-treated samples and the Log2 fold change was plotted.
Immunoprecipitation and immunoblotting
Cells, skeletal or cardiac muscle tissues lysates were subjected to immunoprecipitation and immunoblotting detection as previously described16. Antibodies with dilution information are listed in Supplementary Table 10.
RNA isolation, qRT-PCR and RNA Fluorescence In Situ Hybridization
Total RNA was isolated from cells using RNeasy Mini Kit (QIAGEN). First-strand cDNA synthesis from total RNA was carried out using iScript Reverse Transcription Supermix for RT-qPCR (Bio-Rad). The primer sequences are listed in the Supplementary Table 9. LNA FISH probes were designed according to the LNA FISH probes designation guidelines of manufacture (Qiagen). Sequences are listed in Supplementary Table 9. The images were visualized with a Zeiss Axioskop2 plus Microscope, and the slides were scanned on the Automated Cellular Image System III (ACIS III) for quantification by digital image analysis.
Micro CT studies and Kyphotic index (KI) calculation
Spine morphology were imaged by an Explore Locus RS pre-clinical in vivo scanner (Micro CT, GE). The linear distance between the two lowest ventral surfaces of Cervical 7 and Lumbar 6 vertebral bodies was measured as length. The maximum perpendicular distance from the dorsal surface of the highest vertebra to the length line was measured as depth. KI was calculated as the ratio of length to depth of the thoracodorsal kyphosis.
Assessment of fertility
To test the fertility of Dmd C3333Y gene knock-in C57BL/6N mice, six-week-old heterozygous female mice were housed with hemizygous male mice, wild type C57BL/6N mice of the same age were set up as the control group; one male was housed with one female mouse, and 8 pairs in each group. The numbers of the pups were counted by litters 10 days after delivery. The mating was conducted 3 ovulation cycles for each pair. For post-natal studies, both observational and experimental studies were undertaken to define the phenotype. The mice tails were proteinase K-treated for genotyping, and weaned mouse genotype and gender numbers and ratios were compared to expected Mendelian ratios.
Transmission electron microscope (TEM)
Samples were fixed with a solution containing 3% glutaraldehyde plus 2% paraformaldehyde in 0.1 M cacodylate buffer, pH 7.3, then washed in 0.1 M sodium cacodylate buffer and treated with 0.1% Millipore-filtered cacodylate buffered tannic acid, post-fixed with 1% buffered osmium, and stained with 1% Millipore-filtered uranyl acetate. Ultrathin sections were cut in a Leica Ultracut microtome (Leica, Deerfield, IL), stained with uranyl acetate and lead citrate in a Leica EM Stainer, and examined in a JEM 1010 transmission electron microscope (JEOL, USA, Inc., Peabody, MA) at an accelerating voltage of 80 kV. Digital images were obtained using AMT Imaging System (Advanced Microscopy Techniques Corp, Danvers, MA).
Blood biochemistry
Serum was collected by tail bleeding or cardiac puncture after the mice fasted for 4–6 h, and creatine kinase (CK), creatinine, and blood urea nitrogen (BUN) values were determined by enzymatic assays using commercial kits (BioAssay Systems). Alkaline Phosphatase, alanine aminotransferase (ALT) and aspartate aminotransferase (AST), total bilirubin, and total protein levels were measured with the help of Clinical Pathology Workup at MD Anderson Cancer Center.
Plasmid construction, siRNAs, transfection, and lentiviral transduction
H19 DNA sequences were synthesized by GenScript and cloned into pGEM-3Z vector (Promega) for in vitro transcription and into the pcDNA3.1 (+) vector (Life technologies) or pMS2 vector for mammalian expression. The full-length human or mouse DMD and human DMD zinc finger domain sequence was obtained from MDACC shRNA and ORFeome Core and Addgene. Gateway™ pET-DEST42 vector (Invitrogen) was used for prokaryotic expression of human DMD c-termini. Mammalian full-length DMD, zinc finger domain of DMD, or H19 wild type and mutant vectors were constructed by subcloning the corresponding gene sequences into the SFB-tagged expression vector (provided by J. Chen, MD Anderson Cancer Center, USA) using the Gateway system (Life Technologies). All single-point and deletion mutations were generated using the QuikChange Lightning Site-Directed Mutagenesis Kit (Agilent Technologies). Scramble siRNA and siRNA targeting TRIM63 were obtained from Santa Cruz Biotechnology. Plasmid transfections were performed using Lipofectamine3000 (Life Technologies), or electroporation using the 4D-Nucleofector™ System (Lonza) according to manufacturer’s instructions. Recombinant DMD wild type and mutants were expressed in the E.coli strain BL21-CodonPlus (DE3)-RIPL (Agilent Technologies) and purified using a HisPur Cobalt Resin Kit (Thermo Scientific).
Statistics and reproducibility
The experiment was set up to use 3–8 samples/repeats per experiment/group/condition to detect a 2-fold difference with power of 80% and at the significance level of 0.05 by a one-sided or two-sided test for significant studies. Immunofluorescence staining experiments was independently repeated for 3–5 times or using 5–8 animals per experimental group. RNA Fluorescence in situ hybridization (FISH) coupled with immunofluorescence staining were performed 3 times independently. Immunoblotting detections were independently repeated 2 times. CLIP assays and EMSA assays were independently repeated 2 times. Transmission electron microscope data represents independent replicates using 5 animals per group. Histological staining data represents independent replicates using 5–8 animals per group. DNA agarose gel data represents 2 independent experiments. Results were reported as mean ± standard error of the mean (S.E.M.) or standard deviation (SD) of at least three independent experiments, as indicated by figure legends. Each exact n value was indicated in the corresponding figure legend. Statistical analysis was performed using GraphPad Prism 8 software using post hoc Tukey testing. Comparisons were analyzed by unpaired Student’s t-test, one-way ANOVA, or two-way ANOVA test as indicated in the corresponding figure legends. No significance [n.s.], p > 0.05, *, p < 0.05, **, p < 0.01, ***, p < 0.001, and ****, p < 0.0001, as indicated in individual figures. For survival analysis, Kaplan-Meier survival curves were compared using the log rank test.
Extended Data
Extended Data Fig. 1. H19 interacts with dystrophin.
a, CLIP assays using mouse skeletal muscle tissues, followed by autoradiography. Protein-bound RNA (blue box) were extracted for Sanger sequencing. b, RIP assay using mouse skeletal muscle tissue. Mean values±SD, n=3 independent experiments, two-way ANOVA. c, Representative images of immune RNA Fluorescence In Situ Hybridization in mouse skeletal and cardiac muscle tissues. Data represents three independent experiments. Scale bars, 50 μm. d, Streptavidin pull-down assay using indicated recombinant protein and biotinylated-H19, followed by immunoblotting (IB). Streptavidin (Strep.)-HRP indicated the presence of biotinylated-H19 transcripts. e, Detection of H19 depletion in C2C12 cells. f, RT-qPCR detection of indicated genes in C2C12 H19-proficient or -KO cell line. Mean values±SD, n=4 independent experiments, one-way ANOVA. g and h, RT-qPCR detection (g) or IB detection (h) in Dmd-proficient or -KO C2C12 cell lines. Mean values±SD (g), n=4 independent experiments, one-way ANOVA. i, H19 Copy number determination in iPS-derived cardiomyocytes (iPS-CMs) using qPCR. Mean values±SD, n=5 independent experiments, one-way ANOVA. j, Representative image of immunofluorescence staining (IF) of iPS-SkMCs and cardiomyocytes (iPS-CMs) derived from healthy donor (GM09503), upon H19 depletion. Scale bars, 50 μm. k and l, IB detection of indicated proteins (k) or RIP assay (l) in H19-proficient or deficient iPS-SkMCs expressing indicated expression vectors. Mean values±SD (l), n=3 independent experiments, two-way ANOVA. m, H19 RNA copy number determination in H19-proficient or deficient iPS-CMs expressing indicated expression vectors. Mean values±SD, n=6 independent experiments, one-way ANOVA. n, Annotated MS/MS spectrum assigned to the dystrophin peptide with ubiquitin modification at Lys 3577. No significance [n.s.], p > 0.05, *, p < 0.05, **, p < 0.01, ***, p < 0.001. Autoradiography and immunoblots are representative of two independent experiments. Statistical source data and unprocessed immunoblots are provided as Source Data Extended Data Fig. 1.
Extended Data Fig. 2. H19 antagonizes poly-ubiquitination and protein degradation of DMD.
a, Blocking Peptide Competition Assay using cell lysates extracted from H19-proficient, or -deficient iPS-SkMCs and blocking peptides of Scramble, TPSN, Ub-TPSN, DMD and Ub-DMD as shown, followed with IB detection using indicated antibodies. MG132 was used as proteasome inhibitor. b, Autoradiography of immunoprecipitated dystrophin in H19-proficient or -deficient iPS-CMs stably expressing MS2-tagged H19 WT or indicated mutants followed by L-[35S]-Methionine pulse-chase. Input was subjected to IB detection using indicated antibody. c, IB detection of indicated proteins in H19-proficient or deficient hiPS-SkMCs expressing MS2-tagged H19 WT or indicated mutants. d, IB detection of indicated proteins in H19-proficient or deficient C2C12 differentiated myotubes with or without MG-132. e, IB detection of DMD in Dmd-proficient or deficient C2C12 differentiated myotubes expressing DMD WT or the indicated mutants with PS-341. f, RT-qPCR detection of H19 relative expression level in Dmd-proficient or -deficient C2C12-differentiated myotubes expressing DMD WT or indicated mutants. Mean values±SD, n=5 independent experiments, one-way ANOVA. g, and h, RT-qPCR detection of Dmd (g) and H19 (h) relative expression level in Dmd-proficient or –deficient C2C12 expressing DMD or H19 WT or indicated mutants. Mean values±SD, n=4 independent experiments, two-way ANOVA. i, IB detection using indicated antibodies of Ni-NTA pulldown using recombinant proteins as indicated. No significance [n.s.], p > 0.05, *, p < 0.05, **, p < 0.01, ***, p < 0.001, and ****, p < 0.0001. Immunoblots are representative of two independent experiments. Statistical source data and unprocessed immunoblots are provided as Source Data Extended Data Fig. 2.
Extended Data Fig. 3. H19 competes with TRIM63 in interacting with dystrophin.
a, Immunoprecipitation followed with IB detection using indicated antibodies of hiPS-SkMCs derived from healthy donor (GM09503) expressing DMD WT or indicated mutations. b, RIP assay and RT-QPCR detection of indicated genes of hiPS-SkMC cells derived from healthy donor (GM09503) expressing DMD WT or indicated mutations. Mean values±SD, n=3 independent experiments, two-way ANOVA. c, IB detection using indicated antibodies of indicated recombinant proteins in the presence of biotinylated H19 RNA transcript. The LINK-A RNA transcript were included as negative control. d, Schematic illustration of predict secondary structure of Scr (scramble RNA) mimic, H19 RNA mimic and H19 mimic carrying mutation (H19 mut). e, IB detection using indicated antibodies of indicated recombinant proteins in the presence of biotinylated scramble (Scr), or H19 RNA mimics. f and g, Representative images of genotyping (f) and Sanger sequencing analysis (g) of Dmd in Dmd WT, Dmd C3333Y and mdx mice. h and i, Body weight measurement of female (h) or male (i) Dmd WT, Dmd WT/C3333Y and Dmd C3333Y/C3333Y mice. Mean values±SD, n=5 mice in each group, two-way ANOVA. j, H&E staining representative images of the lung, liver, kidney and spleen tissues in Dmd WT and Dmd C3333Y mice. Scale bars, 100 μm. Data represent independent replicates using 8 animals per group. k, Creatine kinase (CK) concentration in female Dmd WT, Dmd WT/C3333Y and Dmd C3333Y/C3333Y mice serum was tested of 4, 12 and 24-week-old, respectively. Mean values±SD, n=5 mice in each group, two-way ANOVA. No significance [n.s.], p > 0.05, *, p < 0.05, **, p < 0.01, ***, p < 0.001, and ****, p < 0.0001. Immunoblots are representative of two independent experiments. Statistical source data and unprocessed immunoblots are provided as Source Data Extended Data Fig. 3.
Extended Data Fig. 4. Dmd C3333Y mouse models muscular dystrophy.
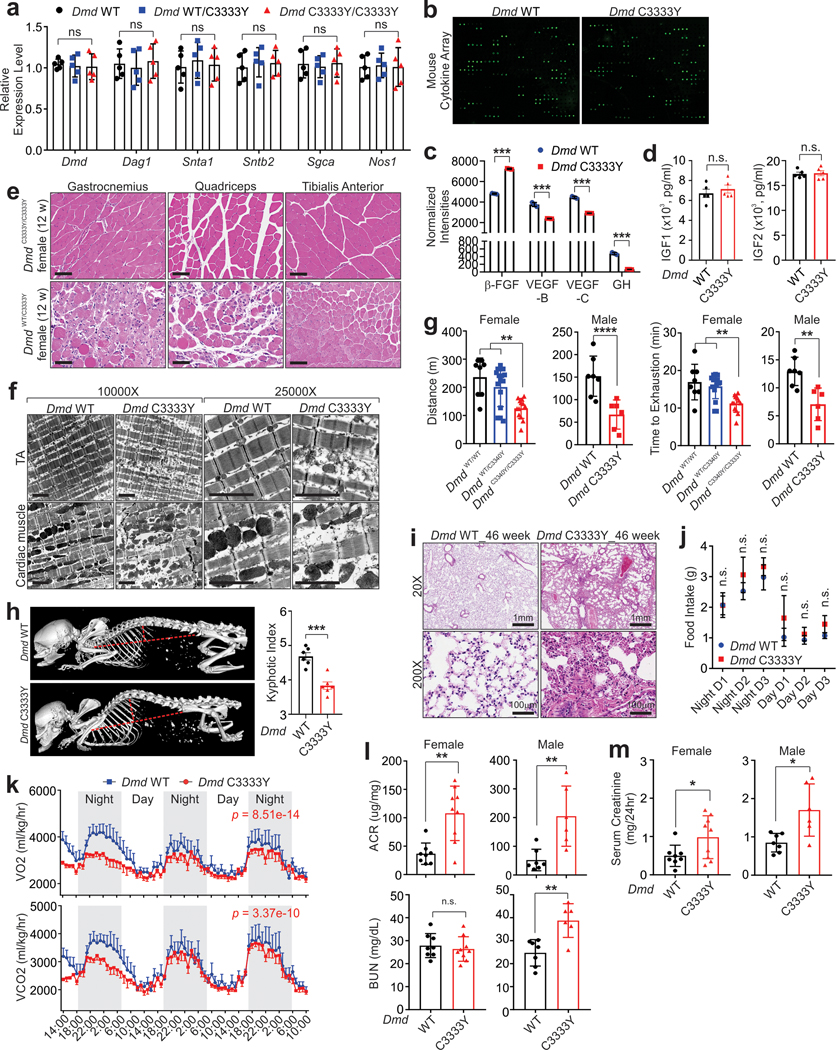
a, RT-qPCR detection of indicated genes in indicated female mice. Mean values±SD, n=5 mice per group, two-way ANOVA. b, Mouse cytokine array assay using the serum of indicated mice. Data represent independent replicates using 3 animals per group c and d, Serum concentration of indicated cytokines in indicated mice. Mean values±SEM, n=3 (c) or 5 (d) mice per group, unpaired student’s t-test. e, H&E staining representative images of Gastrocnemius, Quadriceps, or Tibialis Anterior in indicated female mice at age of 12 weeks. Scale bars, 100 μm. Data represent independent replicates using 8 animals per group. f, Transmission electron microscope representative images of tibialis anterior (TA) and cardiac muscles. Scale bars, 500 nm. Data represent independent replicates using 5 animals per group. g, Running distance and exhaustion time of indicated mice. Mean values±SD, Female: n=8, 15, 13; Male: n=7, 6, one-way ANOVA. h, Representative images of micro CT of mouse spine (left) and kyphotic index (right) of male indicated mice. Mean values±SEM, n=6 per group unpaired student’s t-test. i, H&E staining representative images of 46-week-old indicated lung. Scale bars, 1mm or 100 μm. Data represent independent replicates using 8 animals per group. j, Food intake of male indicated mice. Mean values±SD, n=4 animals in each group, unpaired student’s t-test. k, VO2 (top) and VCO2 (bottom) consumption of male indicated mice. Mean values±SEM, n=6 animals in each group, two-way ANOVA. l and m, Urinary albumin to creatinine ratio (ACR), blood urea nitrogen (BUN) and serum creatinine measurement of female (left) and male (right) indicated mice. Mean values±SD, Female: n=8, 9; Male: n=8, 6 for WT and C3333Y, respectively, unpaired student’s t-test. No significance [n.s.], p > 0.05, *, p < 0.05, **, p < 0.01, ***, p < 0.001, and ****, p < 0.0001. Statistical source data are provided as Source Data Extended Data Fig. 4.
Extended Data Fig. 5. Dmd C3333Y mutation facilitates poly-ubiquitination and protein degradation of DMD.
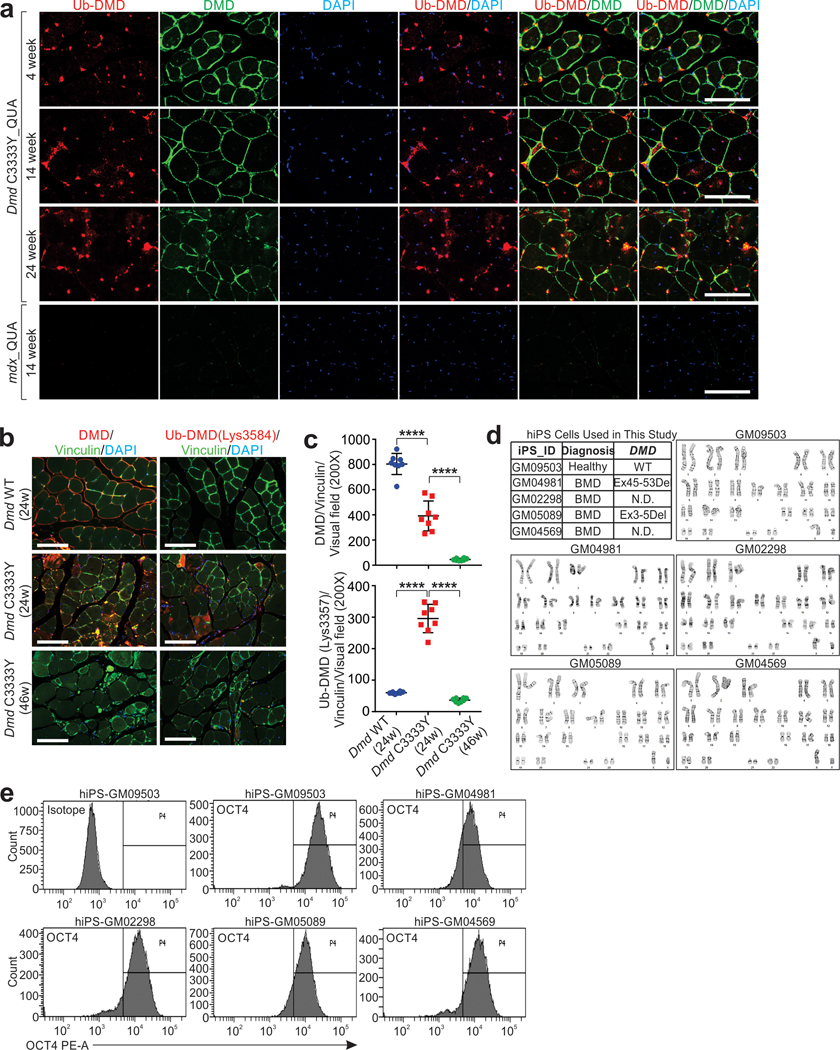
a, IF staining representative images using indicated antibodies in QUA (quadriceps) of Dmd C3333Y and mdx mice at indicated age. Scale bars, 100 μm. Data represent independent replicates using 5 animals per group. b, c, IF staining representative images (b) and staining intensity statistics (c) in QUA using DMD and Ub-DMD (Lys3584) antibodies of Dmd WT or Dmd C3333Y mice at indicated age. Scale bars (left), 100 μm. Mean values±SD (right), n=8 mice in each group, two-way ANOVA. d, Colonies karyotyping representative images of hiPS cells derived from human fibroblast cells of indicated donors. Healthy donor: GM09503; BMD patients: GM04981, GM02298, GM05089, GM04569. Data represent independent replicates using 3 clones per cell line. e, Flow cytometer verification of human fibroblast cells derived hiPS cells by using OCT4 antibody. Data represent independent replicates using 3 clones per cell line. ****, p < 0.0001. Statistical source data are provided as Source Data Extended Data Fig. 5.
Extended Data Fig. 6. H19 RNA mimics and Nifenazone promote the protein stability of dystrophin.
a, IP and IB detection using indicated antibodies in healthy or BMD iPS-SkMCs. b, IP and IB detection using indicated antibodies in healthy or BMD iPS-SkMCs treated with H19 mimics, wild type or mut. c, Log of TRIM63 expression profile in different human tissues. d, Heat map of sandwich ELISA using His6-TUBE and Ub-DMD (Lys3584) antibody for screening customized compound library and the generation of the Ub-DMD was detected by OD450. Log2 of relative fold change of polyUb chain formation activity was shown. e, Competition curve determination of IC50 value of NIF on the enzymatic activity of indicated E3 ligases. The IC50 values of NIF against each E3 ligase are shown. Mean values±SD; n=3 independent experiments. f, Left: IB detection using indicated antibodies of hiPS-SkMCs upon vehicle (Veh.) or NIF treatment. Right: list of E3 ligase and known cellular substrates as shown. g, Autoradiography of immunoprecipitated dystrophin in iPS-CMs derived from healthy donor or BMD patient stably expressing MS2-tagged H19 or treated with vehicle or Nifenazon (10μM) followed by L-[35S]-Methionine pulse-chase. Input was subjected to IB detection using indicated antibody. Immunoblots are representative of two independent experiments. Statistical source data and unprocessed immunoblots are provided as Source Data Extended Data Fig. 6.
Extended Data Fig. 7. H19 and Nifenazone extend the half-life of DMD protein.
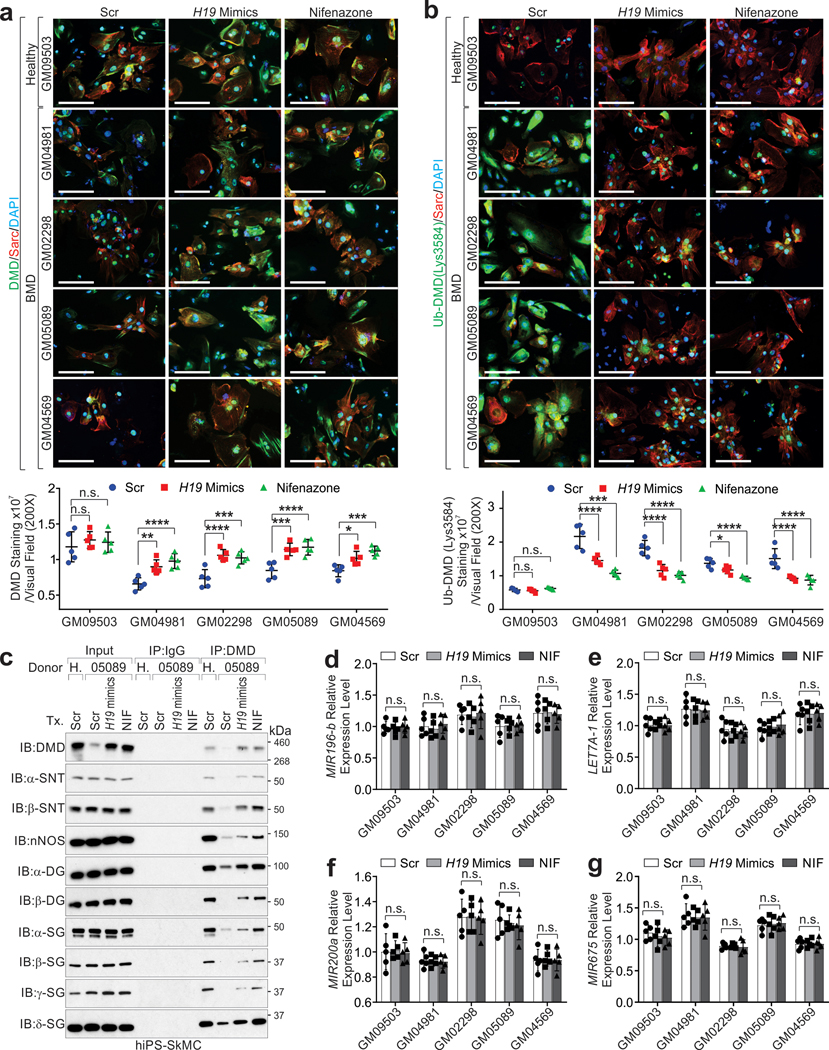
a, Representative images of IF staining using indicated antibody (top) and statistical analysis of DMD staining intensities (bottom) of hiPS-CMs derived from healthy donor or BMD patients, upon transfection of Scramble (Scr) mimic, H19 mimic or treatment Nifenazone (10 μM). Scale bars, 50 μm. Mean values±SD, n=5 independent experiments, two-way ANOVA. b, Representative images of IF staining using indicated antibody (top) and statistical analysis of Ub-DMD (Lys3584) staining intensities (bottom) of hiPS-CMs derived from healthy donor or BMD patients, upon transfection of Scramble (Scr) mimic, H19 mimic or treatment Nifenazone (10 μM). Scale bars, 50μm. Mean values±SD, n=5 independent experiments, two-way ANOVA. c, IP using DMD antibody followed by IB detection using indicated antibodies in hiPS-SkMCs from healthy donor or BMD patients with the indicated treatments. d-g, RT-QCPR detection of indicated genes of hiPS-SkMCs derived from healthy donor or BMD patients, upon transfection of Scramble (Scr) mimic, H19 mimic or treatment Nifenazone (10 μM). Mean values±SD, n=5 independent experiments, two-way ANOVA. No significance [n.s.], p > 0.05, *, p < 0.05, **, p < 0.01, ***, p < 0.001, ****, p < 0.0001. Immunoblots are representative of two independent experiments. Statistical source data and unprocessed immunoblots are provided as Source Data Extended Data Fig. 7.
Extended Data Fig. 8. DMD K3584R resists TRIM63-dependent polyUb and protein degradation.
a, Graphic illustration of the strategies used to generate knockin cell lines derived from hiPS cells. b, EGFP expression of hiPS cells upon electroporation. Scale bars, 50 μm. Data represent 3 independent experiments. c, DNA agarose gel detection of single-cell colonies derived from 04981 or 25313 using indicated genotyping primers. Green forward: Puro-GT-R(LJL); Green reverse: PM20003-A-R-GT-R; Red forward: PM20003-A-L-GT-F; Red reverse: Puro-F. d, DNA agarose gel detection of single-cell colonies derived from 04981 or 25313 respectively, following removal of resistance cassettes, using indicated genotyping primers. Blue forward: PM20003-A-L-GT-F; Blue reverse: PM20003-A-L-GT-R3. *: mixed colonies containing cells with resistance cassettes not removed. Yellow boxes: single cell colonies used for following studies. e, Sanger sequencing validation of DMD K3584R mutant. Data represent 3 independent experiments. f, IB detection using indicated antibodies of GM04981 parental (Par) or K3584R mutant cells in the presence of indicated treatment. MG132 was used as proteasome inhibitor. g-i, Concentration measurement of H19 mimic or AGR-H19 per milligram of tissue at indicated time points post i.p. administration of H19 mimics (g), SubQ administration of H19 mimics (h), or SubQ administration of AGR-H19 (i) (10 mg/kg, single dose). Mean values±SD, n=5 animals per time point per experimental condition. j, Left, representative images of α-bungarotoxin staining (top) or Duolink PLA (proximity ligation assay) using antibodies targeting LPR4 and Biotin respectively (bottom) of hiPS-SkMCs with indicated treatment. rAgrin, recombinant Agrin (Z+ form, aa. 1260–2045). Scale bars, 50 μm. Right: Percentage of cells with AchR clustering (blue bars) or Duolink PLA (red bars) of hiPS-SkMCs with indicated treatment. Mean values±SD, n=6 independent experiments, two-way ANOVA, ***, p < 0.001. DNA agarose gel and immunoblots are representative of two independent experiments. Statistical source data and unprocessed immunoblots are provided as Source Data Extended Data Fig. 8.
Extended Data Fig. 9. AGR-H19 and Nifenazone restore skeletal muscle and heart function.
a, Immunohistological detection of Biotin-labeled mimics in quadriceps, heart, kidney, liver and lung tissues in the presence of indicated mimics. Scale bars, 100 μm. Data represent independent replicates using 5 animals per group. b, Body weight measurement of male Dmd WT treated with scramble (Scr) or Dmd C3333Y mice with indicated treatments. Mean values±SD, n=5 mice per group, two-way ANOVA. c and d, Serum IGF1 (c) and IGF2 (d) level concentration of Dmd WT or Dmd C3333Y mice with the indicated treatments. Mean values±SD, n=5 mice per group, one-way ANOVA. e, RT-qPCR detection of Dmd in Dmd WT or Dmd C3333Y QUA (quadriceps) with indicated treatments. Mean values±SD, n=6 mice in each group, one-way ANOVA. f-i, RT-qPCR detection of indicated genes in Dmd C3333Y QUA with indicated treatments. Mean values±SD, n=5 (f, g, h) or 6 (i) mice in each group, one-way ANOVA. j, Serum CK concentration in Dmd WT treated with AGR-Scr or Dmd C3333Y mice with indicated treatments. Mean values±SD, n=5 mice per group, one-way ANOVA. k, Percentage of central nucleic of indicated muscle fiber of Dmd WT treated with AGR-Scr or Dmd C3333Y mice with indicated treatments. Mean values±SD, n=5 mice per group, two-way ANOVA. l, Body weight measurement of male Dmd WT mice treated with vehicle or Dmd C3333Y mice with indicated treatments from 4 weeks old to age of 16 weeks. Mean values±SD, n=5 mice per group, two-way ANOVA. m, Serum CK concentration in Dmd WT mice treated with vehicle or Dmd C3333Y mice with indicated treatments. Mean values±SD, n=5 mice per group, one-way ANOVA. No significance [n.s.], p > 0.05, *, p < 0.05, **, p < 0.01, ***, p < 0.001, and ****, p < 0.0001. Statistical source data are provided as Source Data Extended Data Fig. 9.
Extended Data Fig. 10. AGR-H19 and Nifenazone improve the protein stability of dystrophin following exon-skipping.
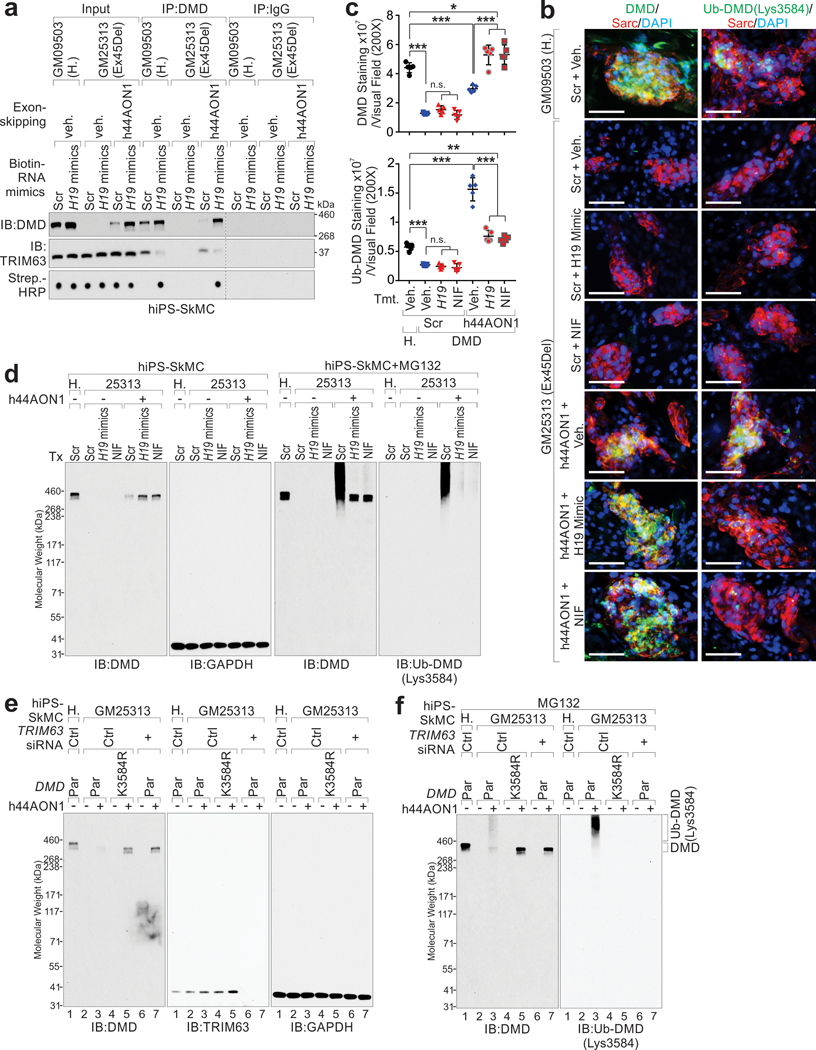
a, IP and IB detection using indicated antibodies of hiPS-SkMCs derived from healthy or DMD donor in the presence of biotinylated Scr or H19 mimics. b, Representative images of IF staining of hiPS-CMs derived from healthy donor treated with scramble and vehicle, or DMD patient (GM25313) treated with h44AON1 alone or in combination with H19 mimics or Nifenazone respectively. Scale bars, 100 μm. c, Statistical analysis of DMD (top) or Ub-DMD (Lys3584) (bottom) of hiPS-CMs derived from healthy donor (GM09503) treated with scramble and vehicle, or DMD patient (GM25313) treated with h44AON1 alone or in combination with H19 mimics or Nifenazone respectively. Mean values±SD. n=5 independent experiments in each group, one-way ANOVA. d, IB detection using indicated antibodies of hiPS-SkMCs derived from healthy donor (H. 09503) or DMD patient (25313) in the presence of h44AON1 and/or indicated treatment. e, IB detection using indicated antibodies of GM25313 parental (Par) or K3584R mutant cells in the presence of control (Ctrl.) or TRIM63 siRNA. hiPS-SkMCs derived from healthy donor (H., GM09503) were included as control. f, IB detection using indicated antibodies of GM25313 parental (Par) or K3584R mutant cells in the presence of control (Ctrl.) or TRIM63 siRNA. hiPS-SkMCs derived from healthy donor (H., GM09503) were included as control. MG132 was used as proteasome inhibitor. No significance [n.s.], p > 0.05, *, p < 0.05, **, p < 0.01, ***, p < 0.001. Immunoblots are representative of two independent experiments. Statistical source data and unprocessed immunoblots are provided as Source Data Extended Data Fig. 10.
Supplementary Material
Acknowledgements
We would like to thank the Baylor College of Medicine Human Stem Cell Core (HSCC) for technical help and consultation for iPS cell line derivation, maintenance, and differentiation. The HSCC is supported in part by Shared Resource funding from the NIH (CA125123, PI: Osborne). Generation of knockin mice as supported by CCSG grant: NCI # CA016672 (GEMF) of MD Anderson Cancer Center. The Proteomics and Metabolomics Facility was supported in part by Cancer Prevention Research Institute of Texas (CPRIT) grant number RP130397 and NIH grant numbers 1S10OD012304-01 and P30CA016672. This work was partially supported by the Texas A&M University Chancellor’s Research Initiative. This work was partially supported by the National Institute of Arthritis and Musculoskeletal and Skin Diseases (NIAMS) of the NIH under award numbers 1R01AR068293 and 1R21AR071583 to R.D. This work was partially supported by the Cancer Prevention and Research Institute of Texas (RR150085) to CPRIT Scholar in Cancer Research (L.H.). This work was supported by the NIH R01 award (1 R01 CA218025-01, 1R01CA231011-01), CPRIT individual investigator research award (180259), and DoD Breakthrough award BC180196 to C.R.L., and NIH R01 award (1 R01 CA218036-01), and DoD Breakthrough award (BC151465, BC181384) grant, CPRIT individual investigator research award (200423) and Andrew Sabin Family Foundation Fellows award to L.Q.Y.
Footnotes
Data availability
Mass spectrometry data to identify DMD binding proteins and post-translational modifications have been deposited in ProteomeXchange with the primary accession code PXD020566 [ftp://ftp.pride.ebi.ac.uk/pride/data/archive/2020/08/PXD020566]. Source data are provided with this paper. All other data supporting the findings of this study are available from the corresponding authors on reasonable request.
Competing interests
The authors declare no competing interests.
Reference for main text:
- 1.Dalkilic I & Kunkel LM Muscular dystrophies: genes to pathogenesis. Curr Opin Genet Dev 13, 231–238 (2003). [DOI] [PubMed] [Google Scholar]
- 2.Nowak KJ & Davies KE Duchenne muscular dystrophy and dystrophin: pathogenesis and opportunities for treatment. EMBO reports 5, 872–876 (2004). [DOI] [PMC free article] [PubMed] [Google Scholar]
- 3.Blake DJ, Weir A, Newey SE & Davies KE Function and genetics of dystrophin and dystrophin-related proteins in muscle. Physiol Rev 82, 291–329 (2002). [DOI] [PubMed] [Google Scholar]
- 4.Brooke MH, et al. Duchenne muscular dystrophy: patterns of clinical progression and effects of supportive therapy. Neurology 39, 475–481 (1989). [DOI] [PubMed] [Google Scholar]
- 5.McDonald CM, et al. Profiles of neuromuscular diseases. Duchenne muscular dystrophy. Am J Phys Med Rehabil 74, S70–92 (1995). [DOI] [PubMed] [Google Scholar]
- 6.Walcher T, et al. Cardiac involvement in a female carrier of Duchenne muscular dystrophy. Int J Cardiol 138, 302–305 (2010). [DOI] [PubMed] [Google Scholar]
- 7.Ceulemans BP, Storm K, Reyniers E Jr., Callewaert L & Martin JJ Muscle pain as the only presenting symptom in a girl with dystrophinopathy. Pediatr Neurol 38, 64–66 (2008). [DOI] [PubMed] [Google Scholar]
- 8.Hoffman EP, Arahata K, Minetti C, Bonilla E & Rowland LP Dystrophinopathy in isolated cases of myopathy in females. Neurology 42, 967–975 (1992). [DOI] [PubMed] [Google Scholar]
- 9.Song TJ, Lee KA, Kang SW, Cho H & Choi YC Three cases of manifesting female carriers in patients with Duchenne muscular dystrophy. Yonsei Med J 52, 192–195 (2011). [DOI] [PMC free article] [PubMed] [Google Scholar]
- 10.Echigoya Y, Lim KRQ, Nakamura A & Yokota T. Multiple Exon Skipping in the Duchenne Muscular Dystrophy Hot Spots: Prospects and Challenges. J Pers Med 8(2018). [DOI] [PMC free article] [PubMed] [Google Scholar]
- 11.Torella A, et al. One hundred twenty-one dystrophin point mutations detected from stored DNA samples by combinatorial denaturing high-performance liquid chromatography. J Mol Diagn 12, 65–73 (2010). [DOI] [PMC free article] [PubMed] [Google Scholar]
- 12.Ehmsen J, Poon E & Davies K. The dystrophin-associated protein complex. Journal of cell science 115, 2801–2803 (2002). [DOI] [PubMed] [Google Scholar]
- 13.Lin C & Yang L. Long Noncoding RNA in Cancer: Wiring Signaling Circuitry. Trends Cell Biol 28, 287–301 (2018). [DOI] [PMC free article] [PubMed] [Google Scholar]
- 14.Brown RS Zinc finger proteins: getting a grip on RNA. Curr Opin Struct Biol 15, 94–98 (2005). [DOI] [PubMed] [Google Scholar]
- 15.Dormoy-Raclet V, et al. The RNA-binding protein HuR promotes cell migration and cell invasion by stabilizing the beta-actin mRNA in a U-rich-element-dependent manner. Mol Cell Biol 27, 5365–5380 (2007). [DOI] [PMC free article] [PubMed] [Google Scholar]
- 16.Hu Q, et al. Oncogenic lncRNA downregulates cancer cell antigen presentation and intrinsic tumor suppression. Nat Immunol 20, 835–851 (2019). [DOI] [PMC free article] [PubMed] [Google Scholar]
- 17.Lenk U, et al. Non-isotopic analysis of single strand conformation polymorphism (SSCP) in the exon 13 region of the human dystrophin gene. J Med Genet 30, 951–954 (1993). [DOI] [PMC free article] [PubMed] [Google Scholar]
- 18.Feng J, Yan J, Buzin CH, Towbin JA & Sommer SS Mutations in the dystrophin gene are associated with sporadic dilated cardiomyopathy. Mol Genet Metab 77, 119–126 (2002). [DOI] [PubMed] [Google Scholar]
- 19.Flanigan KM, et al. Rapid direct sequence analysis of the dystrophin gene. Am J Hum Genet 72, 931–939 (2003). [DOI] [PMC free article] [PubMed] [Google Scholar]
- 20.Goldberg LR, et al. A dystrophin missense mutation showing persistence of dystrophin and dystrophin-associated proteins yet a severe phenotype. Ann Neurol 44, 971–976 (1998). [DOI] [PubMed] [Google Scholar]
- 21.Lenk U, et al. A cysteine 3340 substitution in the dystroglycan-binding domain of dystrophin associated with Duchenne muscular dystrophy, mental retardation and absence of the ERG b-wave. Hum Mol Genet 5, 973–975 (1996). [DOI] [PubMed] [Google Scholar]
- 22.Campbell KP & Kahl SD Association of dystrophin and an integral membrane glycoprotein. Nature 338, 259–262 (1989). [DOI] [PubMed] [Google Scholar]
- 23.Ishikawa-Sakurai M, Yoshida M, Imamura M, Davies KE & Ozawa E. ZZ domain is essentially required for the physiological binding of dystrophin and utrophin to beta-dystroglycan. Human molecular genetics 13, 693–702 (2004). [DOI] [PubMed] [Google Scholar]
- 24.Abdel-Salam E, Abdel-Meguid I & Korraa SS Markers of degeneration and regeneration in Duchenne muscular dystrophy. Acta Myol 28, 94–100 (2009). [PMC free article] [PubMed] [Google Scholar]
- 25.Ghafoor T, Mahmood A & Shams S. Duchenne muscular dystrophy with associated growth hormone deficiency. J Coll Physicians Surg Pak 13, 722–723 (2003). [PubMed] [Google Scholar]
- 26.McNally EM, et al. Contemporary cardiac issues in Duchenne muscular dystrophy. Working Group of the National Heart, Lung, and Blood Institute in collaboration with Parent Project Muscular Dystrophy. Circulation 131, 1590–1598 (2015). [DOI] [PMC free article] [PubMed] [Google Scholar]
- 27.Ho R, Nguyen ML & Mather P. Cardiomyopathy in becker muscular dystrophy: Overview . World J Cardiol 8, 356–361 (2016). [DOI] [PMC free article] [PubMed] [Google Scholar]
- 28.Fang S, Jensen JP, Ludwig RL, Vousden KH & Weissman AM Mdm2 is a RING finger-dependent ubiquitin protein ligase for itself and p53. The Journal of biological chemistry 275, 8945–8951 (2000). [DOI] [PubMed] [Google Scholar]
- 29.Liew CW, Sun H, Hunter T & Day CL RING domain dimerization is essential for RNF4 function. The Biochemical journal 431, 23–29 (2010). [DOI] [PMC free article] [PubMed] [Google Scholar]
- 30.Kuniyoshi K, et al. Pivotal role of RNA-binding E3 ubiquitin ligase MEX3C in RIG-I-mediated antiviral innate immunity. Proceedings of the National Academy of Sciences of the United States of America 111, 5646–5651 (2014). [DOI] [PMC free article] [PubMed] [Google Scholar]
- 31.Choi YE, et al. The E3 ubiquitin ligase cIAP1 binds and ubiquitinates caspase-3 and −7 via unique mechanisms at distinct steps in their processing. The Journal of biological chemistry 284, 12772–12782 (2009). [DOI] [PMC free article] [PubMed] [Google Scholar]
- 32.Morreale FE & Walden H. Types of Ubiquitin Ligases. Cell 165, 248–248 e241 (2016). [DOI] [PubMed] [Google Scholar]
- 33.Talis AL, Huibregtse JM & Howley PM The role of E6AP in the regulation of p53 protein levels in human papillomavirus (HPV)-positive and HPV-negative cells. The Journal of biological chemistry 273, 6439–6445 (1998). [DOI] [PubMed] [Google Scholar]
- 34.Percherancier Y, et al. Role of SUMO in RNF4-mediated promyelocytic leukemia protein (PML) degradation: sumoylation of PML and phospho-switch control of its SUMO binding domain dissected in living cells. The Journal of biological chemistry 284, 16595–16608 (2009). [DOI] [PMC free article] [PubMed] [Google Scholar]
- 35.Oda H, Kumar S & Howley PM Regulation of the Src family tyrosine kinase Blk through E6AP-mediated ubiquitination. Proceedings of the National Academy of Sciences of the United States of America 96, 9557–9562 (1999). [DOI] [PMC free article] [PubMed] [Google Scholar]
- 36.Wei W, Li M, Wang J, Nie F & Li L. The E3 ubiquitin ligase ITCH negatively regulates canonical Wnt signaling by targeting dishevelled protein. Molecular and cellular biology 32, 3903–3912 (2012). [DOI] [PMC free article] [PubMed] [Google Scholar]
- 37.Wang D, et al. Engineering a lysosomal enzyme with a derivative of receptor-binding domain of apoE enables delivery across the blood-brain barrier. Proceedings of the National Academy of Sciences of the United States of America 110, 2999–3004 (2013). [DOI] [PMC free article] [PubMed] [Google Scholar]
- 38.Zong Y, et al. Structural basis of agrin-LRP4-MuSK signaling. Genes & development 26, 247–258 (2012). [DOI] [PMC free article] [PubMed] [Google Scholar]
- 39.Barik A, et al. LRP4 is critical for neuromuscular junction maintenance. J Neurosci 34, 13892–13905 (2014). [DOI] [PMC free article] [PubMed] [Google Scholar]
- 40.Allerson CR, et al. Fully 2’-modified oligonucleotide duplexes with improved in vitro potency and stability compared to unmodified small interfering RNA. Journal of medicinal chemistry 48, 901–904 (2005). [DOI] [PubMed] [Google Scholar]
- 41.Aslesh T, Maruyama R & Yokota T. Skipping Multiple Exons to Treat DMD-Promises and Challenges. Biomedicines 6(2018). [DOI] [PMC free article] [PubMed] [Google Scholar]
- 42.Aartsma-Rus A & Krieg AM FDA Approves Eteplirsen for Duchenne Muscular Dystrophy: The Next Chapter in the Eteplirsen Saga. Nucleic Acid Ther 27, 1–3 (2017). [DOI] [PMC free article] [PubMed] [Google Scholar]
- 43.Jearawiriyapaisarn N, et al. Sustained dystrophin expression induced by peptide-conjugated morpholino oligomers in the muscles of mdx mice. Mol Ther 16, 1624–1629 (2008). [DOI] [PMC free article] [PubMed] [Google Scholar]
- 44.Wu B, et al. Effective rescue of dystrophin improves cardiac function in dystrophin-deficient mice by a modified morpholino oligomer. Proceedings of the National Academy of Sciences of the United States of America 105, 14814–14819 (2008). [DOI] [PMC free article] [PubMed] [Google Scholar]
- 45.Quinlan JG, et al. Evolution of the mdx mouse cardiomyopathy: physiological and morphological findings. Neuromuscul Disord 14, 491–496 (2004). [DOI] [PubMed] [Google Scholar]
- 46.Judge LM, Arnett AL, Banks GB & Chamberlain JS Expression of the dystrophin isoform Dp116 preserves functional muscle mass and extends lifespan without preventing dystrophy in severely dystrophic mice. Human molecular genetics 20, 4978–4990 (2011). [DOI] [PMC free article] [PubMed] [Google Scholar]
- 47.Vulin A, et al. The ZZ domain of dystrophin in DMD: making sense of missense mutations. Hum Mutat 35, 257–264 (2014). [DOI] [PMC free article] [PubMed] [Google Scholar]
- 48.Iuchi S. Three classes of C2H2 zinc finger proteins. Cellular and molecular life sciences : CMLS 58, 625–635 (2001). [DOI] [PMC free article] [PubMed] [Google Scholar]
- 49.Tuffery-Giraud S, et al. Genotype-phenotype analysis in 2,405 patients with a dystrophinopathy using the UMD-DMD database: a model of nationwide knowledgebase. Hum Mutat 30, 934–945 (2009). [DOI] [PubMed] [Google Scholar]
- 50.Gao QQ & McNally EM The Dystrophin Complex: Structure, Function, and Implications for Therapy. Compr Physiol 5, 1223–1239 (2015). [DOI] [PMC free article] [PubMed] [Google Scholar]
- 51.Aartsma-Rus A, et al. Development of Exon Skipping Therapies for Duchenne Muscular Dystrophy: A Critical Review and a Perspective on the Outstanding Issues. Nucleic Acid Ther 27, 251–259 (2017). [DOI] [PMC free article] [PubMed] [Google Scholar]
- 52.Berteaux N, et al. H19 mRNA-like noncoding RNA promotes breast cancer cell proliferation through positive control by E2F1. The Journal of biological chemistry 280, 29625–29636 (2005). [DOI] [PubMed] [Google Scholar]
- 53.Hart FD & Boardman PL Trial of Nifenazone (“Thylin”). Br Med J 1, 1553–1554 (1964). [DOI] [PMC free article] [PubMed] [Google Scholar]
Reference for Methods:
- 54.Wu J, et al. A Myogenic Double-Reporter Human Pluripotent Stem Cell Line Allows Prospective Isolation of Skeletal Muscle Progenitors. Cell Rep 25, 1966–1981 e1964 (2018). [DOI] [PMC free article] [PubMed] [Google Scholar]
- 55.Chakraborty S, Christoforou N, Fattahi A, Herzog RW & Leong KW A robust strategy for negative selection of Cre-loxP recombination-based excision of transgenes in induced pluripotent stem cells. PLoS One 8, e64342 (2013). [DOI] [PMC free article] [PubMed] [Google Scholar]
- 56.Geng L, Zhang HL & Peng HB The formation of acetylcholine receptor clusters visualized with quantum dots. BMC Neurosci 10, 80 (2009). [DOI] [PMC free article] [PubMed] [Google Scholar]
- 57.Yang L, et al. ncRNA- and Pc2 methylation-dependent gene relocation between nuclear structures mediates gene activation programs. Cell 147, 773–788 (2011). [DOI] [PMC free article] [PubMed] [Google Scholar]
- 58.Lin A, et al. The LINK-A lncRNA interacts with PtdIns(3,4,5)P3 to hyperactivate AKT and confer resistance to AKT inhibitors. Nature cell biology 19, 238–251 (2017). [DOI] [PMC free article] [PubMed] [Google Scholar]
- 59.Yoon JH, Srikantan S & Gorospe M. MS2-TRAP (MS2-tagged RNA affinity purification): tagging RNA to identify associated miRNAs. Methods 58, 81–87 (2012). [DOI] [PMC free article] [PubMed] [Google Scholar]
- 60.Aartsma-Rus A & van Putten M. Assessing functional performance in the mdx mouse model. J Vis Exp (2014). [DOI] [PMC free article] [PubMed] [Google Scholar]
- 61.Hoffman E & Winder SJ A Modified Wire Hanging Apparatus for Small Animal Muscle Function Testing. PLoS Curr 8(2016). [DOI] [PMC free article] [PubMed] [Google Scholar]
- 62.Conner JD, Wolden-Hanson T & Quinn LS Assessment of murine exercise endurance without the use of a shock grid: an alternative to forced exercise . J Vis Exp, e51846 (2014). [DOI] [PMC free article] [PubMed] [Google Scholar]
- 63.Hamer PW, McGeachie JM, Davies MJ & Grounds MD Evans Blue Dye as an in vivo marker of myofibre damage: optimising parameters for detecting initial myofibre membrane permeability. J Anat 200, 69–79 (2002). [DOI] [PMC free article] [PubMed] [Google Scholar]
- 64.Weyers JJ, Carlson DD, Murry CE, Schwartz SM & Mahoney WM Jr. Retrograde perfusion and filling of mouse coronary vasculature as preparation for micro computed tomography imaging. J Vis Exp, e3740 (2012). [DOI] [PMC free article] [PubMed] [Google Scholar]
- 65.Li C, et al. A ROR1-HER3-lncRNA signalling axis modulates the Hippo-YAP pathway to regulate bone metastasis. Nat Cell Biol 19, 106–119 (2017). [DOI] [PMC free article] [PubMed] [Google Scholar]
Associated Data
This section collects any data citations, data availability statements, or supplementary materials included in this article.


