

ABSTRACT
Stretch is applied to skin under normal physiological conditions, for example pregnancy, or artificially using soft tissue expanders. Because cells are known to orient in response to the application of mechanical forces, the current studies were carried out to assess the effects of stretch on dermal fibroblast orientation and cell signalling. Dermal fibroblasts were seeded onto collagen‐coated flexible membranes and grown to 70–80% confluence. Membranes were then deformed at 10 cycles per minute by the application of 135 mmHg subatmospheric pressure. This corresponded to strain levels of 0–24% from the centre to extremity of the flexible membrane. We show that a minimum of 15% cell stretch is required to significantly stimulate the fibroblast orientation response. focal adhesion kinase (FAK), p38 and Rho were activated in fibroblasts exposed to cyclic stretch and incubation of cells with anti‐integrin β1 before the application of stretch abrogated fibroblast orientation, as well as FAK, p38 and Rho activation. Fibroblast orientation in response to cyclic stretch is mediated at least in part by integrin β1 through phosphorylation of FAK, p38 and activation of Rho.
Keywords: Stretch, Fibroblast, p38, Rho, FAK
INTRODUCTION
Mechanotransduction is the perception of cellular signalling occurring in response to mechanical force. In vivo, cells may experience mechanical forces because of the pulsatile nature of blood flow or during the wound contraction process 1, 2. Mechanical forces may also be applied externally to tissues during distraction osteogenesis in hard tissues, during tissue expansion due to implantation of soft tissue expanders (3) or during wound healing using (4) negative pressure wound therapy. Fibroblasts play an essential role in granulation tissue formation during the proliferative phase of wound healing. During this phase, fibroblasts must migrate into the wound bed, proliferate, synthesise growth factors, produce new extracellular matrix (ECM) and express key proteins essential to wound healing such as actin 5, 6.
In two‐dimensional cell culture, application of mechanical force [in the form of cyclic strain regimes of 6–120 cycles per minute (cpm)] has been shown to influence many aspects of fibroblast cell physiology including migration, proliferation, protein synthesis and gene expression 7, 8, 9, 10, 11, 12. Cells of the connective tissue including fibroblasts are known to orient in response to cyclic strain 13, 14, 15.
For cell orientation and migration to occur, lamellepodia protrusions must form at the cell's leading edge, and adhere to the ECM. The cell body is advanced by pulling against the leading edge adhesions, while the rear adhesions weaken (16). Focal adhesions are critical to this process, as they couple the ECM to the actin cytoskeleton. It is the contraction of the actin cytoskeleton that leads to cell movement. Central to the formation and maintenance of focal adhesions are the Rho family of small GTPases (17). In addition to their importance in focal adhesion formation, various Rho family members have been shown to activate other targets such as the p38 mitogen‐activated protein (MAP) kinase family (18).
Focal adhesions are protein complexes which link actin to integrin receptors. The attachment of actin to integrins through focal adhesions is althought to be crucial to traction and lamellepodia protrusion as well as the ability of cells to respond to mechanical strain 19, 20. Integrin activation is known to promote Focal adhesion kinase (FAK) phosphorylation 21, 22. FAK is a key mediator of focal adhesion signalling, and may be involved with integrin‐mediated proliferative signalling (23). Signal transduction through focal adhesions has been linked to cell locomotion (24).
The objective of the following study was to assess the effects of cyclic stretch (CS) on fibroblast orientation and to better understand the integrin‐stimulated signalling cascade leading to this orientation.
METHODS
Culture of human foreskin dermal fibroblast
Fibroblasts were obtained from the Yale Skin Disease Research Core Labs, Department of Dermatology, Yale Medical School. Cells were maintained in Dulbecco's modified Eagle's medium‐Ham's F‐12 (GIBCO‐BRL/Life Technologies, Gaithersburg, MD) supplemented with 10% fetal calf serum (Gemini Bio‐products , Woodland, CA), 5μg/ml deoxycytidine–thymidine (Sigma‐Aldrich, St. Louis, MO) and antibiotics (100 U/l penicillin, 100μg/ml streptomycin, 250μg/ml amphotericin B; all from GIBCO‐BRL) at 37°C in a humidified incubator with 5% CO2. Cells used for experiments were from passages 6 to 12.
Application of CS
Fibroblasts were seeded onto type I collagen‐coated flexible membranes (Flex 1 plate; Flexcell International, McKeesport, PA), and when they attained 70–80% confluence, they were subjected to repetitive mechanical deformation with a Flexcell Strain Unit (FX‐4000; Flexcell International) as described earlier 25, 26. The apparatus produces a heterogeneous strain pattern across the stretched membrane (27). When a vacuum of 135 mmHg is applied to the membrane, cells grown at 6–10 mm from the centre of the well experience strains of 10–24%, while cells 0–5 mm from the centre of the well experience a little to no strain.
Cell rotation studies
Cells were seeded on plates for 24 hours before study initiation. Four sites were chosen at the well periphery and centre of the well for analysis. Pictures were taken from the same four sites at time 0 and following 4‐ and 12‐hour stretch. Cells were counted based on rotation angle from the stretch vector (Figure 1A). Cells parallel to the stretch vector were considered 0° rotated and cells perpendicular to the stretch vector were considered 90° rotated. Cells between 0° and 30° rotated were scored as—(negative rotation), cells rotated between 30° and 60° were scored as 1+ (positive rotation) and cells rotated between 60° and 90° were scored as 2+. The change in the percentage of cells rotated in the three groupings was compared at the different time points.
Figure 1.
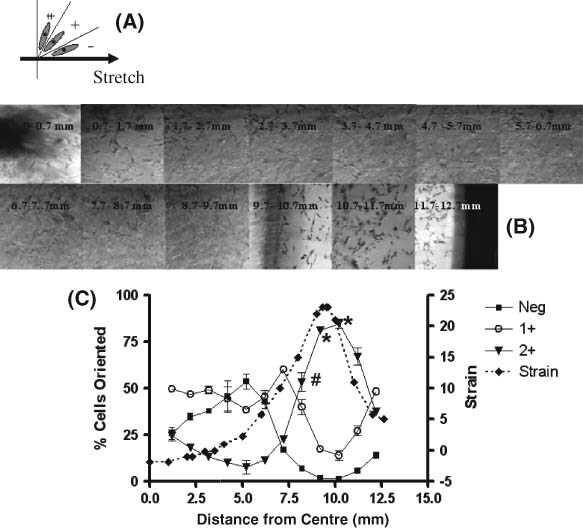
Analysis of radial distance‐dependent rotation angle of dermal fibroblast exposed to 10 cpm cyclic strain for 4 hours (CS). (A) Representation of cell rotation classification; Neg = 0–30° rotated; 1+ = 30–60° rotated; 2+ = 60–90° rotated. (B) Representative series of micrographs used to measure cell rotation. Micrographs were taken from the centre (0 mm) to periphery (12· 7 mm) of the plate (magnification × 100). Arrow indicates the direction of applied stretch. Cells were stained by a Giemsa staining method. Scion Image was used to measure the rotation angle of the fibroblasts. (C) Radial strain profiles and percentage of cells rotated in each classification. The peak radial strain occurs between 8· 7 and 10· 7 mm from the centre of the well. Data for percentage of cells rotated are the means of three experiments. Asterisks represent distances where significantly more cells were rotated 60–90° (2+) (P < 0· 05). Pound sign represents initial distance where cells show significantly greater 2+ rotation than that seen at the centre of the well (P < 0· 05).
In some experiments, fibroblasts were treated with anti‐integrins α1 (20μg/ml), α2 (20μg/ml), α3 (20μg/ml) or β1 (5μg/ml) antibodies (UPSTATE, Charolottesville, VA) or to C3 transferase (0· 6μg/ml) (Cytoskeleton, CA) or SB203580 (30μM) (A.G. Scientific, San Diego, CA) before cs. The C3 transferase is a selective inhibitor of RhoA, RhoB and RhoC. SB203580 is a pridinyl imidazole which acts as a specific inhibitor of p38 MAP kinase.
Immunoblot technique
Before (static conditions) and after exposure to 10% average stretch, 10 cycles per minute (10%/10 cpm) of CS, cells were washed with ice‐cold phosphate buffered solution (PBS) and scraped into lysis buffer (50‐mM HEPES, 150‐mM sodium chloride, 1‐mM sodium orthovanadate, 1‐mM phenylmethylsulfonyl fluoride, 10% glycerol, 1% Triton X‐100 and 10 mg/ml leupeptin). Supernatants were collected following cell lysis and Laemmli buffer was added. Gels (10%; Bio‐Rad Laboratories, Hercules, CA) were loaded with equal protein (38 mg/lane). Proteins were separated via gel electrophoresis (Bio‐Rad Laboratories ) and then electrophoretically transferred onto nitrocellulose membranes (Amersham Life Science , Arlington Heights, IL). Membranes were incubated with primary antibody: anti‐FAK antibody, anti‐phospho‐FAK (Tyr576/577) antibody (Cell Signaling Technology), anti‐p38 antibody, anti‐phospho‐p38 antibody, anti‐Rho antibody, anti‐GTP‐Rho antibody, anti‐integrin α1 antibody, anti‐integrin α2 antibody, anti‐integrin α3 antibody or anti‐integrin β1 antibody. Membranes were then probed with appropriate secondary antibodies: goat anti‐rabbit IgG antibody conjugated to horseradish peroxidase, before detection of immunoreactivity using enhanced chemiluminescence (Amersham ). All blots were quantified using densitometry (BioImage , Ann Arbor, MI).
IMMUNOCYTOCHEMICAL STAINING
After exposure to static and CS, cells were washed with ice‐cold PBS. Cells were then fixed with ice‐cold acetone for 15 minutes, allowed to air dry, rinsed in PBS and incubated in 3% bovine serum albumium (BSA) for 1 hour. Then, cells were washed with PBST (PBS, pH 7· 4 with 0· 1% Triton X‐100), and incubated with the following diluted antibodies: anti‐integrin β1 (1:200; UPSTATE, Charolottesville, VA), anti‐integrin α1 (1:60), anti‐integrin α2 (1:70), anti‐integrin α3 (1:50) or anti‐p‐FAK [(1:300); CHEMSION International Inc., Temecula CA]. Following incubation, cells were washed in PBST, covered with 200μl of Image‐iTTM FX signal enhancer (Invitrogen Cor., Carlbad CA) and incubated for 30 minutes at room temperature. Cells were then rinsed thoroughly with buffer, and antigens of interest were visualised using Alexa Fluor® 488 conjugated secondary antibody (1:200). Cells were assessed by confocal microscopy.
Statistical analysis
Data for cell orientation were analysed using Wilkoxon/Kruskal‐Wallis Rank Sum tests. Means were compared using Tukey–Kramer method. For FAK, Rho, p38 and integrin experiments, data were analysed using ANOVA. Means were compared with t‐tests. All analyses were conducted using JMP software (SAS Institute, Inc., Cary, NC) and P values less than 0· 05 were considered significant.
RESULTS
Radial strain increases non linearly from the centre of the well to the well edge. Peak radial strain occurs between 9· 2 and 10· 7 mm from the centre of the Flexcell well. In this area of exposure to high strain, following 4 hours of exposure to 10 cpm and 0–24% strain (cs), over 80% of the cells were rotated between 60° and 90° (2+ rotation) from the strain vector (Figure 1B and C). A higher percentage of cells were rotated 2+ between 9· 2 and 10· 7 mm than for any other distance from the centre of the well (P < 0· 05). Significantly more cells were rotated between 60° and 90° from the strain vector following exposure to higher strain than to the lower strains experienced between 0 and 8· 2 mm from the centre of the Flexcell well (Figure 1B and C). The first significant increase in cells rotated 2+ (relative to the centre of the well) occurred at 8· 2 mm from the centre of the well (P < 0· 05). This corresponds to strain levels of approximately 15%. By 12 hours of exposure to cs, 97% of cells at the area of high strain exhibited 2+ rotation (Figure 2). This number was significantly greater than the percentage of cells showing 2+ rotation at 4 hours (P < 0· 05).
Figure 2.
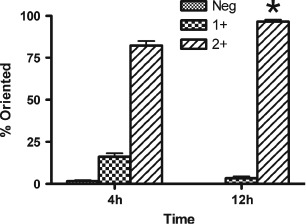
Analysis of percentages of cells rotated following either 4 or 12 hours of exposure to 10 cpm cyclic strain. Rotation was measured 10 mm from the centre of the wells, corresponding to areas of greatest strain. Neg = cells rotated 0–30° from the stretch vector; 1+ = 30–60° rotated from the stretch vector; 2+ = 60–90° rotated from the stretch vector. Asterisk indicates value which is significantly higher than all other percentage rotation values (P < 0· 05).
Figure 3 shows that it is the actual exposure to strain that induces rotation. There was no significant difference in cells rotated 0–30° (negative rotation) between static cells not exposed to cs and cells from near the centre of stretched wells experiencing 0% stretch (P = 0· 17). There was also no significant difference in cells rotated 30–60° (1+ rotation) between static cells not exposed to cs and cells from near the centre of stretched wells experiencing 0% stretch (P = 0· 32). Significantly less cells experienced negative or 1+ rotation when exposed to 23% cs than for static cultures or cells from stretched wells in areas of 0% stretch (P < 0· 05). Significantly more cells were rotated between 60° and 90° (2+ rotation) when exposed to 23% cs than for static cultures or cells from stretched wells in areas of 0% stretch (P < 0· 05).
Figure 3.
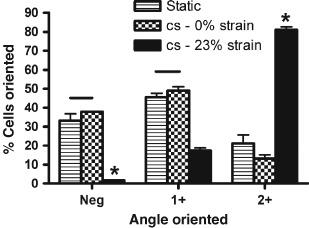
Analysis of the rotation angle of dermal fibroblasts not exposed to cyclic stretch (cs, static) compared to fibroblasts from near the centre of wells exposed to cs (cs −0% strain) and to fibroblasts from near the edge of the wells exposed to cs for 4 hours (cs −23% strain). Lines between bars indicate values which were not significantly different from each other (P > 0· 05). Asterisks represent values which differ from all other values (P < 0· 05).
To determine which integrins were involved in mechanotransduction, fibroblast cultures were exposed to cs for 30 minutes and the distribution and amounts of integrin α1, α2, α3 and β1 were measured using confocal microscopy, immunohistochemistry and immunoblotting (4, 5). A visual inspection of confocal micrographs indicated that integrin α3 fluorescence intensity appeared higher than for integrins α1 and α2 (Figure 4A). It also appeared that integrin α3 showed a perinuclear redistribution following 30 minutes of cs (Figure 5C and D). There did not appear to be any cellular redistribution of integrins α1 and α2 following 30 minutes of exposure to cs. The apparent increase in fluorescence intensity for integrin α3 was confirmed in immunoblot analysis (Figure 4B). While relative amounts of α integrins did not change over 30 minutes of exposure to cs (P > 0· 05), the relative amount of integrin α3 initially present in the fibroblasts was 2· 1‐ and 1· 6‐fold higher than for integrins α1 and α2, respectively (P < 0· 05). The distribution of integrin β1 was also determined following 30 minutes of exposure to stretch. Integrin β1 seemed to show a nuclear redistribution in response to 30 minutes of exposure to cs (Figure 5A and B). There was no increase in amount of integrin β1 following 30 minutes of cs as determined by immunoblot (data not shown).
Figure 4.
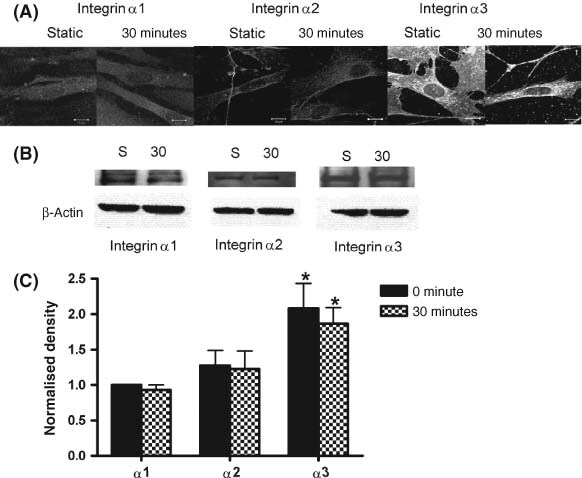
(A) Immunocytochemical staining of fibroblasts for integrins α1, α2 and α3. Integrins were stained in fibroblasts not exposed to cyclic stretch (static) or exposed to 30 minutes of 10 cpm cyclic stretch (cs). Representative micrographs were taken at 9· 7 mm from the centre of the well. Using confocal microscopy, fluorescence intensity of integrin α3 appears greater than fluorescence intensity for integrins α1 and α2 (B) Representative immunoblots of integrins α1, α2 and α3 for fibroblasts not exposed to cs or exposed to cs for 30 minutes. β‐Actin was used as loading control. (C) Densitometric analysis of integrins α1, α2 and α3 normalised to loading control. Values represent the means from three separate experiments. Integrin α3 levels are significantly higher than either integrin α1 or α2 (P < 0· 05).
Figure 5.
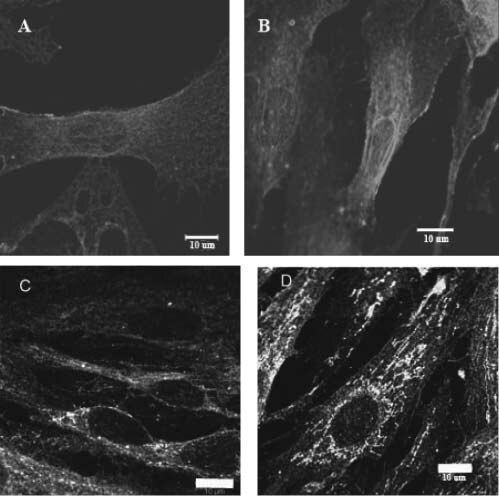
The redistribution of integrins β1 (A and B) and α3 (C and D) following exposure to cyclic stretch (cs). Immunocytochemical staining for fibroblasts not exposed to cyclic stretch (A and C) or exposed to 30 minutes of 10 cpm cs (B and D). Representative micrographs were taken at 9· 7 mm from the centre of the well. Using confocal microscopy, it appeared that both integrins β1 and α3 showed a perinuclear redistribution following 30 minutes of cyclic stretch. Arrow indicates perinuclear redistribution of integrin β1).
To determine if integrins were involved in cell rotation, cell cultures were treated with integrin antibodies before exposure to cs. Figure 6 shows that treatment with anti‐integrin α1, −α2 or −α3 antibodies did not lead to a decrease in percentage of cells (from cells exposed to cs alone) rotated between 60° and 90° from the strain vector (P > 0· 05). However, there were 56· 9% less cells rotated between 60° and 90° (P < 0· 05) from the strain vector for cell cultures treated with anti‐integrin β1 antibody before cs. There was no significant difference in the percentages of cells rotating 60–90° from the strain vector between cells treated with anti‐integrin β1 antibody before cs and cells not exposed to stretch (static).
Figure 6.
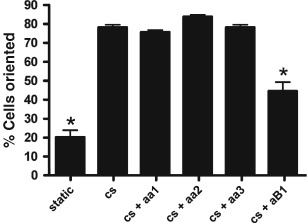
Percentages of cells rotated between 60° and 90° in response to 10 cpm (10% ave) cyclic stretch (cs). Cells were exposed to either no stretch (static) or cs for 4 hours. For comparison, cells were incubated with anti‐integrin α1 (aa1), α2 (aa2), α3 (aa3) or β1 (aB1) before cs. Data for percentage of cells rotated are the means of three experiments. Asterisks represent those values which are significantly different from all values without asterisks (P < 0· 05).
Figure 7 shows that FAK phosphorylation values were significantly increased in cs control after 0· 25, 1 and 5 minutes of treatment (P < 0· 05). When fibroblasts were treated with anti‐integrin‐β1 before stretching, FAK phosphorylation was significantly decreased 1· 6‐ and 1· 7‐fold relative to cs controls at 0· 25 and 1 minutes, respectively (P < 0· 05). Treatment of cells with anti‐integrin‐β4 antibody before cs did not decrease FAK phosphorylation over cs controls (P > 0· 05).
Figure 7.
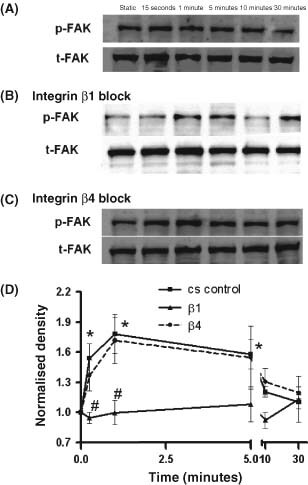
Immunoblot analyses of FAK phosphorylation for dermal fibroblasts following 0, 0· 25, 1, 5, 10 or 30 minutes of exposure to: (A) 10 cpm cyclic stretch (cs control) (B) CS plus anti‐integrin β1 antibody (5μg/ml) treatment. (C) CS plus anti‐integrin β4 antibody (5μg/ml) treatment. (D) Densitometric analysis of FAK phosphorylation normalised to β‐actin loading control. Values represent the means from three separate experiments. Asterisks show FAK phosphorylation values were significantly increased in cs control after 0· 25, 1 and 5 minutes of treatment (P < 0· 05). Pound symbols show that FAK phosphorylation for anti‐β1–treated fibroblasts was significantly less than cs controls at 0· 25 and 1 minutes (P < 0· 05).
Figure 8 shows that following 5 to 10 minutes exposure to cs, levels of activated p38 (phospho‐p38) were increased 2· 0‐ and 2· 1‐fold, respectively, from time 0 (P < 0· 05). There was no similar increase in activated p38 seen for cell cultures pre‐incubated with integrin β1 antibodies.
Figure 8.
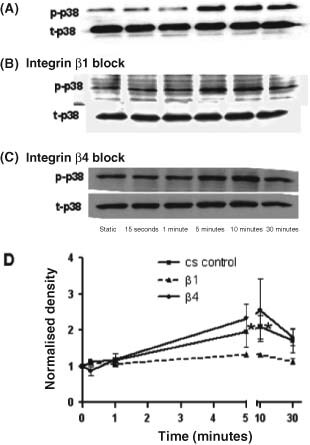
Immunoblot analyses of p38 phosphorylation for dermal fibroblasts following 0, 0· 25, 1, 5, 10 or 30 minutes of exposure to: (A) 10 cpm cyclic stretch (cs control); (B) CS plus anti‐integrin β1 antibody (5μg/ml) treatment; (C) CS plus anti‐integrin β4 antibody (5μg/ml) treatment; (D) Densitometric analysis of p38 phosphorylation normalised to β‐actin loading control. Values represent the means from three separate experiments. Asterisks show p38 phosphorylation values were significantly increased in cs control after 5 and 10 minutes of treatment (P < 0· 05).
Following the 10 minutes of exposure to cs, GTP‐Rho (activated Rho) was increased 2· 3‐fold over time 0 (Figure 9A, P < 0· 05). To determine if the increases in activated Rho and p38 were involved in cell orientation, cell cultures were treated with either C3 transferase or SB203580 before exposure to cs to inhibit Rho or p38 activation, respectively (Fig. 9B). Pre‐treatment of the cell cultures with C3 transferase led to a 21% decrease in cells rotating 60–90° from the stretch vector while pre‐treatment of cell cultures with SB203580 led to a 14% decrease in cells rotating 60–90° from the stretch vector.
Figure 9.
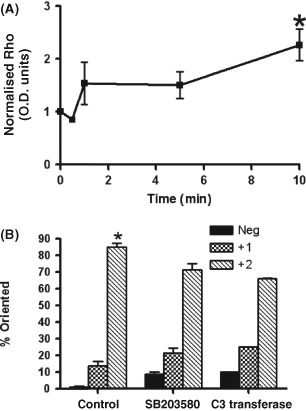
(A) Densitometric analysis of immunoblots Rho activation (GTP‐Rho) following exposure to 10 cpm cyclic stretch (cs control). Activated Rho was normalised to total Rho following normalisation to β‐actin loading control. Values represent the means from three separate experiments. Asterisks show that activated Rho values were significantly increased in cs control following 10 minutes of exposure to cs (P < 0· 05). (B) Percentages of cells rotated in response to exposure to 10 cpm (10% ave) cyclic stretch (cs control), C3 transferase + cs or SB203580 + cs . Rotation was measured 10 mm from the centre of the wells, corresponding to areas of greatest strain. Neg = cells rotated 0–30° from the stretch vector; 1+ = 30–60° rotated from the stretch vector; 2+ = 60–90° rotated from the stretch vector. Asterisk indicates value which is significantly higher than all other percentage rotation values (P < 0· 05).
DISCUSSION
In the present study, we have examined the integrin‐mediated signalling events involved in cell orientation in response to exposure to cs. Fibroblasts were grown on flexible, collagen‐coated Flexcell membranes and exposed to cs. The degree of stretch deformation was not uniform throughout the different regions of the Flexcell well membranes. Figure 1 shows that from the centre to the periphery of the well, the strain levels range from—1· 8% to a maximum of approximately 23%. The maximum strain occurs between 9· 2 and 10 mm from the centre of the well. The peak cell rotation in response to cs occurred in the portion of the well experiencing the maximum strain. There was no difference in percentage cell rotation between 0° and 60° for static cell cultures not exposed to cs and for cells from stretched wells exposed to 0% stretch. This is evidence that it is the physical experience of stretch which stimulates individual cell movement and not paracrine or juxtacrine signalling from cells experiencing stretch. A threshold strain level of approximately 15% was required to stimulate significant 2+ rotation. The percentage of cells maximally oriented in response to stretch reached a maximum of 97% following 12 hours of stretch.
Integrins are transmembrane glycoprotein receptors that mediate cell–matrix or cell–cell adhesion, and transduce signals that regulate gene expression and cell growth and migration 13, 28. These heterodimeric molecules consist of non covalently linked α and β subunits. Different combinations of alpha and beta polypeptides form complexes that vary in their ligand‐binding specificities. Integrins α1β1, α2β1, and α3β1 are considered collagen‐binding integrins. The α subunit may be further subcategorised into I and non I domain integrins. Integrins α1 and α2 are I domain whereas integrin α3 is non I domain. Only the I domain integrins play a significant role in ligand binding (29). While no increases in integrins were observed in response to cs in the current study, initial amounts of integrin α3 were greater than integrins α1 and α2 and in response to cs, integrins β1 and α3 showed perinuclear redistribution. Clustering and perinuclear distribution of integrins have been reported previously 30, 31. It is believed that the recycling of integrins between the leading edge and the perinuclear region may facilitate cell movement 31, 32.
FAK is also believed to be important in mechanotransduction to the cytoskeleton from integrin‐mediated signalling networks during migration 13, 33, 34, 35. FAK‐/‐ cells are unable to re‐orient in response to changes in the ECM (36). CS is known to stimulate FAK phosphorylation (13). In the present study FAK phosphorylation in response to cs occurred quickly, within 1 minute of exposure to cs. This increase in phosphorylation was dependent upon integrin β1, as when cells were incubated with anti‐integrin β1 antibody before cs, FAK phosphorylation was abrogated. Treatment with anti‐integrin β4 antibody (a non collagen–binding integrin) did not affect FAK phosphorylation in response to cs.
In a similar manner, p38 activation also increased quickly, showing significant increases within 5–10 minutes of exposure to cs. This activation was also dependent upon integrin β1, as pre‐incubation of cell cultures with anti‐integrin β1 antibody before cs abrogated p38 activation. Significant Rho activation also occurred within 10 minutes of exposure to cs. Rho regulates formation of stress fibres which are thought to provide the impetus for forward movement of the cell (17). Indeed, it was found that inhibition of p38 and Rho led to significant decreases in percentages of cells oriented 60–90° to the stretch vector. Therefore, it seems that p38 and Rho are at least partially responsible for cell movement in response to stretch.
Tension is one of the most important stimuli involved in the transformation of fibroblasts to myofibroblasts (37). Myofibroblasts appear in wound granulation tissue during the proliferative phase of wound healing. During this phase, tension builds up in the granulation tissue and cells align parallel to the tension (4). The current study shows that cell alignment occurs rapidly, within 4 hours of exposure to cs. At least 15% stretch is necessary to stimulate significant cell alignment and integrin β1 is at least partially responsible for this alignment. Downstream signalling events associated with cs seem to include FAK, p38 and Rho activation. Although inhibition of any one of these markers decreases but does not totally abrogate cell alignment, each of these markers contributes to cell alignment. Future studies will assess sequences of downstream signalling events which are involved in cell alignment in response to cs exposure.
ACKNOWLEDGEMENTS
The study was funded in part by grants from the National Institutes of Health HL R01‐47345, VA Merit Review Board and the North American Center for Limb Preservation.
Presented at the 3rd Academic Surgical Congress, Huntington Beach, CA, February 13, 2008.
REFERENCES
- 1. Lehoux S, Tedgui A. All strain, no gain. Circ Res 2003;93:1139–41. [DOI] [PubMed] [Google Scholar]
- 2. Lee DJ, Rosenfeldt H, Grinnell F. Activation of ERK and p38 MAP kinases in human fibroblasts during collagen matrix contraction. Exp Cell Res 2000;257:190–7. [DOI] [PubMed] [Google Scholar]
- 3. Roposch A, Steinwender G, Linhart WE. Implantation of a soft‐tissue expander before operation for club foot in children. J Bone Joint Surg Br 1999;81:398–401. [DOI] [PubMed] [Google Scholar]
- 4. Werner S, Krieg T, Smola H. Keratinocyte‐fibroblast interactions in wound healing. J Invest Dermatol 2007;127:998–1008. [DOI] [PubMed] [Google Scholar]
- 5. Singer AJ, Clark RA. Cutaneous wound healing. N Engl J Med 1999;341:738–46. [DOI] [PubMed] [Google Scholar]
- 6. Ylä‐Outinen H, Aaltonen V, Björkstrand A‐S, Hirvonen O, Lakkakorpi J, Vähä‐Kreula M, Laato M, Peltonen J. Upregulation of tumor suppressor protein neurofibromin in normal human wound healing and in vitro evidence for platelet derived growth factor (PDGF) and transforming growth factor‐beta1 (TGF‐beta1) elicited increase in neurofibromin mRNA steady‐state levels in dermal fibroblasts. J Invest Dermatol 1998;110:232–7. [DOI] [PubMed] [Google Scholar]
- 7. Webb K, Hitchcock RW, Smeal RM, Li W, Gray SD, Tresco PA. Cyclic strain increases fibroblast proliferation, matrix accumulation, and elastic modulus of fibroblast‐seeded polyurethane constructs. J Biomech 2006;39:1136–44. [DOI] [PubMed] [Google Scholar]
- 8. Chiquet M, Sarasa‐Renedo A, Tunc‐Civelek V. Induction of tenascin‐C by cyclic tensile strain versus growth factors: distinct contributions by Rho/ROCK and MAPK signaling pathways. Biochim Biophys Acta 2004;1693:193–204. [DOI] [PubMed] [Google Scholar]
- 9. Danciu TE, Gagari E, Adam RM, Damoulis PD, Freeman MR. Mechanical strain delivers anti‐apoptotic and proliferative signals to gingival fibroblasts. J Dent Res 2004;83:596–601. [DOI] [PubMed] [Google Scholar]
- 10. Nishimura K, Blume P, Ohgi S, Sumpio BE. The effect of different frequencies of tensile strain on human dermal fibroblast proliferation and survival. Wound Repair Regen 2007;15:646–56. [DOI] [PubMed] [Google Scholar]
- 11. Alenghat FJ, Ingber DE. Mechanotransduction: all signals point to cytoskeleton, matrix, and integrins. Sci STKE 2002;2002:PE6. [DOI] [PubMed] [Google Scholar]
- 12. McNulty AK, Schmidt M, Feeley T, Kieswetter K. Effects of negative pressure wound therapy on fibroblast viability, chemotactic signaling, and proliferation in a provisional wound (fibrin) matrix. Wound Repair Regen 2007;15:838–46. [DOI] [PubMed] [Google Scholar]
- 13. Katsumi A, Orr AW, Tzima E, Schwartz MA. Integrins in mechanotransduction. J Biol Chem 2004;279:12001–04. [DOI] [PubMed] [Google Scholar]
- 14. Henshaw DR, Attia E, Bhargava M, Hannafin JA. Canine ACl fibroblast integrin expression and cell alignment in response to cyclic tensile strain in three‐dimensional collagen gels. J Orthop Res 2006;24:481–90. [DOI] [PubMed] [Google Scholar]
- 15. Buckley MJ, Banes AJ, Levin LG, Sumpio BE, Sato M, Jordan R, Gilbert J, Link GW, Tran Son Tay R. Osteoblasts increase their rate of division and align in response to cyclic, mechanical tension in vitro. Bone Miner 1988;4:225–36. [PubMed] [Google Scholar]
- 16. Palecek SP, Schmidt CE, Lauffenburger DA, Horwitz AF. Integrin dynamics on the tail region of migrating fibroblasts. J Cell Sci 1996;109:941–52. [DOI] [PubMed] [Google Scholar]
- 17. Nobes CD, Hall A. Rho GTPases control polarity, protrusion, and adhesion during cell movement. J Cell Biol 1999;144:1235–44. [DOI] [PMC free article] [PubMed] [Google Scholar]
- 18. Hall A, Nobes CD. Rho GTPases: molecular switches that control the organization and dynamics of the actin cytoskeleton. Phil Trans R Soc Lond 2000;355:965–70. [DOI] [PMC free article] [PubMed] [Google Scholar]
- 19. Pelham RJ, Wang YL. Jr. Cell locomotion and focal adhesions are regulated by substrate flexibility. Proc Natl Acad Sci USA 1997;94:13661–5. [DOI] [PMC free article] [PubMed] [Google Scholar]
- 20. Hu K, Ji L, Applegate KT, Danuser G, Waterman‐Storer CM. Differential transmission of actin motion within focal adhesions. Science 2007;315:111–15. [DOI] [PubMed] [Google Scholar]
- 21. Carlson MA, Longaker MT. The fibroblast‐populated collagen matrix as a model of wound healing: a review of the evidence. Wound Repair Regen 2004;12:134–47. [DOI] [PubMed] [Google Scholar]
- 22. Carlson MA, Longaker MT, Thompson JS. Modulation of FAK, Akt, and p53 by stress release of the fibroblast‐populated collagen matrix. J Surg Res 2004;120:171–7. [DOI] [PubMed] [Google Scholar]
- 23. Pirone DM, Liu WF, Ruiz SA, Gao L, Raghavan S, Lemmon CA. An inhibitory role for FAK in regulating proliferation: a link between limited adhesion and RhoA‐ROCK signaling. J Cell Biol 2006;174:277–88. others. [DOI] [PMC free article] [PubMed] [Google Scholar]
- 24. Parsons JT, Martin KH, Slack JK, Taylor JM, Weed SA. Focal adhesion kinase: a regulator of focal adhesion dynamics and cell movement. Oncogene 2000;19:5606–13. [DOI] [PubMed] [Google Scholar]
- 25. Ikeda M, Takei T, Mills I, Kito H, Sumpio BE. Extracellular signal‐regulated kinases 1 and 2 activation in endothelial cells exposed to cyclic strain. Am J Physiol 1999;276:H614–22. [DOI] [PubMed] [Google Scholar]
- 26. Kito H, Chen EL, Wang X, Ikeda M, Azuma N, Nakajima N, Gahtan V, Sumpio BE. Role of mitogen‐activated protein kinases in pulmonary endothelial cells exposed to cyclic strain. J Appl Physiol 2000;89:2391–400. [DOI] [PubMed] [Google Scholar]
- 27. Iba T, Sumpio BE. Tissue plasminogen activator expression in endothelial cells exposed to cyclic strain in vitro. Cell Transplant 1992;1:43–50. [DOI] [PubMed] [Google Scholar]
- 28. Maheshwari G, Wells A, Griffith LG, Lauffenburger DA. Biophysical integration of effects of epidermal growth factor and fibronectin on fibroblast migration. Biophys J 1999;76:2814–23. [DOI] [PMC free article] [PubMed] [Google Scholar]
- 29. Takada Y, Ye X, Simon S. The integrins. Genome Biol 2007;8:215.1–215.9. [DOI] [PMC free article] [PubMed] [Google Scholar]
- 30. Katsumi A, Naoe T, Matsushita T, Kaibuchi K, Schwartz MA. Integrin activation and matrix binding mediate cellular responses to mechanical stretch. J Biol Chem 2005;280:16546–9. [DOI] [PubMed] [Google Scholar]
- 31. Pellinen T, Ivanska J. Integrin traffic. J Cell Sci 2006;119:3723–31. [DOI] [PubMed] [Google Scholar]
- 32. Galbraith CG, Yamada KM, Galbraith JA. Polymerizing actin fibers position integrins primed to probe for adhesion sites. Science 2007;315: 992–5. [DOI] [PubMed] [Google Scholar]
- 33. Wang HB, Dembo M, Hanks SK, Wang Y. Focal adhesion kinase is involved in mechanosensing during fibroblast migration. Proc Natl Acad Sci USA 2001;98:11295–300. [DOI] [PMC free article] [PubMed] [Google Scholar]
- 34. Sieg DJ, Hauck CR, Ilic D, Klingbeil CK, Schaefer E, Damsky CH, Schdaepfer DD. FAK integrates growth‐factor and integrin signals to promote cell migration. Nat Cell Biol 2000;2: 249–56. [DOI] [PubMed] [Google Scholar]
- 35. Owen JD, Ruest PJ, Fry DW, Hanks SK. Induced focal adhesion kinase (FAK) expression in FAK‐null cells enhances cell spreading and migration requiring both auto‐ and activation loop phosphorylation sites and inhibits adhesion‐dependent tyrosine phosphorylation of Pyk2. Mol Cell Biol 1999;19:4806–18. [DOI] [PMC free article] [PubMed] [Google Scholar]
- 36. Tilghman RW, Slack‐Davis JK, Sergina N, Martin KH, Iwanicki M, Hershey ED, Beggs HE, Reichardt LF, Parsons JT. Focal adhesion kinase is required for the spatial organization of the leading edge in migrating cells. J Cell Sci 2005;118:2613–23. [DOI] [PubMed] [Google Scholar]
- 37. Hinz B, Mastrangelo D, Iselin CE, Chaponnier C, Gabbiani G. Mechanical tension controls granulation tissue contractile activity and myofibroblast differentiation. Am J Pathol 2001;159:1009–20. [DOI] [PMC free article] [PubMed] [Google Scholar]