

Abstract
Protein tyrosine kinase 6 (PTK6; also called Brk) is overexpressed in 86% of breast cancer patients; high PTK6 expression predicts poor outcome. We reported PTK6 induction by HIF/GR complexes in response to either cellular or host stress. However, PTK6-driven signaling events in the context of TNBC remain undefined. In a mouse model of TNBC, manipulation of PTK6 levels (i.e. via knock-out or add-back) had little effect on primary tumor volume but altered lung metastasis. To delineate the mechanisms of PTK6 downstream signaling, we created kinase-dead (KM) and kinase-intact domain structure mutants of PTK6 via in frame deletions of the N-terminal SH3 or SH2 domains. While the PTK6 kinase domain contributed to soft-agar colony formation, PTK6 kinase activity was entirely dispensable for cell migration. Specifically, TNBC models expressing a PTK6 variant lacking the SH2 domain (SH2-del PTK6) were unresponsive to growth factor-stimulated cell motility relative to SH3-del, KM or wild-type PTK6 controls. Reverse phase protein array (RPPA) revealed that while intact PTK6 mediates spheroid formation via p38 MAPK signaling, the SH2 domain of PTK6 limits this biology, and instead mediates TNBC cell motility via activation of the RhoA and/or AhR signaling pathways. Inhibition of RhoA and/or AhR blocked TNBC cell migration as well as the branching/invasive morphology of PTK6+/AhR+ primary breast tumor tissue organoids. Inhibition of RhoA also enhanced paclitaxel cytotoxicity in TNBC cells, including in a taxane-refractory TNBC model.
Keywords: Brk/PTK6, AhR, Migration, Invasion, Metastasis
INTRODUCTION
Triple negative breast cancer (TNBC) affects ~20% of all breast cancer patients, but is highly aggressive, with shortened survival and higher risk of metastases relative to other molecular subtypes (1–3). Generally defined by the absence of estrogen receptor (ER), progesterone receptor (PR), and a lack of amplification of the human epidermal growth factor receptor 2 (HER2) (3). TNBC is currently managed with systemic cytotoxic chemotherapy regimens, including taxanes. However, rapid onset of chemotherapy resistance is common (3). Although new targeted therapeutic agents for TNBC, such as PARP1 inhibitors, are being developed, these agents are effective in only ~20% of TNBC patients (2,4,5). Thus, there is an urgent need to identify other molecular targets for pharmacological targeting.
The glucocorticoid receptor (GR), a member of the steroid hormone receptor superfamily, is expressed in 15-40% of TNBC patients; GR expression is correlated with poorer clinical prognosis (6). When activated by endogenous ligands (cortisol) or exogenous ligands (dexamethasone), GR promotes the expression of gene programs that are essential for cancer phenotypes such as migration, invasion and anchorage-independent growth (7). We previously identified that GR interacts with the aryl hydrocarbon receptor (AhR), a bHLH/PAS domain transcription factor related to the hypoxia inducible factors (HIFs) (8). We also reported cross-talk between stress hormone-driven GR signaling and HIF-regulated stress response pathways in TNBC (9). The interaction of GR and AhR promotes cancer pro-survival phenotypes in response to cellular stressors, including hypoxia and chemotherapy treatment (e.g., paclitaxel [Taxol]) in TNBC cell lines (8). Notably, the interaction of GR and AhR/HIF1α is essential for the inducible expression of protein tyrosine kinase 6 (PTK6) (8).
PTK6 is an intracellular tyrosine kinase overexpressed in approximately 86% of invasive ductal breast cancer cases, whereas it is weakly expressed or undetectable in normal breast tissues (10). Furthermore, PTK6 expression is correlated with tumor grade in invasive ductal carcinomas tissues (10). PTK6 is essential for EGF- and HGF-mediated tumor cell migration in breast cancer models (11). PTK6 mediates its oncogenic actions in part by modulating the actions of GTPases in luminal breast cancer models (10,12). Additionally, PTK6 is essential for the phosphorylation and subsequent activation of p38 MAPK and ERK5, serine/threonine kinases that have been implicated in migratory phenotypes and cancer stem cell (CSC) generation (11,13,14). Similarly, PTK6 expression has been associated with induction of anchorage-independent growth in prostate and breast cancers (15–17). Therefore, targeting PTK6 is attractive as a treatment strategy, in metastatic breast and other cancers.
PTK6 protein structure is closely related to that of Src tyrosine kinase, although it lacks a myristoylation site responsible for plasma membrane anchoring (18). In addition to a kinase domain, it contains the Src-homology domains SH2 and SH3 (19). Unlike other kinases that are overexpressed in cancer, it is not clear whether the kinase domain is the principal domain mediating PTK6’s tumorigenic activity. Recent reports indicate that inhibition of kinase activity is not sufficient to block the oncogenic actions of PTK6 in breast cancer. For example, in luminal breast cancer, growth factor-mediated migration requires PTK6 expression but not the kinase domain (11). More importantly, inhibiting the kinase domain with various small molecules that only inhibit the unphosphorylated form of PTK6 (Type II inhibitors), does not appreciably decrease tumor growth or proliferation in either luminal or triple-negative breast cancer models (19). These observations suggest that PTK6 structural domains other than the kinase domain, are critical for cancer cell biology. Both the SH3 and SH2 domains play an important role in protein-protein interactions (20–22) via proline-rich or phospho-tyrosine motifs, respectively. Specifically, the sequence pY-(D/E)-(D/E)-Y was identified as a binding site for the SH2 domain of PTK6 (23). There is evidence of PTK6 somatic mutations in renal cell carcinoma and gastric cancers that not only span the kinase domain, but also involve the SH2 and SH3 domains (24). These mutations have profound effects on PTK6 kinase activity and substrate binding by modulating autophosphorylation or substrate activation (19). Therefore, before considering PTK6 as a viable pharmacological target for TNBC, it is essential to dissect the domain-specific functions of PTK6.
Herein, in vivo studies demonstrated that PTK6 has little effect on primary tumor growth, but significantly contributes to TNBC metastasis to lungs. To test the requirement of PTK6 kinase, SH2, or SH3 domains for TNBC phenotypes, we stably expressed wild-type (wt), kinase-dead (KM), or mutant constructs of PTK6 lacking the SH2 or SH3 domains in a previously characterized MDA-MB-231 PTK6 knockout (KO) cell line (8). A screen for domain-dependent signaling revealed that the PTK6 SH2-domain mediates activation of RhoA and AhR transcriptional activity; chemical inhibitors to either pathway repressed cell motility and migration. Moreover, pairing a RhoA inhibitor (CT04) with paclitaxel enhanced growth inhibitory effects in TNBC models. Together, our data reveal that the PTK6 SH2 domain serves as a hub to coordinate two key downstream signaling pathways, RhoA and AhR, which mediate TNBC stemness, cell migration and/or sensitivity to taxanes.
MATERIALS AND METHODS
Public Data Mining.
Datasets were analyzed as described in the Supplemental Methods.
Cell Culture and PTK6 KO cells.
MDA-MB-231 PTK6 clone 27 knockout (KO) cells were generated and cultured as described previously (8). The PTK6 KO admixture was generated by co-transfecting MDA-MB-231 cells with a gRNA to PTK6 (#CM-003166-01-0002) or to a non-targeting control (NTC; # U-007503-01-05), a Cas9-expressing plasmid (#U-005300) and transfection reagent (DharmaFECT Duo) using the manufacturer’s recommendations (Dharmacon Inc., Lafayette, CO USA). At 72 h post-transfection, cells were selected with 1 μg/mL of puromycin and then maintained with 0.3 μg/mL of puromycin. To generate the clone admixture, 3 individual PTK6 KO clones with the highest deletion frequency of PTK6 were admixed 1:1:1 with each other and expanded for fewer than 4 passages before use in vitro or in vivo. cHCI-10 Luc2+ cells (abbreviated cHCI-10) were cultured in modified M87 media as described in (27). Hs578T cells were maintained in DMEM-Hi with 10% FBS and 1% penicillin/streptomycin. Cells were authenticated by short-tandem repeat (STR) profiling in December 2015 (ATCC) and in 2017 (Arizona Genetics Core), or by comparing gene expression profiles of the cHCI-10 primary cell line to the original HCI-10 PDX tumor material at the Huntsman Cancer Institute (HCI). All cell lines tested negative for mycoplasma before use in experiments.
Stable Cell Line Generation for PTK6 domain mutants.
Stable models of PTK6 domain mutant re-expression were generated by transfecting MDA-MB-231 PTK6-KO (clone 27) cells with pFB-neo vector containing FLAG-tagged wild-type (WT) PTK6, truncated PTK6 missing the N-terminal domain (SH3-del PTK6; Supplemental Figure S1A), PTK6 with SH2-domain deleted (SH2-del PTK6; Supplemental Figure S1B), kinase-inactive (KM-PTK6) or constitutively active PTK6 containing point mutation at Tyr447 (YF-PTK6) using FuGENE HD (Roche Applied Sciences (Basel, Switzerland)). Stable pool populations were selected in and maintained with 0.2 mg/mL G418 sulfate (Thermo Fisher Scientific). HIF-1/HIF-2 double knockout (DKO) cells created by CRISPR/Cas9n-mediated deletion were created and propagated as described in Regan Anderson et al. 2018 (8). To generate wild type PTK6 over-expressing cells, MDA-MB-231 parent cells or HIF DKO cells were transduced with lentiviruses expressing either empty vector (pFB-neo) or pFB-PTK6; cells were then selected with 2 mg/mL of G418 and maintained with 1 mg/mL G418.
Immunoblotting.
Cells were harvested in RIPA-lite lysis buffer, resolved using SDS-PAGE, and transferred to PVDF membrane (Millipore) as previously described (28). Immunoblotting was performed with the following antibodies: FLAG (Sigma #F1804 RRID:AB_262044), PTK6 (Santa Cruz Biotechnology, Dallas, TX USA, Cat# sc-166243, RRID:AB_2300533), p38 MAPK (Santa Cruz Biotechnology. Cat# sc-81621 RRID:AB_1127392), phospho-p38 MAPK (Cell Signaling Technology, Danvers, MA USA, Cat# 4511 RRID:AB_2139682), GAPDH (Santa Cruz Biotechnology, Cat# sc-47724, RRID:AB_627678), RhoA (Cytoskeleton Inc., Cat# ARH04 RRID:AB_2728698), AhR (clone D5S6H; Cell Signaling Technology, Cat# 83200 RRID:AB_2800011), goat anti-rabbit IgG-HRP (BioRad), and goat anti-mouse IgG-HRP (BioRad). Blots were developed using an ECL reagent (Super Signal West Pico PLUS; Thermo Fisher Scientific) and imaged by film. Quantification of protein levels was determined using ImageJ (RRID:SCR_003070, Wayne Rasband, National Institutes of Health, http://rsbweb.nih.gov/ij/).
Soft Agar Assays.
Cells were seeded (4 x 10⁴ cells/well) in 1X sterile low melt agarose (Life Technologies) containing EGF (30 ng/mL). Soft agar assays were allowed to proceed for 14 days at 37°C, and then counted with ImageJ.
IncuCyte S3 Live Cell Imager Wound Healing Assays.
MDA-MB-231 cells were plated into 96-well format ImageLock microplates (Essen BioScience (Ann Arbor, MI USA)) at a density of either 4.5 x 10⁴ cells/well or 6 x 10⁴ cells/well (HIF DKO), such that cells would be at 100% confluence ~18 h after plating. The WoundMaker tool was used to create a uniform 800 μm scratch/well, the wounds were gently washed and growth media re-applied. Images were obtained every 2 h and data analyzed using the IncuCyte total wound area algorithm.
Migration and Invasion Assays.
Cell migration and invasion were analyzed as described in the Supplemental Methods.
Tail Vein Assay.
All animal studies were carried out in adherence to the NIH Principles of Laboratory Animal Care and protocols approved by the Institutional Animal Care and Use Committee at the University of Tennessee Health Science Center (protocols 17-080 or 18-045). 8-10-week old female Nod/Scid/Gamma (NGS) mice were injected via the tail vein with MDA-MB-231 +Vector or +PTK6 cells (2.5 x 10⁵) or HIF DKO +Vector or HIF DKO +PTK6 cells (5 x 10⁵ cells); more HIF DKO cells were injected due to the reduced metastatic potential of MDA-MB-231 cells lacking both HIF transcription factors (9). All animals were harvested at day 28 post-injection. 2 x 10⁵ MDA-MB-231 parent, non-targeting control (NTC) or PTK6 KO admixture cells were injected and animals were harvested at day 19 post injection. The lungs were inflated with formalin and post-fixed with formalin. Paraffin sections were stained with an anti-human specific mitochondrial marker ((AbCAM #ab92824) (29)). Whole stained slides were digitally scanned at high resolution with a 3DHISTECH PANORAMIC slide digitizer and the staining intensity analyzed by pixel counts using the densitometry algorithm to generate a percent “positive area” of metastasis score. Digital images of whole lungs representative of the mean value of each genotype are also shown.
Mammary fat pad transplantation.
5-6-week old female NSG mice were surgically inoculated via the left and right inguinal mammary gland fat pads with tumor cells (250,000) suspended in 10 μL of HBSS. Tumor size was measured twice a week using digital calipers and the body weight of the mice was recorded. The tumor volume was calculated as (width2 x length)/2. All mice were necropsied at day 30 post-inoculation, tumors were excised and measured ex vivo via calipers, and weighed.
Tumorsphere Assays.
Single cells were plated at 0.5 x 10³ cells/well in ultra-low attachment plates (Corning) in a serum-free DMEM/F12 phenol-free medium (Corning) containing 1% methylcellulose (Sigma), 1% B27 supplement (Invitrogen), 1% penicillin-streptomycin, 10 μg/mL heparin (Sigma Aldrich #H3149), 20 ng/mL EGF (Sigma Aldrich #E9644) and 20 ng/mL basic fibroblast growth factor (bFGF; Thermo Fisher Scientific #PHG0024). To generate secondary spheroids after 7-10 days, primary spheres were collected and dissociated enzymatically in 0.25% trypsin-EDTA (Corning). Single cells were plated in the media described above supplemented with complete culture medium (1:1 ratio). Spheroids were allowed to grow for 7-10 days. Four representative images/well were taken and spheroids larger than 50 μm were scored by manual counting. To measure tumorsphere size, 30-40 tumorspheres/condition were traced in ImageJ.
Reverse Phase Protein Array.
Cells were stimulated with HGF (50 ng/mL) for 30 min and then lysed with RPPA lysis buffer (1% Triton X-100, 50mM HEPES, pH 7.4, 150mM NaCl, 1.5mM MgCl2, 1mM EGTA, 100mM NaF, 10mM Na pyrophosphate, 1mM Na3VO4, 10% glycerol, freshly added protease and phosphatase inhibitors from Roche Applied Sciences #05056489001 and 04906837001, respectively). After clearing by centrifugation, lysates were denatured in Sample Buffer (40% Glycerol, 8% SDS, 0.25M Tris-HCl, pH 6.8, beta-mercaptoethanol at 1/10 volume). RPPA was performed by the MD Anderson RPPA Core as described in the Supplemental Methods. Raw and processed data are available using GEO accession # GSE156676.
Rho activation assay.
Activated Rho assays were performed according to the manufacturer’s instructions (Cytoskeleton Inc) as described in the Supplemental Methods.
Coimmunoprecipitation Assays.
MDA-MB-231 cells expressing WT PTK6 or SH2-del PTK6 were plated for at least 48 h before treatment with vehicle or HGF (50 ng/mL) for 30 min. Cells were harvested in ELB lysis buffer and processed as described previously (30).
Real-Time Quantitative-PCR (RT-qPCR).
Total RNA was extracted from cell samples using TriPure Isolation Reagent and isopropanol precipitation and processed as previously described (31) The oligonucleotide primers used are listed in Supplemental Table 1.
Chromatin immunoprecipitation assays.
Chromatin immunoprecipitation (ChIP) assays were conducted as previously described. The oligonucleotide primers used for ChIP-PCR are listed in Supplemental Table 1.
Patient sample processing.
De-identified tumor samples and normal adjacent tissue samples in excess of diagnostic requirements were obtained from University of Minnesota’s Biorepository and Laboratory Services program (IRB approval protocol #0305M47681). The organoid procedure was initiated within hours of surgery. Briefly, sliced pieces of tissue were incubated at 100 rpm for 30 min at 37°C in Collagenase A solution termed AdF+++ (Advanced DMEM/F12, Gibco; Thermo Fisher Scientific, supplemented with 1x GlutaMax (Gibco), 1X HEPES (Gibco), 1% penicillin/streptomycin (Life Technologies) and 2 mg/mL Collagenase type IV (Gibco; Thermo Fisher Scientific) for tumor samples or 1 mg/mL Collagenase for normal breast tissue. The digested tissue suspension was sequentially sheared using 10 mL, 5 mL and flamed glass Pasteur pipettes. After every shearing step the suspension was strained over a 100 μm filter with retained tissue pieces entering a subsequent shear step. FBS (2%) was added to the strained suspension before centrifugation at 2,000 rpm. The pellet was resuspended in 10 mL AdF+++ and centrifuged again, then seeded for organoid culture.
Organoid culture.
Neutralized rat tail Collagen I (Fisher Scientific #CB354249) was used to make a thin underlay on 24- or 96-well ultra-low attachment plates (Corning), and allowed to solidify at 37°C until ready for plating. The tissue pellet was resuspended in a mixture of 3:7 Matrigel (Fisher Scientific #08774552) to Collagen I, and the desired amount of matrix/organoid suspension was plated on top of the pre-prepared underlay. Plated organoids were incubated at 37°C, 5% CO2 for 45-60 min. After gelation, pre-warmed AdF+++ supplemented with R-Spondin 3 (250 ng/mL; PeproTech, Rocky Hill, NJ USA), Neuregulin (5 nM; PeproTech), EGF (5 ng/mL PeproTech), Noggin (100 ng/mL; PeproTech), and 1% B27 (Invitrogen) was added to the wells. Sterile PBS was added to empty wells to prevent desiccation. Organoid morphology was examined under phase contrast after 10 d, and the number of branching organoids counted. For qPCR analysis, organoids were collected from Matrigel/Collagen by addition of ice-cold AdF+++ and mixing with Pasteur pipettes. After collection by centrifugation, organoids were resuspended in TriPure Isolation Reagent (Roche Applied Sciences) and processed for qRT-PCR.
Growth inhibition assays following drug treatment using the IncuCyte S3 live cell imager.
cHCI-10 (1.5 x 10⁴) (paclitaxel-, or taxane-refractory) or parental MDA-MB-231 (paclitaxel-sensitive) (5 x 10³) cells were seeded per well in a flat-bottom 96-well plate and allowed to adhere for 24 h. Appropriate working dilutions of paclitaxel (Sigma; (a taxane tubulin inhibitor, also referred to as Taxol)), CT04 or CH223191 were prepared in M87 (cHCI-10) or DMEM-Hi (MDA-MB-231) growth media containing the fluorescent nuclear marker Miami Green to enumerate cells (Kerafast, Boston, MA USA, 1 μM final concentration). A dose range was tested for each individual drug to determine the IC30, IC50 and IC70 values (CT04: 0.01 μg/mL to 1 μg/mL, ~ equivalent to 0.4 nM to 40 nM, or CH223191: 1 μM to 75 μM for cHCI-10 and 100 nM to 50 μM for MDA-MB-231). Paclitaxel was added in combination with the approximate IC30 dose of either CT04 for cHCI-10 cells (0.1 μg/mL), or the dose used in transwell assays for MDA-MB-231 cells (1 μg/mL) or paired with CH223191 (8 μM, cHCI-10; 2.5 μM, MDA-MB-231). Each drug dose/condition was tested in triplicate, including untreated controls or vehicle-only controls. After addition of fresh growth medium containing each concentration of each drug to the cells, all bubbles were removed, and the plate incubated in the Incucyte S3 live-cell imager for a minimum of 48-96 h. Wells were scanned every 2-4 h to report cell density as measured by phase contrast and by green nuclear signal to enumerate cell number. Data were exported and input into Prism 8 (GraphPad Prism, RRID:SCR_002798) and the non-linear regression algorithm with sigmodal graphing used to generate representative dose curves. The reported IC50 values are the mean ± SEM of three independent biological replicate experiments. Combination indices were calculated in Excel (RRID:SCR_016137) using the isobole method; values for the combination index (CI) < 1.0 indicate drug synergy.
Statistical Analysis.
Data was tested for normal distribution using Shapiro-Wilks normality test and homogeneity of variances using Bartlett’s Test. Unless otherwise stated, results are presented as mean ± SD. Statistical analyses were performed using one-way or two-way ANOVA followed by multiple pairwise comparison tests. Significance was determined with 95% confidence; significance levels are defined as *p<0.05, **p<0.01, ***p<0.001, ****p<0.0001.
RESULTS
Enriched PTK6 expression is associated with tumor progression in vivo
We previously demonstrated that PTK6 is highly expressed in human breast carcinomas as compared to normal breast tissue and that PTK6 expression in the normal mouse mammary gland is HIF-dependent and induced following a single dose of GR agonist (dexamethasone; Dex). Similarly, PTK6 mRNA and protein is robustly induced following Dex treatment of primary human TNBC explants cultured ex vivo (32). Building on these observations, analysis of The Cancer Genome Atlas (TCGA) invasive breast cancer database (SurvExpress) (26) indicated that higher PTK6 expression is correlated with decreased survival in high-risk breast cancer patients (ER+ and ER- cases) (Figure 1A). SurvExpress risk groups are defined by estimating a prognostic index using the Cox model algorithm (27). We then analyzed PTK6 mRNA expression in ER-negative patients using KM Plotter tool restricted to the TCGA database and found that high PTK6 expression is also correlated with decreased overall survival in this patient cohort (Figure 1B).
Figure 1: Elevated PTK6 expression is correlated with lower overall survival of breast cancer patients and promotes cell motility, invasion and lung metastasis.

(A) SurvExpress was used to examine the prognostic index of patients in the TCGA Invasive Breast Cancer cohort (n = 502 samples) based on PTK6 expression. (B) Overall survival of ER-negative patients stratified on PTK6 mRNA expression using KM plotter (TCGA database, n = 1214 cases). (C) A high-throughput scratch wound assay was used to measure wound width over time (n=4 wells/genotype; data representative of three replicate experiments). (D) Transwell assays were used to chemoattract serum-starved HIF-1/HIF-2 double knockout (DKO) MDA-MB-231 cells to 10% FBS that were stably transfected with vector only (+Vector) or re-expressed PTK6 (+PTK6) to compare migration or cell invasion; bar graphs represent the grand mean ± SEM of three biological experiments; NS = not significant. (E) MDA-MB-231 HIF DKO + vector or HIF DKO + PTK6 cells were injected into the tail vein of 8-10-week old female NSG mice (n=6 DKO+ Vec; n=5 DKO +PTK6) and metastatic burden measured by densitometry analysis following immunostaining for an anti-human marker for pan-mitochondrial proteins (AbCam ab92824) with a hematoxylin counterstain. Whole immunostained lung sections representative of the mean percent positive area of metastasis are included. (F) A high-throughput scratch wound assay was used to compare the time elapsed to wound filling when a mixture of Cas9-deleted PTK6 KO cells are compared to parent or non-targeting control (NTC) gRNA transfected cells (n=4 wells/genotype; data representative of three replicate experiments). (G) Parent, NTC or PTK6 KO cells were bi-laterally injected in the mammary fat pad (n=8-9 mice/genotype) and tumor volume ± SEM compared over time. At experiment endpoint, tumors were excised and the tumor volumes ± SEM compared ex vivo (H). (I-J) MDA-MB-231 NTC or PTK6 KO (I) (n=10 mice/genotype) or parent + Vector or +PTK6 (J) (n=8 mice/genotype) cells were injected into the tail vein of 8-10-week old female NSG mice and the extent of metastatic colonization measured by densitometry analysis as described in (E). All metastasis data are expressed as ± SD; at least 5 animals/genotype were compared.
Patients with TNBC have the highest rate of recurrence and succumb to metastatic disease sooner post-diagnosis than ER+ patients (3,33). Metastasis occurs according to a series of sequential steps including local invasion, intravasation, survival in circulation, extravasation, and finally colonization, believed to be the rate-limiting step (34). We have shown PTK6 is required for survival in non-adherent conditions in TNBC cells (8) and that GR/HIF regulates cellular stress-dependent up-regulation of PTK6, such that loss of HIF-1 and HIF-2 significantly decreases PTK6 expression (9). To test the functional relevance of PTK6 expression in promoting invasion and colonization, MDA-MB-231 cells lacking HIF-1 and HIF-2 (HIF double knockout, DKO) and parent MDA-MB-231 cells were modified to over-express PTK6 (Supplemental Figures 2A–B). Forced expression of PTK6 in HIF DKO cells rescued wound healing defects observed for HIF DKO + Vector cells, however forced expression of PTK6 had no effect on HIF-intact parental cells (231 +Vector, Figure 1C). Add-back of PTK6 to HIF DKO cells did not impact basal migratory capacity stimulated by complete media in transwell assays. However, invasion through Matrigel was enhanced 2.7-fold (Figure 1D). When tested in an experimental metastasis tail vein assay, PTK6 expression enhanced colonization compared to HIF DKO + Vector cells (Figure 1E). To test the effects of loss of PTK6, we also generated an admixture of CRISPR-Cas9 deleted PTK6 knockout (KO) clones, to minimize clonal heterogeneity effects in vivo (Supplemental Figure 2C). Cells lacking PTK6 had minor, albeit statistically significant defects, in wound healing relative to either parent (non-transfected) MDA-MB-231 cells or cells transduced with a non-targeting control gRNA (NTC) (Figure 1F). We and others have reported only modest kinase-independent effects of PTK6 manipulation on cancer cell proliferation (8,19). Consistent with these findings, neither forced expression of PTK6 nor deletion of PTK6 affected cell proliferation in vitro (Supplemental Figure 2D–F). Next, parent, NTC or PTK6 KO cells were injected into the cleared, inguinal mammary gland to generate tumors. Consistently, there were no significant differences in mean tumor volume among all genotypes at the study endpoint (Figure 1G, H). In contrast, deletion of PTK6 reduced the area of lungs occupied by metastasis by ~2.3-fold (Figure 1I) whereas the over-expression of PTK6 more subtly enhanced lung metastatic burden (Figure 1J). Together, these results confirm the biological relevance of our PTK6 data mining observations since poor survival is typically driven by metastatic growth following onset of chemotherapeutic resistance. These data implicate a direct role for PTK6-mediated oncogenic signaling in TNBC cell invasion and lung colonization.
The PTK6 SH2 domain is critical for motility of TNBC cells
PTK6 is an important mediator of TNBC cell migration (8); however, the kinase domain is not required for migration (11), suggesting that other PTK6 domains related to its scaffolding actions are important. To elucidate the contribution of specific PTK6 domains, we stably re-expressed FLAG-tagged wild type (WT), kinase inactive (KM), constitutively active (C-terminal Y447 point-mutation to F447; YF), SH2 deleted (SH2-del), or SH3 deleted (SH3-del) PTK6 in previously characterized MDA-MB-231 PTK6 knock-out (KO) cells (8) (Figure 2A, B). We first performed soft agar assays using cells treated with EGF to stimulate anchorage-independent proliferation. PTK6 KO cells or cells expressing KM-PTK6 formed decreased numbers of colonies compared to cells expressing WT PTK6, indicating that PTK6 kinase activity contributes to anchorage-independent cell proliferation in this assay (Figure 2C). In contrast, deletion/inactivation of the other PTK6 domains had no effect on soft agar colony formation.
Figure 2: PTK6 SH2 domain is critical for TNBC motility.

(A) PTK6 domain structure schematic. (B) Western blot of MDA-MB-231 PTK6 KO cells re-expressing FLAG-tagged PTK6 domain mutant constructs. (C) Anchorage-independent growth was assessed in soft agar supplemented with EGF. (D) Transwell migration of MDA-MB-231 PTK6 domain mutants was examined in response to an HGF gradient (50 ng/mL). Data is shown as grand mean ± SD of n = 3 experiments with 3 replicate transwells each. Tumorsphere-forming assays were performed in domain mutant and the number (E) and size (F) were quantified. (G) PTK6 knockout models. Inset confirms knockout of PTK6 using CRISPR/Cas9n. Graphed data were analyzed by one-way ANOVA with multiple comparisons tests and are representative of n = 4 independent experimental repeats; *** p < 0.001.
We next examined TNBC motility by transwell migration using an HGF gradient. HGF, a chemokine produced by immune cells in the tumor microenvironment, stimulates cancer cell migration via activation of the Met receptor (35). MDA-MB-231 cells expressing SH2-del PTK6 failed to migrate, while KM-PTK6 cell motility was equal to that of cells expressing WT PTK6 (Figure 2D). Since PTK6 is important for TNBC survival in non-adherent conditions (8), we next examined growth of PTK6 domain mutant models in tumorsphere self-renewal assays (28). Sphere formation is a property of tumor cells with cancer stem cell (CSC)-like potential. Notably, clonal PTK6 KO cells formed fewer tumorspheres relative to cells expressing WT PTK6. These observations were also confirmed using pooled CRISPR/Cas9 PTK6 silenced (KO) MDA-MB-231 cells (Figure 2G) and in the PTK6 KO clonal admix MDA-MB-231 model as used in Figure 1 (Supplemental Figure 3A). Surprisingly however, SH2-del PTK6-expressing cells formed increased numbers of spheroids that were larger in size relative to cells expressing either WT, SH3-del, KM, or YF PTK6 (Figure 2E, F). Notably, inactivation of the kinase domain reduced both colony number and tumorsphere size (Figure 2F, Supplemental Figure 3B). Together, these data suggest that the PTK6 SH2 domain, rather than the kinase domain, is most critical to TNBC motility, but that this domain also negatively regulates tumorsphere formation.
PTK6 SH2-dependent signaling pathways in TNBC
To identify relevant signaling pathways in TNBC cells expressing WT, KM, or SH2-del PTK6, we performed a reverse phase protein array (RPPA) screen. A panel of 296 antibodies was used to profile and compare global changes in total protein content as well as specific posttranslational modifications in response to HGF since HGF (i.e. MET receptor signaling) activates PTK6 (11) and, as mentioned above, initiates motility signaling pathways in cancer cells leading to enhanced migration. Supervised hierarchical clustering revealed a distinct cluster of proteins that are differentially expressed in WT compared to SH2-del PTK6 expressing cells (Figure 3A; bottom box, solid line), while some proteins remain unchanged (Figure 3A; top box, broken line). Unsupervised clustering of protein expression data revealed that SH2-del PTK6 expressing cells segregated independently from both WT and KM PTK6 cells, suggesting that disruption of SH2 domain-mediated signaling has a stronger effect on activation of the well-characterized signaling proteins represented on the array than loss of PTK6 kinase activity (Figure 3B). To identify changes in signaling pathways, we identified total and phosphorylated proteins that were determined to be PTK6-dependent by their absence in PTK6 KO samples. These proteins were then profiled for changes between the SH2-del and WT PTK6 samples (Table 1) followed by Ingenuity Pathway Analysis (IPA) to identify both vehicle and HGF-stimulated pathways. The top down-regulated (i.e. decreased/absent in SH2-del models) pathway was AhR signaling (Table 1). Notably, RhoGDI signaling was increased in SH2-del PTK6 expressing cells (Table 1). The GDP dissociation inhibitors of Rho proteins (RhoGDI) are a family of proteins that sequester motility effector Rho GTPases in the cytoplasm, thus preventing their activation at the membrane (36). IPA also revealed a modest increase in p38 MAPK signaling in SH2-del PTK6 expressing cells (Table 1). Together, these data suggest that the PTK6 SH2 domain could regulate oncogenic signaling in TNBC via AhR, Rho GTPases, and/or p38 MAPK. We therefore performed subsequent studies to explore the functional effect of these signaling pathways in PTK6 SH2-del TNBC cells.
Figure 3: SH2-dependent pathways in MDA-MB-231 cells.
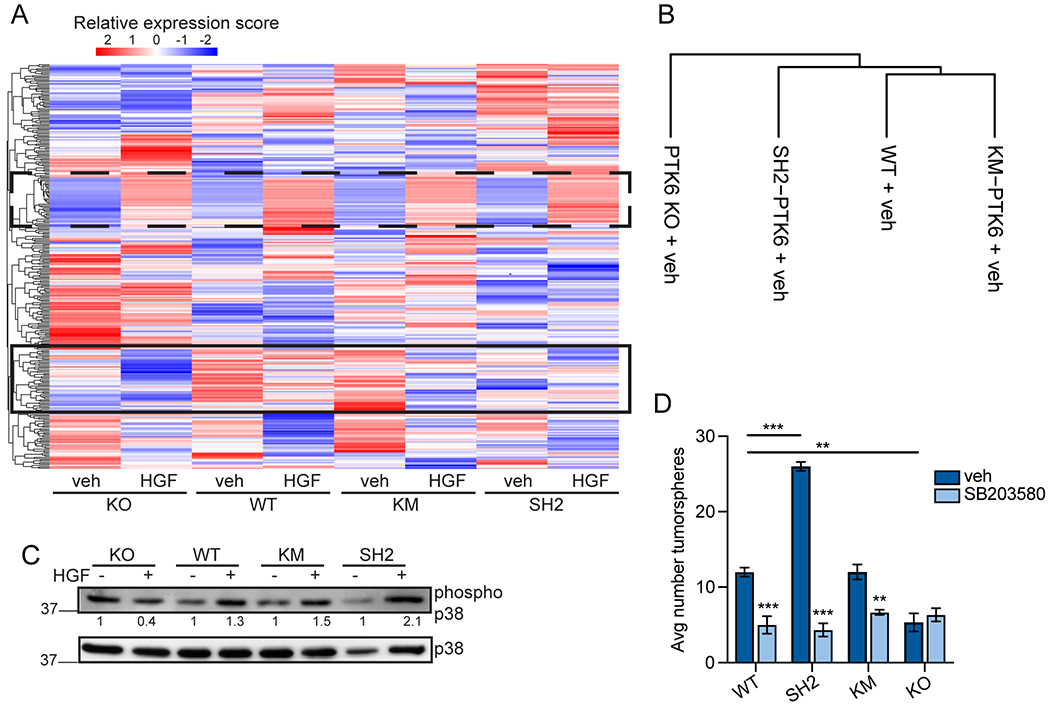
(A) Heatmap by unsupervised consensus clustering of protein lysates analyzed for protein expression by RPPA. Broken line box indicates protein staining intensities unchanged between samples. Solid line box highlights RPPA intensities that appear different in SH2-del PTK6 expressing cells. (B) Supervised clustering dendrogram of samples. (C) Immunoblot analysis of p38 MAPK activation by HGF (50 ng/mL). Phospho-p38 densitometry (indicated underneath) was calculated by first normalizing to total p38 MAPK, then calculating fold change over vehicle for each cell line. Data is representative of n = 3 independent repeats. (D) Primary tumorsphere assays in MDA-MB-231 PTK6 domain mutant models. Cells were treated with DMSO (vehicle) or SB203580 (10 mM) for 7 days. Data were analyzed by one-way ANOVA with posthoc corrections (n = 3); *** p < 0.001, ** p < 0.01.
Table 1.
PTK6 dependent pathways (i.e. lost in PTK6 KO cells) were examined in PTK SH2-del expressing MDA-MB-231 cells. IPA was performed for these pathways in WT vs SH2-del models. Top significant canonical pathways are listed.
| Vehicle |
||
|---|---|---|
| Pathway | z-score | log p-value |
| AhR Signaling | −2.4 | 17.4 |
| p38 MAPK Signaling | 1.134 | 5.18 |
| ERK/MAPK Signaling | 1.219 | 32.8 |
| HGF |
||
| Pathway | z-score | log p-value |
| RhoGDI Signaling | 2.7 | 5.41 |
| Wnt/b-catenin Signaling | 1 | 8.21 |
| p38 MAPK Signaling | 1.134 | 5.18 |
PTK6 SH2 domain mediates p38 MAPK signaling in TNBC cells
To confirm IPA results that p38 MAPK signaling is upregulated in SH2-del PTK6 breast cancer cells, we used immunoblotting to examine p38 phosphorylation induced by exposure to HGF. Densitometry analysis showed that phospho-p38 was increased in SH2-del PTK6 TNBC cells (Figure 3C). The p38 MAPK pathway is a canonical stress pathway, and because growth in suspension mimics a stressful condition for epithelial cells, we again grew PTK6 domain mutant cells in forced suspension using tumorsphere conditions. Inhibition of p38 MAPK with SB203580 dramatically reversed the growth advantage in SH2-del PTK6 MDA-MB-231 cells cultured in suspension (Figure 3D). These findings suggest that while PTK6 clearly contributes to tumorsphere growth (Figure 2E), the SH2 domain of intact PTK6 limits the cellular stress-induced activation of p38 MAPK signaling associated with stemness properties in TNBC cells.
PTK6 SH2 domain mediates Rho activation in TNBC cells
Given that IPA analysis suggested decreased Rho activation in PTK6 KO and SH2-del PTK6 expressing cells, we performed pull-down assays in HGF-stimulated MDA-MB-231 cells expressing either WT or SH2-del PTK6 in order to observe changes in Rho activation. RhoA was strongly activated by HGF in WT PTK6 TNBC cells (Figure 4A). In contrast, RhoA was not activated in SH2-del PTK6 cells after HGF stimulation (Figure 4A). This result is supported by decreased migration of SH2-del PTK6 expressing cells, and suggests that the PTK6 SH2 domain is required for activation of RhoA. We then confirmed that RhoA was expressed in two conventional TNBC cell lines (MDA-MB-231 and Hs578T) and in a TNBC taxane-refractory cell line isolated from patient-derived xenograft (PDX) model, cHCI-10 (Figure 4B) (29). We next used a Rho-specific inhibitor to assay migration potential in a panel of TNBC cells. Consistent with Rho pull-down results, transwell migration to HGF was significantly decreased in all Rho-inhibited cells (Figure 4C). In contrast, RhoA inhibition did not alter soft agar colony number (Figure 4D) or size (not shown) of MDA-MB-231 cells expressing either WT PTK6 or SH2-del PTK6. Co-immunoprecipitation assays failed to detect a direct association of PTK6 with Rho in unmodified TNBC cell models (data not shown). Together, these data suggest that PTK6 is an important upstream regulator of RhoA via its SH2 domain; negative co-immunoprecipitation data suggest that this may occur via an indirect mechanism.
Figure 4: PTK6 SH2 domain is required for RhoA activation.
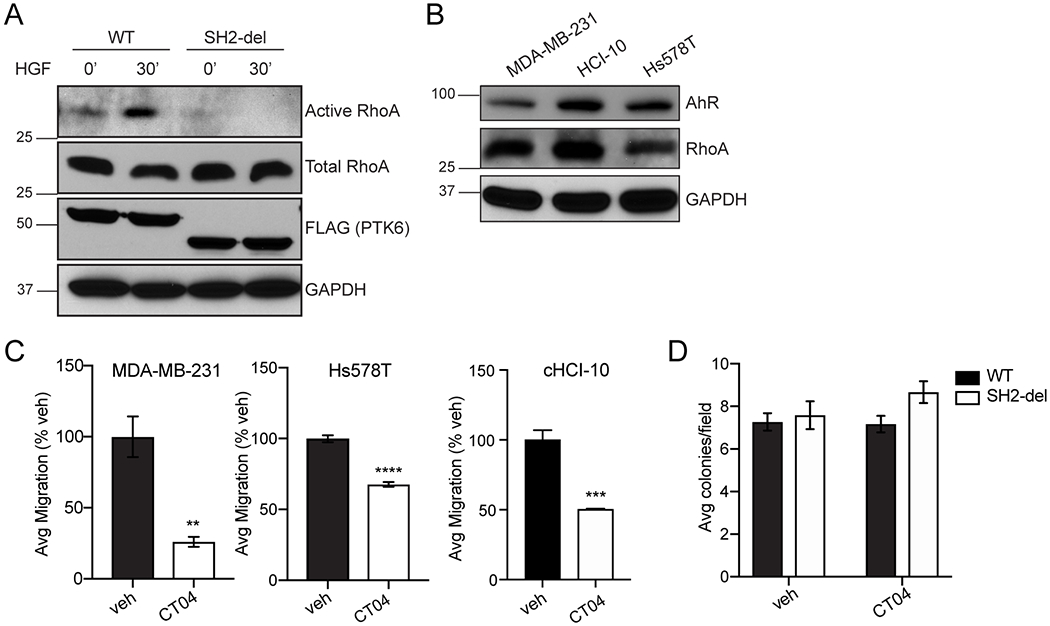
(A) RhoA activation assay using GST-Rhotekin-RBD pull down in MDA-MB-231 cells expressing WT or SH2-del PTK6. (B) Expression of Rho and AhR was examined in a panel of TNBC models by immunoblotting. (C) Rho inhibition by CT04 (1 μg/mL) in a panel of TNBC cell lines. Transwell migration (MDA-MB-231 and Hs578T) was stimulated by HGF (50 ng/mL). Significance was determined by one-way ANOVA with multiple comparisons testing; ** p < 0.01, *** p < 0.001. (D) Soft agar colony formation of WT and SH2-del PTK6 expressing cells in the presence of Rho inhibitor CT04 (1 μg/mL). Graphed data are representative of at least n = 3 independent replicates.
Rho inhibition sensitizes TNBC cells to paclitaxel
Since PTK6 mediates Taxol (paclitaxel) chemoresistance (8), we next determined if Rho or AhR inhibitors (CT04 and CH223191, respectively) also mediate cell growth inhibition in combination with paclitaxel in MDA-MB-231 or cHCI-10 PDX cells, which are refractory to paclitaxel (29). The IC30 and IC50 doses ± SEM for each drug are summarized in Table 2. IC values for the Rho inhibitor, CT04, could not be determined for MDA-MB-231 cells since only the 1 μg/mL dose of CT04 exposure significantly inhibited cell growth by the assay endpoint of 96 h (Supplemental Figure 4A); the same dose (1μg/mL) was used in migration assays (Figures 3–4). Example dose-dependent effects of each drug on growth inhibition are shown in Supplemental Figure 4A–D.
Table 2.
Calculated IC30 and IC50 doses of paclitaxel (Taxol), CT04 or CH223191 in paclitaxel-sensitive MDA-MB-231 and paclitaxel-refractory cHCI-10 TNBC cells as determined in Prism 8.0 using a best-fit algorithm (the log of inhibitor versus normalized response model). Data are shown as the grand mean IC value ± SEM calculated from at least three independent biological replicate experiments. The IC values were not determined (N.D.) in MDA-MB-231 cells for CT04 since there was minimal effect of CT04 on growth inhibition up to a 1 μg/mL dose (refer to Supplemental Figure S4).
| DRUG | cHCI-10 IC30 | cHCI-10 IC50 | MDA-MB-231 IC30 | MDA-MB-231 IC50 |
|---|---|---|---|---|
| TAXOL | 80.49 ± 15.86 nM | 188.00 ± 37.90 nM | 4.22 ± 1.80 nM | 9.87 ± 4.19 nM |
| CH223191 | 11.51 ± 3.22 μM | 26.17 ± 6.76 μM | 6.85 ± 1.16 μM | 12.05 ±− 1.62 μM |
| CT04 | 3.76 ± 0.81 nM | 8.81 ± 1.84 nM | N.D. | N.D. |
| (0.009 ± 0.02 μg/ml) | (0.22 ± 0.05 μg/ml) |
| Taxol + CT04 0.1μg/ml in cHCI-10 cells | |||
|---|---|---|---|
| IC | [CT04 μg/ml] | [Taxol nM] | CI |
| 30 | 0.1 | 24 | 1.12 |
| 50 | 0.1 | 57.97 | 0.59 |
| 70 | 0.1 | 134.9 | 0.38 |
| Taxol + 8μM CH223191 in cHCI-10 cells | |||
|---|---|---|---|
| IC | [CH223191, μM] | [Taxol, nM] | CI |
| 30 | 8 | 81.3 | 2.15 |
| 50 | 8 | 189.4 | 1.33 |
| 70 | 8 | 436.5 | 0.97 |
| Taxol + CT04 1μg/ml in MDA-MB-231 cells | |||
|---|---|---|---|
| IC | [CT04, μg/ml] | [Taxol, nM] | CI |
| 30 | 1 | 2 | 1.99 |
| 50 | 1 | 5.6 | 0.51 |
| 70 | 1 | 134.9 | <1* |
| COMBINATION (TAXOL +5 μM CH223191) | |||
|---|---|---|---|
| IC | [CH223191, μM] | [Taxol, nM] | CI |
| 30 | 5 | 3.98 | 1.06 |
| 50 | 5 | 209.5 | 1.04 |
| 70 | 5 | 346.7 | 1.01 |
Calculated IC50 values as determined by the best-fit regression model in Prism 8.0, using either the either the log of inhibitor versus normalized response model. The SEM was calculated from a minimum of three independent biological replicate experiments.
At the tested dose range, CT04 did not inhibit growth above 50% relative to t=0, so an IC70 cannot technically be calculated for the tested dose range of CT04. However, the combination IC70 was 2.5 fold lower than for Taxol alone at 350 nM, suggesting synergism.
We next performed isobole testing using the Loewe additivity formula to determine a combination index (CI) for growth inhibition. In MDA-MB-231 cells, CT04 (1 μg/mL) was paired with increasing doses of paclitaxel, which induced a synergistic repression of cell growth, producing a combination index (CI) of 0.51; data are shown in the presence of 5 nM Taxol (Figure 5A) (37). In contrast, there was no additive benefit in MDA-MB-231 cells of enhancing inhibition of cell growth when CH223191 (2.5 μM) was added to increasing doses of Taxol. The growth curve of combination therapy overlapped with the curve of Taxol alone; data shown are in the presence of 5 nM Taxol (Figure 5B).
Figure 5: Pairing CT04 with Taxol is synergistic in TNBC models.

(A-D). Tumor cell growth was measured over time using the IncuCyte S3 live-cell imager as described in the materials and methods. Holding either CT04 or CH223191 constant near each cell line’s specific IC50 value, increasing concentrations of Taxol (paclitaxel) were added to the cells and the change in the growth ratio relative to time after drug was added (t = 0) was plotted over time (hours). All data are shown as the mean ± SEM for technical replicates at each time point; each line graph shown is representative of at least 3 independent experiments. # indicate significant differences in the growth ratio among treatments.
In taxane-refractory cHCI-10 cells, when cells were exposed to 0.1 μg/mL CT04 and to increasing concentrations of Taxol, CT04 strongly synergized with Taxol. A combination index of 0.59 was calculated; data shown are in the presence of 75 nM Taxol (Figure 5C). In contrast, the AhR inhibitor, CH223191, was more effective as a single agent (5 or 10 μM) in cHCI-10 cells as compared to either Taxol alone or when paired with Taxol (Figure 5D). When CH223191 was held constant (8 μM), treatment with Taxol produced either neutral (CI close to 1.0) or antagonistic effects (CI>1.0) in a dose-dependent manner. For example, when Taxol levels were lowered from 190 nM to 80 nM, the CI value increased from 1.33 to 2.15, whereas the CI was calculated to be 0.91 at a dose of 440 nM Taxol. Near the IC50 value of Taxol (75 nM) for cHCI-10 cells, there was no benefit of adding CH223191; data shown are in the presence of 75 nM Taxol (Figure 5D). Therefore, treatment of cHCI-10 cells with the Rho inhibitor (CT04) appeared to restore sensitivity to paclitaxel, but there was no benefit to adding CH223191 to a Taxol regimen in the cHCI-10 TNBC model. However, these results suggest that TNBC patients who progress on taxanes like Taxol may remain sensitive to AhR inhibition as a monotherapy.
AhR/PTK6 association via the PTK6 SH2 domain is required for TNBC motility
We next sought to delineate the mechanism underpinning the observed loss of AhR signaling in SH2-del PTK6 cells. Further analysis of AhR-regulated signaling molecules from our RPPA dataset revealed a number of differentially regulated proteins (Figure 6A, purple box) including cyclin D1, cyclin E1, and phospho-p65 NF-KB. These proteins have been implicated in cell motility and adhesion (38–40), as well as cell cycle regulation (41,42). AhR has traditionally been studied as a regulator of environmental toxins and carcinogens (43,44). AhR is well-known to partner with the aryl hydrocarbon receptor nuclear translocator (ARNT), which is also the obligated heterodimeric partner of HIF-1α and HIF-2α to form the HIF-1 or HIF-2 transcription factors. More recently, AhR has been implicated in epithelial cell survival, promotion of epithelial to mesenchymal transition (EMT), and motility (45–47). Additionally, AhR has been reported to contain phosphotyrosine motifs (48). We showed previously that HGF stimulates PTK6 auto-phosphorylation on tyrosine and kinase activation. Therefore, the presence of co-immunoprecipitated PTK6 and AhR was examined in HGF-treated WT and SH2-del PTK6 expressing MDA-MB-231 cells by immunoblotting. Whereas AhR strongly associated with WT PTK6 independent of HGF stimulation, its association with SH2-del PTK6 was diminished to background levels upon HGF stimulation (Figure 6B). These data suggest that the PTK6 SH2-domain is needed to support sustained PTK6/AhR interaction when PTK6 is autophosphorylated/activated.
Figure 6: AhR activity requires PTK6 SH2 domain.

(A) Unsupervised heatmap of RPPA dataset identified by IPA “AhR Signaling”. (B) MDA-MB-231 cells expressing WT or SH2-del PTK6 were starved and treated with veh or HGF (50 ng/mL; 30 min). AhR-containing complexes were isolated using AhR-specific antibodies and protein G-agarose beads. Western blots were performed on immunocomplexes and whole-cell lysates (FL; full length). Representative blot of n = 3 experimental repeats are shown. (C) TNBC migration was examined with AhR inhibitor CH223191 (10 μM). Data were analyzed by Student’s t-test for significance; ** p < 0.01, *** p < 0.001 (n = 4). (D) Colony formation with AhR inhibitor CH223191 (10 μM). Data was analyzed by two-way ANOVA with post-hoc corrections; *** p < 0.001 (n = 3). (E) HGF-induced transwell migration in the presence of AhR inhibitor CH223191. Data was analyzed by two-way ANOVA with post-hoc corrections; *** p < 0.001, ** p < 0.01 (n = 3). (F) mRNA levels of AhR and canonical target genes CYP1A1 and CYP1B1 in MDA-MB-231 cells stably expressing WT or SH2-del PTK6. Data was analyzed by Student’s t-test; * p < 0.05 (n = 3). (G) Recruitment of AhR to the CYP1B1 promoter region was examined by ChIP-PCR. Data are shown as fold recruitment over vehicle control of combined n = 3 experiments. In parallel, CYP1B1 mRNA expression was analyzed by qRT-PCR. Two-way ANOVA with post-hoc corrections was used to test significance; * p < 0.05, ** p < 0.01, *** p < 0.001.
We next turned to AhR antagonism (CH223191) in a panel of TNBC models that expressed AhR (Figure 4B) and discovered that AhR inhibition reduced HGF-directed TNBC cell migration in transwell assays (Figure 6C). Surprisingly, AhR inhibition decreased both anchorage independent colony formation and growth factor-stimulated migration of WT and SH2-del PTK6 (Figure 6D,E). However, as shown in Figure 2C, there was no difference in proliferation/survival as measured by soft agar colony formation. Given that migration assays were performed over the course of 24 h, it is unlikely that the effect on TNBC migration is due to inhibition of the cell cycle. These data indicate that a sustained AhR/PTK6 interaction mediated by the PTK6 SH2 domain contributes to TNBC motility and soft agar growth. However, AhR also appears to regulate these biologies independently of the PTK6 SH2 domain.
Phosphorylation of AhR tyrosine 9 residue is required for DNA binding (48). To investigate whether AhR target gene expression is impacted in SH2-del PTK6 cells, we performed qRT-PCR for two AhR target genes CYP1A1 and CYP1B1, two extrahepatic enzymes responsible for metabolism of drugs, carcinogens, and endogenous compounds (45,47). Interestingly, although AhR mRNA itself was unchanged, CYP1A1 and CYP1B1 expression was significantly reduced in SH2-del PTK6 MDA-MB-231 cells (Figure 6F). To examine AhR recruitment to CYP1B1 promoter regions, we conducted ChIP assays in WT and SH2-del PTK6 MDA-MB-231 cells. Robust recruitment of AhR to the CYP1B1 promoter site was observed with HGF stimulation in both WT and KM PTK6 cells (Figure 6G). However, AhR recruitment was strikingly reduced in SH2-del PTK6 cells (Figure 6G) indicating that the PTK6 SH2 domain, and not its kinase activity, is required for AhR localization to CYP1B1 DNA. Changes in AhR recruitment were reflected in CYP1B1 mRNA expression (Figure 6G). These data support a novel role for PTK6 in the transcription of AhR target genes, a topic for future study.
AhR and PTK6 co-expression are associated with poor prognosis
On the basis of our findings that AhR plays an important role in both TNBC motility and colony formation, we next examined whether this is recapitulated in patient specimens following isolation of primary organoids from human breast ER negative tumor samples. Three-dimensional epithelial organoid cultures are representative of central breast cancer features and facilitate high-throughput drug screening (49). We first performed qRT-PCR on organoids derived from both normal and malignant ER-tissues to determine whether AhR expression was altered. Indeed, we found that AHR mRNA levels were increased in tumor-derived organoids compared to organoids from normal breast tissue (Figure 7A). Consistent with previous reports, PTK6 transcript levels were also higher in tumor samples than normal tissue (Figure 7B) (10). We next examined tumor-derived organoid invasion into a Matrigel/Collagen I matrix and found that CH223919 reduced organoid branching (Figure 7C). To investigate the relationship between AhR, PTK6, and GR (known to induce PTK6 transcription) in the context of patient outcomes, we employed the SurvExpress (26) tool to analyze survival data using publicly available datasets. Interestingly, co-expression of PTK6, AhR, and GR correlated with a decrease in relapse-free and distant metastasis-free survival (Figure 7D), while AhR or GR expression alone did not correlate with patient outcome (Supplemental Figure 5). These data demonstrate that the relationship between AhR and PTK6 and metastatic burden is not limited to our cell line models, but also extends to human tumor samples, suggesting that targeting AhR in PTK6+ TNBC may be useful in the treatment of stage IV metastatic disease. In summary, our data indicate that in TNBC GR/HIF-induction of PTK6 results in a feed-forward signaling cascade dependent on PTK6 SH2 domain-mediated activation of AhR and Rho pathways, leading to increased cell migration, whereas synergy with Taxol/paclitaxel chemotherapy was observed upon inhibition of Rho (CT04), but not AhR (CH223191) in the TNBC models tested (Figure 7E).
Figure 7: AhR and PTK6 expression promote aggressive breast cancer phenotypes.

(A) AhR and (B) PTK6 mRNA expression was analyzed in organoids isolated from ER-negative human breast tumor samples or normal adjacent tissue. Data were analyzed by Student’s t-test; * p < 0.05. Data represents the mean ± SD (n = 2 patient samples). (C) Organoids were grown from human malignant tissue and treated with vehicle or CH223191 (10 μM) in duplicate wells. Representative images of two separate experiments are shown. Branching organoids were quantified by manual counting in ImageJ (n = >5 organoids fields/sample) and expressed as a percentage of total organoid number. Significance was determined by Student’s t-test; * p < 0.05. (D) SurvExpress was used to stratify recurrence-free survival (left) and distant metastasis free survival (right) based on median expression of PTK6, AhR, and GR (NR3C1) across all breast cancer subtypes. (E) A representative cartoon model of the oncogenic activities of PTK6 in TNBC. PTK6 expression is regulated by the AhR/GR/HIFs transcriptional complex [8, 9, 26]. In turn, PKT6 is a key signaling node of HGF-mediated oncogenic signaling in TNBC. Specifically, the SH2 domain of PTK6 is integral in the regulation of both RhoA and p38 MAPK. As shown, deletion of the SH2 domain, promotes tumorsphere formation via activation of the p38 MAPK. However, deletion of the SH2 domain decreased RhoA and AhR oncogenic activity in our TNBC models (i.e. cellular migration, cellular growth and resistance to Taxol chemotherapy).
DISCUSSION
Herein, we have generated PTK6 KO, kinase-dead, and SH2 or SH3 domain deletion-specific cell lines in order to dissect the roles of the different functional domains of PTK6 and their actions in breast cancer. We previously showed that PTK6 is directly regulated by the HIF transcription factors. Our studies clearly show that PTK6 expression negatively correlates with overall survival and that re-expression of PTK6 in the context of HIF DKO cells rescues cell motility, invasion and lung metastasis (Figure 1). Consistent with prior observations that PTK6 is not a robust mediator of cell proliferation, deletion of PTK6 did not impact primary tumor growth or endpoint tumor size. In contrast, deletion of PTK6 strongly represses lung metastasis in a tail vein assay, whereas the forced expression of PTK6 slightly enhances lung metastasis. Using a variety of PTK6 domain mutants, we now show that the kinase domain of PTK6 is dispensable for TNBC migration and tumorsphere formation and that these activities are instead regulated by the SH2-domain of PTK6 (Figure 2). Additionally, we report that the SH2-domain of PTK6 is essential for the HGF-induced activation of RhoA (Figure 4 and Table 1) and is strongly associated with AhR binding to phosphorylated/activated PTK6 (Figure 6). The SH2 domain is known to bind substrate phosphotyrosine motifs; these scaffolding actions appear to be central to execution of PTK6-mediated CSC phenotypes and to cell migration in TNBC cells. Together, our results indicate PTK6 acts as a key hub/integrator of oncogenic signaling pathways for these biological activities. This conclusion is supported by our RPPA studies, which confirmed the regulation of distinct cellular signaling pathways by either the PTK6 kinase domain, which impacted proliferation/survival, relative to the PTK6 SH2 domain, which mediates migration potential and stemness properties.
Specifically, we observed that deletion of the SH2 domain promoted tumorsphere formation but decreased chemotactic migration of TNBC cells. This dichotomy reflects the complexity of PTK6 signaling in cancer and highlights the need to dissect downstream signaling mechanisms to inform rational drug design. For example, domain-based blocking strategies to prevent interaction of PTK6 and its substrates via the SH2 domain may block cell migration while also enhancing stemness. Our data show that increased tumorsphere formation occurs concomitant with an increase in p38 MAPK, which was blocked by the addition of a MAPK inhibitor (Figure 3). The PTK6 SH2 domain mediates substrate interactions that are weaker than those of c-Src, and, therefore, were thought to be primarily responsible for regulating catalytic activity (24). It is therefore possible that removal of the SH2 domain also alters PTK6 kinase activity. However, mutation of the C-terminal Y447 residue, which results in a constitutively active PTK6 protein, did not mimic SH2-del biology (Figure 2). Furthermore, p38 phosphorylation was increased in SH2-del PTK6 expressing TNBC cells. Along with our results showing that WT and kinase-dead (KM) PTK6+ cancer cell behaviors are indistinct in the context of migration and tumorsphere formation (Figure 2), we can conclude that the SH2 domain is primarily responsible for mediating PTK6 oncogenic signaling. This novel observation is highly relevant to PTK6 drug design as previous efforts have focused on targeting PTK6 kinase activity (19). Moreover, our data suggest that targeting the PTK6 SH2 domain specifically, or PTK6 SH2-mediated effectors, would benefit patients by repressing activities associated with metastasis rather than bulk tumor cell growth.
Therapeutic strategies targeting PTK6 to date have largely focused on targeting the kinase domain with small molecule inhibitors that recognize the ATP-binding pocket of the kinase domain (50). While PTK6 kinase inhibition appears useful in colon cancer models, this strategy failed to decrease tumorigenesis in vitro in either luminal and TNBC models of breast cancer (19,51), stalling their progress to successful clinical trials. To our knowledge PTK6 SH2 domain-specific inhibitors do not yet exist. Lack of chemical inhibitors to this domain is likely due to the challenging nature of designing such inhibitors to large non-enzyme domains (52). However, our data clearly demonstrate that inhibition of two downstream effectors of PTK6 that are mediated by the SH2 domain (RhoA, AhR) are effective in decreasing PTK6 oncogenic activity in TNBC. However, since CT04 (RhoA inhibitor) is a ~24 kDa protein, targeting AhR via the small molecular inhibitor CH223191 may be more amenable for future pre-clinical studies in rodents as an anti-metastatic agent. In paclitaxel-sensitive MDA-MB-231 cells and in paclitaxel-refractory cHCI-10 PDX cells, CT04 was synergistic with Taxol, suggesting that adding a Rho inhibitor to a Taxol regimen may benefit patients who are progressing on taxanes alone. These data also demonstrate that PTK6-mediated chemoresistance to Taxol in cHCI-10 cells can be reversed by co-treatment with Taxol and a Rho inhibitor. In contrast, CH223191 did not enhance Taxol-induced growth inhibition in MDA-MB-231 cells and it was neutral or slightly antagonistic to Taxol in the cHCI-10 model. Interestingly, CH223191 alone inhibited cHCI-10 cell growth, suggesting its use as a monotherapy in taxane-resistant patients may be beneficial. Even if CH223191 is not additive to Taxol to enhance tumor cell growth inhibition, it clearly represses cell motility and invasion, at least in vitro. Additional studies are required to validate PTK6 and GR as valuable biomarkers that may predict Rho or AhR inhibition response in combination with Taxol, or other cytotoxic agents, in TNBC. PTK6 has been shown to directly bind to and activate Rac1 GTPase in luminal breast cancer models (10,12,53). Our RPPA data identified increased RhoGDI signaling in SH2-del expressing TNBC cells (Table 1). Here, we demonstrate that the PTK6 SH2 domain is required for the activation of RhoA in TNBC cell lines (Figure 6). These data suggest that the PTK6 SH2-domain is critical for RhoA-signaling mediation of motility in TNBC. However, no direct protein interactions were found between RhoA and PTK6 in TNBC cells. It is possible that PTK6 interacts with RhoGDIs instead of directly interacting with RhoA through the SH2-domain since proteomic analyses have identified RhoGDI as tyrosine-phosphorylated proteins in cancer cells (54). In addition, the mechanism by which RhoGDIs negatively regulate Rho GTPases remains largely undefined. Taken in the context of our current data, it is feasible that PTK6 interaction with RhoGDIs via the SH2 domain alters RhoA activation. Alternatively, PTK6 activation of RhoA may occur via paxillin phosphorylation as was reported previously for Rac1 (55). Further studies are needed to dissect the role of PTK6 in the activation of the Rho pathway.
Similarly, another candidate pathway that is regulated downstream of engagement with PTK6, in part via the SH2 domain, is the stress kinase p38 MAPK, which has been implicated in EMT, a process resembling stemness in cancer cells (56,57). MAPK activation occurs after dual phosphorylation of their Thr-Gly-Tyrosine motifs by upstream MEK (MAP kinase kinase) family members (58). Notably, PTK6 expression was previously shown to amplify EGF-stimulated p38-driven pro-survival phenotypes, and mammary gland-specific expression of PTK6 in WAP-PTK6 transgenic mice resulted in greatly elevated p38 MAPK activity in mammary tissues, delayed involution, and latent mammary tumor formation (13). These findings support our data showing that inhibition of p38 MAPK decreased PTK6-induced TNBC cell growth in suspension. Conversely however, our data show that loss of the PTK6 SH2 domain increases p38 phosphorylation. Taken together, these results suggest that PTK6 activates p38 MAPK via other PTK6 domains and that this activity is further elevated upon deletion of the SH2 domain. Consistent with this hypothesis, the PTK6 SH2 domain may regulate p38 MAPK signaling by modulating protein-tyrosine phosphatase (PTP) activity. PTP enzymes are themselves phosphorylated on tyrosine residues, providing binding sites for SH2-containing proteins (53). Alternatively, access to downstream effector pathways may be altered upon loss of the PTK6 SH2 domain (i.e. via altered competition for PTK6 binding), thereby favoring activation of the p38 pathway via the PTK6 kinase or SH3 domains. Further studies are required to elucidate the complex mechanisms of PTK6-mediated activation/inactivation of p38 MAPK and regulation of cancer cell stem-like properties. Mortality in breast cancer patients is due to metastatic disease that evades treatment, not primary tumor growth. We propose that even though PTK6 is not critical for cell proliferation, the role of PTK6 to enable metastasis programming via activation of cell motility, chemotactic migration, stemness and colonization via the p38 MAPK pathway is of importance for the breast cancer field.
Pathway analysis of RPPA antibody intensity data also nominated AhR signaling as a critical signaling pathway downstream of the PTK6 SH2 domain. We find that AhR inhibition reduces both TNBC cell motility and chemotaxis-mediated migration (Figure 6C, 6D). We were surprised to note that when PTK6 and AhR were unable to interact in SH2-del PTK6 expressing cells, AhR target gene expression was also disrupted (Figure 6B, 6E), implicating PTK6 in AhR-dependent regulation of transcription. In support of this, the AhR phospho-tyrosine 9 motif was shown to be critical for AhR transcriptional activity (48). AhR target genes CYP1A1 and CYP1B1 are members of the CYP450 enzyme family and are responsible for the metabolism of polycyclic aromatic hydrocarbons found in both endogenous and exogenous compounds (59). Furthermore, these enzymes are known to be involved in carcinogenesis via production of carcinogenic metabolites (45). Increased levels of these enzymes are found in colon, bladder, and breast cancer (60,61). Interestingly, PTK6 and AhR are both overexpressed in colon and bladder cancers (62–64), indicating that this phenomenon is not exclusive to breast neoplasia. GR has also been implicated in bladder and colon cancer (55); recent literature linking AhR signaling with GR in hypoxic conditions suggests that GR-regulated HIF-1α dimerizes with ARNT (65,66) leading to cross-talk between the AhR/ARNT and GR/HIF pathways. Furthermore, activation of GR with glucocorticoids was shown to promote breast cancer metastasis (67). Taken in the context of our previous data reporting hypoxia-induced PTK6 expression (9) and the results described herein, we suggest that PTK6 simultaneously orchestrates GR and AhR signaling pathways to promote disease progression and overall poor prognosis in these patients (Figure 7) (9,55). The interdependence of these molecules may mediate a sustained signaling response, resulting in tumor cell dissemination and survival in circulation.
Our data show that PTK6 kinase activity is important for TNBC survival in soft agar while the SH2 domain regulates migration. Surprisingly, AhR inhibition effects both biologies and also impacts AhR recruitment to DNA and target gene expression (Figure 6). This suggests divergent roles for PTK6 on AhR (kinase-related vs transcriptional) that differentially regulate downstream signaling. Further studies are warranted to address the possibility that PTK6 is a critical co-factor of AhR transcription.
In conclusion, we propose that inhibition of PTK6 should not be limited to targeting the PTK6 kinase domain, but should also target the PTK6 SH2-domain, which would coordinate anti-metastatic/anti-stemness biological activities. Our data show that Rho or AhR inhibition reduces both TNBC motility and soft agar growth in vitro. Targeting PTK6 via these SH2 domain interactors could increase overall survival and decrease metastatic spread in TNBC patients, which warrants further investigation. Despite our results that implicate Rho and p38 MAPK as important effector proteins of PTK6, targeting these ubiquitous proteins clinically will be challenging and will require targeting their effector proteins for clinical efficacy (49,68,69). Conversely, AhR is an attractive targetable mediator of carcinogenesis/transformation of epithelial cells (70). As a ligand-activated transcription factor and nuclear receptor, useful small molecule receptor antagonists to AhR would need to be pharmacologically optimized for future use in pre-clinical studies aimed at treating breast and other PTK6+ cancers (71).
Supplementary Material
Implications.
The SH2-domain of PTK6 is a potent effector of advanced cancer phenotypes in TNBC via RhoA and AhR, identified herein as novel therapeutic targets in PTK6+ breast tumors.
ACKNOWLEDGEMENTS
We are grateful to MD Anderson RPPA Core Facility. We thank Dr. Thu H. Truong for her critical reading of this manuscript. We thank Alana Welm for sharing her PDX models and for graciously performing gene expression analysis of cHCI-10 cells to authenticate their origin. All paraffin-embedded tissue sections were prepared in the UTHSC Research Histology Core. We thank Dr. Radhika Sekhri for digitally scanning stained tissue slides and for providing access to the quantification software housed in the Department of Pathology at UTHSC. The UTHSC Center for Cancer Research provided the IncuCyte S3 shared instrumentation. This research received patient specimen procurement assistance from the University of Minnesota’s Biorepository and Laboratory Services program and was supported by the National Institutes of Health’s National Center for Advancing Translational Services, grant UL1TR002494. This work was supported by the NIH grants R01 CA159712 (C.A.L), R01 CA138488 and Dept. of Defense BC150640 (T.N.S), F30CA228261, T32CA009138 (C.P.K), and NIH’s National Center for Advancing Translational Sciences, grant UL1TR002494 (A.R.D and C.P.K). The content is solely the responsibility of the authors and does not necessarily represent the official views of the National Institutes of Health’s National Center for Advancing Translational Sciences. Author B.A.S. was previously supported by an NIH NIAMS T32AR050938 Musculoskeletal Training Grant and is currently supported by a Doctoral Dissertation Fellowship (DDF) through the Graduate School at the University of Minnesota. Some reagents used in this study were also supported by the Sobiech Osteosarcoma Fund Award and Children’s Cancer Research Fund grants (B.S.M.). The Tickle Family Land Grant Endowed Chair in Breast Cancer Research (C.A.L) and the West Cancer Center Research award (T.N.S.) also supported this work.
Footnotes
CONFLICT OF INTEREST STATEMENT
Dr. Lange serves on the Scientific Advisory Board of Context Therapeutics, Inc. All other authors declare no potential conflicts of interest.
REFERENCES
- 1.Koboldt DC, Fulton RS, McLellan MD, Schmidt H, Kalicki-Veizer J, McMichael JF, et al. Comprehensive molecular portraits of human breast tumours. Nature 2012;490(7418):61–70 doi 10.1038/nature11412. [DOI] [PMC free article] [PubMed] [Google Scholar]
- 2.Papadimitriou M, Mountzios G, Papadimitriou CA. The role of PARP inhibition in triple-negative breast cancer: Unraveling the wide spectrum of synthetic lethality. Cancer treatment reviews 2018;67:34–44 doi 10.1016/j.ctrv.2018.04.010. [DOI] [PubMed] [Google Scholar]
- 3.Foulkes WD, Smith IE, Reis-Filho JS. Triple-negative breast cancer. The New England journal of medicine 2010;363(20):1938–48 doi 10.1056/NEJMra1001389. [DOI] [PubMed] [Google Scholar]
- 4.O’Shaughnessy J, Osborne C, Pippen JE, Yoffe M, Patt D, Rocha C, et al. Iniparib plus Chemotherapy in Metastatic Triple-Negative Breast Cancer. New England Journal of Medicine 2011;364(3):205–14 doi 10.1056/NEJMoa1011418. [DOI] [PubMed] [Google Scholar]
- 5.Robson M, Im SA, Senkus E, Xu B, Domchek SM, Masuda N, et al. Olaparib for Metastatic Breast Cancer in Patients with a Germline BRCA Mutation. The New England journal of medicine 2017;377(6):523–33 doi 10.1056/NEJMoa1706450. [DOI] [PubMed] [Google Scholar]
- 6.Pan D, Kocherginsky M, Conzen SD. Activation of the Glucocorticoid Receptor Is Associated with Poor Prognosis in Estrogen Receptor-Negative Breast Cancer. Cancer Research 2011. doi 10.1158/0008-5472.CAN-11-0362. [DOI] [PMC free article] [PubMed] [Google Scholar]
- 7.West DC, Kocherginsky M, Tonsing-Carter EY, Dolcen DN, Hosfield DJ, Lastra RR, et al. Discovery of a glucocorticoid receptor (GR) activity signature using selective GR antagonism in ER-negative breast cancer. Clinical Cancer Research 2018:clincanres.2793.017 doi 10.1158/1078-0432.CCR-17-2793. [DOI] [PMC free article] [PubMed] [Google Scholar]
- 8.Regan Anderson TM, Ma S, Perez Kerkvliet C, Peng Y, Helle TM, Krutilina RI, et al. Taxol Induces Brk-dependent Prosurvival Phenotypes in TNBC Cells through an AhR/GR/HIF–driven Signaling Axis. Molecular Cancer Research 2018. doi 10.1158/1541-7786.MCR-18-0410. [DOI] [PMC free article] [PubMed] [Google Scholar]
- 9.Regan Anderson TM, Peacock DL, Daniel AR, Hubbard GK, Lofgren KA, Girard BJ, et al. Breast tumor kinase (Brk/PTK6) is a mediator of hypoxia-associated breast cancer progression. Cancer Research 2013:canres.0523.2013 doi 10.1158/0008-5472.CAN-13-0523. [DOI] [PMC free article] [PubMed] [Google Scholar]
- 10.Ostrander JH, Daniel AR, Lofgren K, Kleer CG, Lange CA. Breast Tumor Kinase (Protein Tyrosine Kinase 6) Regulates Heregulin-Induced Activation of ERK5 and p38 MAP Kinases in Breast Cancer Cells. Cancer Research 2007;67(9):4199 doi 10.1158/0008-5472.CAN-06-3409. [DOI] [PubMed] [Google Scholar]
- 11.Castro NE, Lange CA. Breast tumor kinase and extracellular signal-regulated kinase 5 mediate Met receptor signaling to cell migration in breast cancer cells. Breast Cancer Research 2010;12(4):R60 doi 10.1186/bcr2622. [DOI] [PMC free article] [PubMed] [Google Scholar]
- 12.Shen C-H, Chen H-Y, Lin M-S, Li F-Y, Chang C-C, Kuo M-L, et al. Breast Tumor Kinase Phosphorylates p190RhoGAP to Regulate Rho and Ras and Promote Breast Carcinoma Growth, Migration, and Invasion. Cancer Research 2008;68(19):7779 doi 10.1158/0008-5472.CAN-08-0997. [DOI] [PubMed] [Google Scholar]
- 13.Lofgren KA, Ostrander JH, Housa D, Hubbard GK, Locatelli A, Bliss RL, et al. Mammary gland specific expression of Brk/PTK6 promotes delayed involution and tumor formation associated with activation of p38 MAPK. Breast Cancer Research 2011;13(5):R89 doi 10.1186/bcr2946. [DOI] [PMC free article] [PubMed] [Google Scholar]
- 14.Pereira DM, Gomes SE, Borralho PM, Rodrigues CMP. MEK5/ERK5 activation regulates colon cancer stem-like cell properties. Cell Death Discovery 2019;5(1):68 doi 10.1038/s41420-019-0150-1. [DOI] [PMC free article] [PubMed] [Google Scholar]
- 15.Kamalati T, Jolin HE, Mitchell PJ, Barker KT, Jackson LE, Dean CJ, et al. Brk, a breast tumor-derived non-receptor protein-tyrosine kinase, sensitizes mammary epithelial cells to epidermal growth factor. The Journal of biological chemistry 1996;271(48):30956–63 doi 10.1074/jbc.271.48.30956. [DOI] [PubMed] [Google Scholar]
- 16.Ostrander JH, Daniel AR, Lange CA. Brk/PTK6 signaling in normal and cancer cell models. Curr Opin Pharmacol 2010;10(6):662–9 doi 10.1016/j.coph.2010.08.007.. [DOI] [PMC free article] [PubMed] [Google Scholar]
- 17.Irie HY, Shrestha Y, Selfors LM, Frye F, Iida N, Wang Z, et al. PTK6 Regulates IGF-1-Induced Anchorage-Independent Survival. PLOS ONE 2010;5(7):e11729 doi 10.1371/journal.pone.0011729. [DOI] [PMC free article] [PubMed] [Google Scholar]
- 18.Brauer PM, Tyner AL. Building a better understanding of the intracellular tyrosine kinase PTK6 — BRK by BRK. Biochimica et Biophysica Acta (BBA) - Reviews on Cancer 2010;1806(1):66–73 doi 10.1016/j.bbcan.2010.02.003. [DOI] [PMC free article] [PubMed] [Google Scholar]
- 19.Qiu L, Levine K, Gajiwala KS, Cronin CN, Nagata A, Johnson E, et al. Small molecule inhibitors reveal PTK6 kinase is not an oncogenic driver in breast cancers. PLOS ONE 2018;13(6):e0198374 doi 10.1371/journal.pone.0198374. [DOI] [PMC free article] [PubMed] [Google Scholar]
- 20.Mitchell PJ, Sara EA, Crompton MR. A novel adaptor-like protein which is a substrate for the non-receptor tyrosine kinase, BRK. Oncogene 2000;19(37):4273–82 doi 10.1038/sj.onc.1203775. [DOI] [PubMed] [Google Scholar]
- 21.Qiu H, Miller WT. Role of the Brk SH3 domain in substrate recognition. Oncogene 2004;23(12):2216–23 doi 10.1038/sj.onc.1207339. [DOI] [PubMed] [Google Scholar]
- 22.Qiu H, Zappacosta F, Su W, Annan RS, Miller WT. Interaction between Brk kinase and insulin receptor substrate-4. Oncogene 2005;24(36):5656–64 doi 10.1038/sj.onc.1208721. [DOI] [PubMed] [Google Scholar]
- 23.Zheng Y, Tyner AL. Context-specific protein tyrosine kinase 6 (PTK6) signalling in prostate cancer. European Journal of Clinical Investigation 2013;43(4):397–404 doi 10.1111/eci.12050. [DOI] [PMC free article] [PubMed] [Google Scholar]
- 24.Tsui T, Miller WT. Cancer-Associated Mutations in Breast Tumor Kinase/PTK6 Differentially Affect Enzyme Activity and Substrate Recognition. Biochemistry 2015;54(20):3173–82 doi 10.1021/acs.biochem.5b00303. [DOI] [PMC free article] [PubMed] [Google Scholar]
- 25.Nagy A, Lanczky A, Menyhart O, Gyorffy B. Validation of miRNA prognostic power in hepatocellular carcinoma using expression data of independent datasets. Sci Rep 2018;8(1):9227 doi 10.1038/s41598-018-27521-y.. [DOI] [PMC free article] [PubMed] [Google Scholar]
- 26.Aguirre-Gamboa R, Gomez-Rueda H, Martínez-Ledesma E, Martínez-Torteya A, Chacolla-Huaringa R, Rodriguez-Barrientos A, et al. SurvExpress: An Online Biomarker Validation Tool and Database for Cancer Gene Expression Data Using Survival Analysis. PLOS ONE 2013;8(9):e74250 doi 10.1371/journal.pone.0074250. [DOI] [PMC free article] [PubMed] [Google Scholar]
- 27.DeRose YS, Gligorich KM, Wang G, Georgelas A, Bowman P, Courdy SJ, et al. Patient-derived models of human breast cancer: protocols for in vitro and in vivo applications in tumor biology and translational medicine. Curr Protoc Pharmacol 2013;Chapter 14:Unit14 23 doi 10.1002/0471141755.ph1423s60. [DOI] [PMC free article] [PubMed] [Google Scholar]
- 28.Truong TH, Dwyer AR, Diep CH, Hu H, Hagen KM, Lange CA. Phosphorylated Progesterone Receptor Isoforms Mediate Opposing Stem Cell and Proliferative Breast Cancer Cell Fates. Endocrinology 2019;160(2):430–46 doi 10.1210/en.2018-00990. [DOI] [PMC free article] [PubMed] [Google Scholar]
- 29.El Ayachi I, Fatima I, Wend P, Alva-Ornelas JA, Runke S, Kuenzinger WL, et al. The WNT10B Network Is Associated with Survival and Metastases in Chemoresistant Triple-Negative Breast Cancer. Cancer Res 2019;79(5):982–93 doi 10.1158/0008-5472.CAN-18-1069. [DOI] [PMC free article] [PubMed] [Google Scholar]
- 30.Truong TH, Hu H, Temiz NA, Hagen KM, Girard BJ, Brady NJ, et al. Cancer Stem Cell Phenotypes in ER(+) Breast Cancer Models Are Promoted by PELP1/AIB1 Complexes. Molecular cancer research : MCR 2018;16(4):707–19 doi 10.1158/1541-7786.Mcr-17-0598. [DOI] [PMC free article] [PubMed] [Google Scholar]
- 31.Perez Kerkvliet C, Dwyer AR, Diep CH, Oakley RH, Liddle C, Cidlowski JA, et al. Glucocorticoid receptors are required effectors of TGFβ1-induced p38 MAPK signaling to advanced cancer phenotypes in triple-negative breast cancer. Breast Cancer Res 2020;22(1):39 doi 10.1186/s13058-020-01277-8. [DOI] [PMC free article] [PubMed] [Google Scholar]
- 32.Regan Anderson TM, Ma SH, Raj GV, Cidlowski JA, Helle TM, Knutson TP, et al. Breast Tumor Kinase (Brk/PTK6) Is Induced by HIF, Glucocorticoid Receptor, and PELP1-Mediated Stress Signaling in Triple-Negative Breast Cancer. Cancer Res 2016;76(6):1653–63 doi 10.1158/0008-5472.Can-15-2510. [DOI] [PMC free article] [PubMed] [Google Scholar]
- 33.Anders CK, Carey LA. Biology, metastatic patterns, and treatment of patients with triple-negative breast cancer. Clinical breast cancer 2009;9 Suppl 2(Suppl 2):S73–S81 doi 10.3816/CBC.2009.s.008. [DOI] [PMC free article] [PubMed] [Google Scholar]
- 34.Nguyen DX, Bos PD, Massague J. Metastasis: from dissemination to organ-specific colonization. Nature reviews Cancer 2009;9(4):274–84 doi 10.1038/nrc2622. [DOI] [PubMed] [Google Scholar]
- 35.Finisguerra V, Prenen H, Mazzone M. Preclinical and clinical evaluation of MET functions in cancer cells and in the tumor stroma. Oncogene 2016;35(42):5457–67 doi 10.1038/onc.2016.36. [DOI] [PubMed] [Google Scholar]
- 36.Garcia-Mata R, Boulter E, Burridge K. The ‘invisible hand’: regulation of RHO GTPases by RHOGDIs. Nat Rev Mol Cell Biol 2011;12(8):493–504 doi 10.1038/nrm3153. [DOI] [PMC free article] [PubMed] [Google Scholar]
- 37.Foucquier J, Guedj M. Analysis of drug combinations: current methodological landscape. Pharmacology research & perspectives 2015;3(3):e00149 doi 10.1002/prp2.149. [DOI] [PMC free article] [PubMed] [Google Scholar]
- 38.Zhong Z, Yeow WS, Zou C, Wassell R, Wang C, Pestell RG, et al. Cyclin D1/cyclin-dependent kinase 4 interacts with filamin A and affects the migration and invasion potential of breast cancer cells. Cancer Res 2010;70(5):2105–14 doi 10.1158/0008-5472.CAN-08-1108. [DOI] [PMC free article] [PubMed] [Google Scholar]
- 39.Wingate H, Puskas A, Duong M, Bui T, Richardson D, Liu Y, et al. Low molecular weight cyclin E is specific in breast cancer and is associated with mechanisms of tumor progression. Cell Cycle 2009;8(7):1062–8 doi 10.4161/cc.8.7.8119. [DOI] [PMC free article] [PubMed] [Google Scholar]
- 40.Helbig G, Christopherson KW 2nd, Bhat-Nakshatri P, Kumar S, Kishimoto H, Miller KD, et al. NF-kappaB promotes breast cancer cell migration and metastasis by inducing the expression of the chemokine receptor CXCR4. The Journal of biological chemistry 2003;278(24):21631–8 doi 10.1074/jbc.M300609200. [DOI] [PubMed] [Google Scholar]
- 41.Sutherland RL, Musgrove EA. Cyclins and breast cancer. J Mammary Gland Biol Neoplasia 2004;9(1):95–104 doi 10.1023/B:JOMG.0000023591.45568.77. [DOI] [PubMed] [Google Scholar]
- 42.Joyce D, Albanese C, Steer J, Fu M, Bouzahzah B, Pestell RG. NF-kappaB and cell-cycle regulation: the cyclin connection. Cytokine & growth factor reviews 2001;12(1):73–90 doi 10.1016/s1359-6101(00)00018-6. [DOI] [PubMed] [Google Scholar]
- 43.Safe S, Lee SO, Jin UH. Role of the aryl hydrocarbon receptor in carcinogenesis and potential as a drug target. Toxicol Sci 2013;135(1):1–16 doi 10.1093/toxsci/kft128. [DOI] [PMC free article] [PubMed] [Google Scholar]
- 44.Veldhoen M, Hirota K, Westendorf AM, Buer J, Dumoutier L, Renauld JC, et al. The aryl hydrocarbon receptor links TH17-cell-mediated autoimmunity to environmental toxins. Nature 2008;453(7191):106–9 doi 10.1038/nature06881. [DOI] [PubMed] [Google Scholar]
- 45.Androutsopoulos VP, Tsatsakis AM, Spandidos DA. Cytochrome P450 CYP1A1: wider roles in cancer progression and prevention. BMC cancer 2009;9:187 doi 10.1186/1471-2407-9-187. [DOI] [PMC free article] [PubMed] [Google Scholar]
- 46.D’Amato NC, Rogers TJ, Gordon MA, Greene LI, Cochrane DR, Spoelstra NS, et al. A TDO2-AhR signaling axis facilitates anoikis resistance and metastasis in triple-negative breast cancer. Cancer research 2015;75(21):4651–64 doi 10.1158/0008-5472.CAN-15-2011. [DOI] [PMC free article] [PubMed] [Google Scholar]
- 47.Pragyan P, Kesharwani SS, Nandekar PP, Rathod V, Sangamwar AT. Predicting drug metabolism by CYP1A1, CYP1A2, and CYP1B1: insights from MetaSite, molecular docking and quantum chemical calculations. Mol Divers 2014;18(4):865–78 doi 10.1007/s11030-014-9534-6. [DOI] [PubMed] [Google Scholar]
- 48.Minsavage GD, Park SK, Gasiewicz TA. The aryl hydrocarbon receptor (AhR) tyrosine 9, a residue that is essential for AhR DNA binding activity, is not a phosphoresidue but augments AhR phosphorylation. J Biol Chem 2004;279(20):20582–93 doi 10.1074/jbc.M312977200. [DOI] [PubMed] [Google Scholar]
- 49.Sachs N, de Ligt J, Kopper O, Gogola E, Bounova G, Weeber F, et al. A Living Biobank of Breast Cancer Organoids Captures Disease Heterogeneity. Cell 2018;172(1-2):373–86.e10 doi 10.1016/j.cell.2017.11.010. [DOI] [PubMed] [Google Scholar]
- 50.Goel RK, Lukong KE. Tracing the footprints of the breast cancer oncogene BRK - Past till present. Biochimica et biophysica acta 2015;1856(1):39–54 doi 10.1016/j.bbcan.2015.05.001. [DOI] [PubMed] [Google Scholar]
- 51.Mathur PS, Gierut JJ, Guzman G, Xie H, Xicola RM, Llor X, et al. Kinase-Dependent and -Independent Roles for PTK6 in Colon Cancer. Mol Cancer Res 2016;14(6):563–73 doi 10.1158/1541-7786.MCR-15-0450. [DOI] [PMC free article] [PubMed] [Google Scholar]
- 52.Morlacchi P, Robertson FM, Klostergaard J, McMurray JS. Targeting SH2 domains in breast cancer. Future medicinal chemistry 2014;6(17):1909–26 doi 10.4155/fmc.14.120. [DOI] [PMC free article] [PubMed] [Google Scholar]
- 53.Stoker AW. Protein tyrosine phosphatases and signalling. J Endocrinol 2005;185(1):19–33 doi 10.1677/joe.1.06069. [DOI] [PubMed] [Google Scholar]
- 54.Unwin RD, Sternberg DW, Lu Y, Pierce A, Gilliland DG, Whetton AD. Global effects of BCR/ABL and TEL/PDGFRbeta expression on the proteome and phosphoproteome: identification of the Rho pathway as a target of BCR/ABL. The Journal of biological chemistry 2005;280(8):6316–26 doi 10.1074/jbc.M410598200. [DOI] [PubMed] [Google Scholar]
- 55.Chen Z, Lan X, Wu D, Sunkel B, Ye Z, Huang J, et al. Ligand-dependent genomic function of glucocorticoid receptor in triple-negative breast cancer. Nat Commun 2015;6:8323 doi 10.1038/ncomms9323. [DOI] [PMC free article] [PubMed] [Google Scholar]
- 56.Lin Y, Mallen-St Clair J, Wang G, Luo J, Palma-Diaz F, Lai C, et al. p38 MAPK mediates epithelial-mesenchymal transition by regulating p38IP and Snail in head and neck squamous cell carcinoma. Oral Oncol 2016;60:81–9 doi 10.1016/j.oraloncology.2016.06.010. [DOI] [PubMed] [Google Scholar]
- 57.Strippoli R, Benedicto I, Foronda M, Perez-Lozano ML, Sanchez-Perales S, Lopez-Cabrera M, et al. p38 maintains E-cadherin expression by modulating TAK1-NF-kappa B during epithelial-to-mesenchymal transition. J Cell Sci 2010;123(Pt 24):4321–31 doi 10.1242/jcs.071647. [DOI] [PubMed] [Google Scholar]
- 58.Cargnello M, Roux PP. Activation and function of the MAPKs and their substrates, the MAPK-activated protein kinases. Microbiology and molecular biology reviews : MMBR 2011;75(1):50–83 doi 10.1128/mmbr.00031-10. [DOI] [PMC free article] [PubMed] [Google Scholar]
- 59.Shimada T, Fujii-Kuriyama Y. Metabolic activation of polycyclic aromatic hydrocarbons to carcinogens by cytochromes P450 1A1 and 1B1. Cancer science 2004;95(1):1–6 doi 10.1111/j.1349-7006.2004.tb03162.x. [DOI] [PMC free article] [PubMed] [Google Scholar]
- 60.Androutsopoulos VP, Spyrou I, Ploumidis A, Papalampros AE, Kyriakakis M, Delakas D, et al. Expression profile of CYP1A1 and CYP1B1 enzymes in colon and bladder tumors. PLoS One 2013;8(12):e82487 doi 10.1371/journal.pone.0082487. [DOI] [PMC free article] [PubMed] [Google Scholar]
- 61.Rodriguez M, Potter DA. CYP1A1 regulates breast cancer proliferation and survival. Molecular cancer research : MCR 2013;11(7):780–92 doi 10.1158/1541-7786.Mcr-12-0675. [DOI] [PMC free article] [PubMed] [Google Scholar]
- 62.Xu XL, Ye YL, Wu ZM, He QM, Tan L, Xiao KH, et al. Overexpression of PTK6 predicts poor prognosis in bladder cancer patients. J Cancer 2017;8(17):3464–73 doi 10.7150/jca.21318. [DOI] [PMC free article] [PubMed] [Google Scholar]
- 63.Ishida M, Mikami S, Kikuchi E, Kosaka T, Miyajima A, Nakagawa K, et al. Activation of the aryl hydrocarbon receptor pathway enhances cancer cell invasion by upregulating the MMP expression and is associated with poor prognosis in upper urinary tract urothelial cancer. Carcinogenesis 2010;31(2):287–95 doi 10.1093/carcin/bgp222. [DOI] [PubMed] [Google Scholar]
- 64.O’Donnell EF, Kopparapu PR, Koch DC, Jang HS, Phillips JL, Tanguay RL, et al. The aryl hydrocarbon receptor mediates leflunomide-induced growth inhibition of melanoma cells. PLoS One 2012;7(7):e40926 doi 10.1371/journal.pone.0040926. [DOI] [PMC free article] [PubMed] [Google Scholar]
- 65.Kodama T, Shimizu N, Yoshikawa N, Makino Y, Ouchida R, Okamoto K, et al. Role of the glucocorticoid receptor for regulation of hypoxia-dependent gene expression. The Journal of biological chemistry 2003;278(35):33384–91 doi 10.1074/jbc.M302581200. [DOI] [PubMed] [Google Scholar]
- 66.Sato S, Shirakawa H, Tomita S, Tohkin M, Gonzalez FJ, Komai M. The aryl hydrocarbon receptor and glucocorticoid receptor interact to activate human metallothionein 2A. Toxicology and applied pharmacology 2013;273(1):90–9 doi 10.1016/j.taap.2013.08.017. [DOI] [PMC free article] [PubMed] [Google Scholar]
- 67.Obradovic MMS, Hamelin B, Manevski N, Couto JP, Sethi A, Coissieux MM, et al. Glucocorticoids promote breast cancer metastasis. Nature 2019;567(7749):540–4 doi 10.1038/s41586-019-1019-4. [DOI] [PubMed] [Google Scholar]
- 68.Prudnikova TY, Rawat SJ, Chernoff J. Molecular pathways: targeting the kinase effectors of RHO-family GTPases. Clin Cancer Res 2015;21(1):24–9 doi 10.1158/1078-0432.CCR-14-0827. [DOI] [PMC free article] [PubMed] [Google Scholar]
- 69.Igea A, Nebreda AR. The Stress Kinase p38alpha as a Target for Cancer Therapy. Cancer Res 2015;75(19):3997–4002 doi 10.1158/0008-5472.CAN-15-0173. [DOI] [PubMed] [Google Scholar]
- 70.Safe S, Cheng Y, Jin UH. The Aryl Hydrocarbon Receptor (AhR) as a Drug Target for Cancer Chemotherapy. Current opinion in toxicology 2017;2:24–9 doi 10.1016/j.cotox.2017.01.012. [DOI] [PMC free article] [PubMed] [Google Scholar]
- 71.Murray IA, Patterson AD, Perdew GH. Aryl hydrocarbon receptor ligands in cancer: friend and foe. Nature reviews Cancer 2014;14(12):801–14 doi 10.1038/nrc3846. [DOI] [PMC free article] [PubMed] [Google Scholar]
Associated Data
This section collects any data citations, data availability statements, or supplementary materials included in this article.