Abstract
An inhomogeneous anisotropic physical model of the brain cortex is presented that predicts the emergence of non–evanescent (weakly damped) wave–like modes propagating in the thin cortex layers transverse to both the mean neural fiber direction and to the cortex spatial gradient. Although the amplitude of these modes stays below the typically observed axon spiking potential, the lifetime of these modes may significantly exceed the spiking potential inverse decay constant. Full brain numerical simulations based on parameters extracted from diffusion and structural MRI confirm the existence and extended duration of these wave modes. Contrary to the standard paradigm that the neural fibers determine the pathways for signal propagation in the brain, the signal propagation due to the cortex wave modes in highly folded areas will exhibit no apparent correlation with the fiber directions. The results are consistent with numerous recent experimental animal and human brain studies demonstrating the existence of electrostatic field activity in the form of traveling waves (including studies where neuronal connections were severed) and with wave loop induced peaks observed in EEG spectra. In addition, we demonstrate that the resonant and non-resonant terms of the nonlinear coupling between multiple modes produce both synchronous spiking-like high frequency wave activity as well as low frequency wave rhythms as a result of their unique dispersion properties. Numerical simulation of forced multiple mode dynamics shows that as forcing increases there is a transition from damped to oscillatory regime that subsequently decays away as over-excitation is reached. The resonant nonlinear coupling results in the emergence of low frequency rhythms with frequencies that are several orders of magnitude below the linear frequencies of modes taking part in the coupling. The localization and persistence of these cortical wave modes, and this new mechanism for understanding the nature of spiking behavior, have significant implications in particular for neuroimaging methods that detect electromagnetic physiological activity, such as EEG and MEG, and in general for the understanding of brain activity, including mechanisms of memory.
I. INTRODUCTION
The majority of approaches to characterizing brain dynamical behavior are based on the assumption that signal propagation along well known anatomically defined pathways, such as major neural fiber bundles, tracts or groups of axons (down to a single axon connectivity) should be sufficient to deduce the dynamical characteristics of brain activity at different spatiotemporal scales. Experimentally, data on which this assumption is employed range from high temporal resolution neural oscillations detected at low spatial resolution by EEG/MEG [1] to high spatial resolution functional MRI resting state modes oscillation detected at low temporal resolution [2] . As a consequence, a great deal of research activity is directed at the construction of connectivity maps between different brain regions (e.g., the Human Connectome Project [3]), and using those maps to study dynamical network properties with the help of different models of signal communication through this network along structurally aligned pathways [4], i.e. by allowing input from different scales or introducing axon propagation delays [5].
However, recent detection [6] of cortical wave activity spatiotemporally organized into circular wave-like patterns on the cortical surface, spanning the area not directly related to any of the structurally aligned pathways, but nevertheless persistent over hours of sleep with millisecond temporal precision, presents a formidable challenge for network theories to explain such a remarkable synchronization across a multitude of different local networks. Additionally, many studies show evidence that electrostatic field activity in animal or human hippocampus (as well as cortex) are traveling waves [7] that can affect neuronal activity by modulating the firing rates [7] and may possibly play an important functional role in diverse brain structures [8]. And perhaps more importantly it has been experimentally shown [9] that periodic activity can self-propagate by endogenous electric fields even through a physical cut in vitro that destroys all mechanisms of neuron to neuron communication.
In this paper we investigate a more general physical wave mechanism that allows cortical surface wave propagation in the cross fiber directions due to the interplay between tissue inhomogeneity and anisotropy in the thin surface cortex layer. This new mechanism has been overlooked by previous models of brain wave characterization and thus is absent from current network pathway reconstruction and analysis approaches.
The abundance of oscillatory patterns across a wide range of spatial and temporal scales of brain electromagnetic activity has generated much discussion and debate in the literature on their interaction [10]. The standard approach involves representing the brain as a large network of coupled oscillators [11] and using this as a testbed for the study of network wave propagation, mechanisms of synchrony, possibly deriving some mean field equations and properties, etc. However, such models are necessarily descriptive and their relationship to actual physical properties of actual brain tissue or the electromagnetic waves they support is tenuous.
The main claim of this paper is that there is a simple and elegant physical mechanism behind the existence of these cross-fiber waves that can explain the emergence and persistence of wave loops and wave propagation along the highly folded cortical regions with a relatively slow damping. The lifetime of these wave–like cortex activity events can significantly exceed the decay time of the typical axon action potential spikes and thus can provide “memory-like” response in the cortical areas generated as a result of “along–the–axon” spiky activations. This new mechanism may provide an alternative approach for the integration of microscopic brain properties and for the development of a “physical” model for memory.
The paper derives cortex wave dispersion relation from well known relatively basic physical principles and provides illustrations of why and how cortical tissue inhomogeneity and anisotropy influence propagation magnitude, time-scales, and directions and supports extended and highly structured regions of existence in dissipative media using simple 1- and 2-D anisotropic models, as well as more realistic full brain model based on a set of parameters extracted from real diffusion and structural MRI acquisitions. The wave properties (frequency ranges, phase and group velocities, possible spectra) are then compared with real EEG wave acquisitions. Finally, examples of wave propagation are studied analytically and numerically using a simple idealized but informative spherical shell cortex model (i.e. thin inhomogeneous layer around a sphere with homogeneous anisotropic conducting medium) as well as a more realistic anisotropic inhomogeneous full brain model with actual cortical fold geometry that clearly shows the emergence of localized persistent wave loops or rotating wave patterns at various scales, including scales similar to the scales of global rotation recently detected experimentally [6].
An important aspect of the cortical waves model we present is that it is based on relatively simple but physically motivated averaged electrostatic properties of human neuronal tissue within realistic data-derived brain tissue distributions, geometries, and anisotropy. While the source of these averaged tissue properties includes the extraordinarily complex network of neuronal fiber connections supporting a multitude of underlying cellular, subcellular and extracellular processes, we demonstrate that the inclusion of such details for the activation/excitation process is not necessary to produce coherent, stable, macroscopic cortical waves. Instead, a simple and elegant physical model for wave propagation in a thin dissipative inhomogeneous and anisotropic cortical layer of these averaged properties is sufficient to predict the emergence of coherent, localized, and persistent wave loop patterns in the brain.
In addition, we demonstrate that the wave linear dispersion combined with nonlinear resonant and non–resonant coupling of multiple wave modes produces a remarkably feature rich nonlinear system that is able to reproduce many seemingly unrelated regimes that have been observed experimentally throughout a wide range of scales of brain activity. The different regimes include high frequency spiking-like activity occurring near the critical point of the equation that integrates multiple non-resonant wave modes and low frequency oscillations that emerge when weak resonant coupling is present in the vicinity of the critical point. The strongly nonlinear regime exists sufficiently close to the critical point where the solution bifurcates from oscillatory to non-oscillatory behavior. The weak resonant coupling then demonstrates a mechanism that constantly moves the system back and forth from subcritical to supercritical domains turning the spiking on and off with low frequency quasiperiodicity. This provides a novel physical mechanism to explain the flexibility and adaptability of the human brain across a wide range of tasks.
In order to describe this complex behavior we show for the first time that the inverse proportionality of frequency and wavenumber in brain wave dispersion relation permits the characterization of a limiting form for the signals in terms of a large number of wavemodes as a summation of non-resonant wave harmonics, thus allowing a closed analytical form of a nonlinear equation that integrates and includes the collective non-resonant input from multiple wave modes. This general mechanism explains the emergence of synchronized spiking from an elegant perspective of nonlinear wave physics, rather than relying on empirical fitting of a single measured quantity to a set of ad-hoc multi-parametric differential equations using 20+ dimensional and dimensionless fitting parameters, as is typically employed by a multitude of single neuron spiking models [10, 12]. Following the ideas of wave turbulence [13] we also show that the resonant coupling between those high frequency nonlinear wave modes can provide an effective universal mechanism for the emergence of low frequency wave rhythms. In Section II below we present the linear theory that explains the existence of evanescent wave-loops. In Section III we extend this to the nonlinear regime and demonstrate the emergence of spiking behavior and its interaction with the cortical loops of the linear theory.
II. LINEAR THEORY
A. Wave dispersion
We start with the most general form of brain electromagnetic activity using Maxwell equations in a general (i.e., inhomogeneous and anisotropic) medium
Using the electrostatic potential E = −∇ϕ, Ohm’s law J = σ · E (where σ ≡ {σij} is an anisotropic conductivity tensor), a linear electrostatic property for brain tissue D = εE, assuming that the scalar permittivity ε is a “good” function (i.e. it does not go to zero or infinity everywhere) and taking the change of variables ∂x → ε∂x′, the charge continuity equation for the spatial-temporal evolution of the potential ϕ can be written in terms of a permittivity scaled conductivity tensor Σ = {σij/ε} as
| (1) |
where we have included a possible external source (or forcing) term . For brain fiber tissues the conductivity tensor Σ might have significantly larger values along the fiber direction than across them. The charge continuity without forcing i.e., () can be written in tensor notation as
| (2) |
where repeating indices denote summation. Simple linear wave analysis, i.e. substitution of ϕ ~ exp (−i(k · r − Ωt)), where k is the wavenumber, r is the coordinate, Ω is the frequency and t is the time, gives the following complex dispersion relation:
| (3) |
which is composed of the real and imaginary components:
| (4) |
The condition for non– (or weak–) evanescence is that the oscillatory (i.e., imaginary) component of ϕ, characterized by the frequency ω, is much larger than the decaying (i.e., real) component, characterized by the damping γ: i.e. that the condition |γ/ω| ≪ 1 must be satisfied. This requirement is clearly not satisfied if reported average isotropic and homogeneous parameters are used to describe brain tissues. For typical low frequency (≲ 10Hz) white and gray matter conductivity and permittivity (i.e. from [14]) εGM = 4.07 · 107ε0, εW M = 2.76 · 107ε0, σGM = 2.75 · 10−2 S/m, σW M = 2.77 · 10−2 S/m, where ε0 = 8.854187817·10−12 F/m is the vacuum permittivity) the damping rate γ is in the range of 75–115 s−1 which would be expected to give strong wave damping.
B. Effects of anisotropy
In order to better understand the effects of brain tissue micro- and macro-structure on the manifestation of propagating brain waves, it is instructive to consider two idealized tissue models. In the first model (Fig. 1a) all brain fibers are packed in a half space aligned in z direction and their number decreases in x direction in a relatively thin layer at the boundary. We assume that small cross fiber currents can be characterized by a small parameter e and introduce the conductivity tensor as
| (5) |
where υ ≡ υ(x). For the υ(x) dependence we will assume that the conductivity is changing only through a relatively narrow layer at the boundary (as illustrated in Fig. 1a) and the conductivity gradient is directed along x axis. Then we will look for a solution for the potential ϕ located in the thin layer of inhomogeneity (that is we substitute x → ϵx) that depends on z and y only as ϕ = ϕ‖(z) + ϵϕ⊥ (y).
FIG. 1.
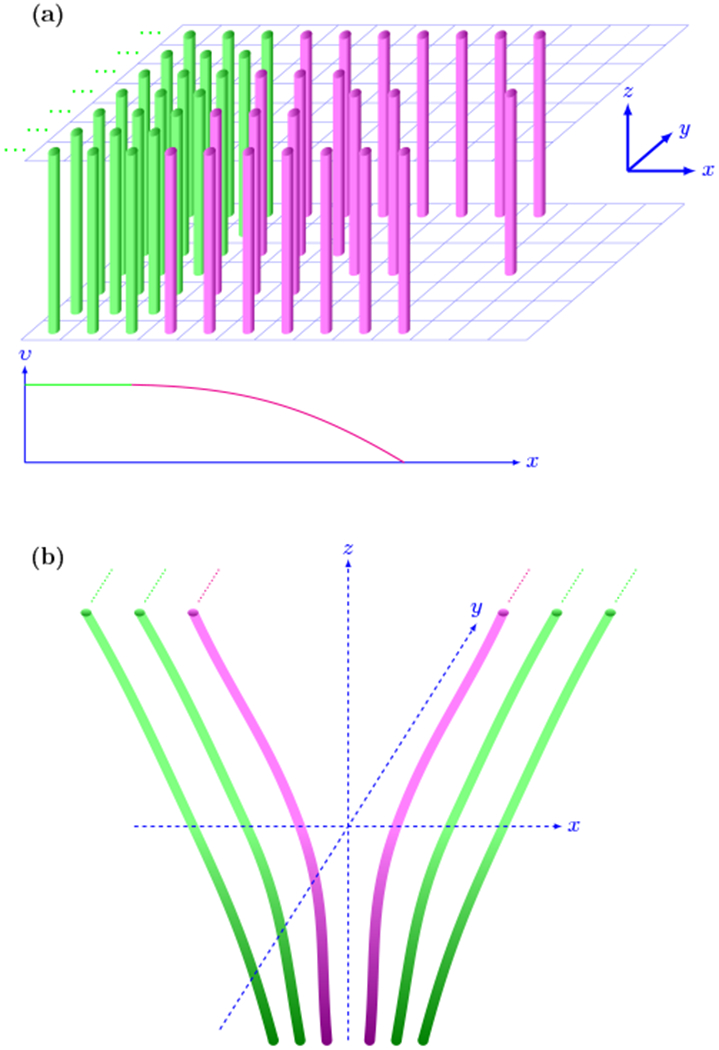
(a) Schematic picture of half-plane packing of fibers. The uniform area of fibers oriented along z direction (shown in green) is bounded by a thin transitional area (magenta) where the conductivity gradient may be important (a sketch of one possible conductivity profile is shown at the bottom of panel). (b) Schematic picture that can be used as a crude two dimensional approximation of a fold. The direction of fiber conductivity has only x and z components and all quantities are assumed to be uniform in y direction.
| (6) |
| (7) |
where ϵ0 and ϵ1 denote the zeroth and the first orders of ϵ power.
The first equation (6) describes a potential along the fiber direction and is a damped oscillator equation that has a decaying solution. But the second equation (7) describes a potential perpendicular to the fiber direction and does not include a damping term, hence it describes a pure wave-like solution that propagates in the thin layer transverse to the main fiber direction. Thus although this wave-like solution ϕ⊥ has a smaller amplitude than along the fiber action potential ϕ‖, it can nevertheless have a much longer lifetime.
We would like to stress that the equations (6) and (7) are here only for illustrative purposes to emphasize a relatively obvious but often overlooked consideration that under anisotropic inhomogeneous conditions some directions may happen to be better suited for wave propagation than the others, and, in particular, those directions are not necessarily along the direction of the fibers. Below we will develop the more complete theory of brain wave propagation using the more general dispersion relation (3).
In order to account for geometric variations, we construct a slightly more complex two dimensional model that can be viewed as a very crude approximation of a cortical fold (Fig. 1b). It is easy to derive an analogue of the equation (7) for the ϕ⊥(y) in the case when υ ≡ υ(x, z). This new equation for the ϕ⊥(y) will again be of a wave type, similar to (7), with the addition of a z component of the conductivity gradient and with a similar wave–like solution that will include an additional term induced by the inhomogeneity in z.
The sole purpose of those examples is to provide illustrations that dissipative media with complex structure may show surface wave–like solutions. Surface waves at the boundary of various elastic media have been extensively studied and used in various areas of science (including acoustics, hydrodynamics, plasma physics, etc.) since the work of Lord Rayleigh [15]. The existence of surface waves at the dissipative medium boundary is also known [16].
C. Effects of brain composition and architecture
In order to extend the above analysis to a more realistic model of brain tissue architecture we extracted volumetric structural brain parameters from high resolution anatomical MRI datasets as well as brain fiber anisotropy from diffusion weighted MRI datasets. All anatomical and diffusion MRI datasets are from the Human Connectome Project [3]. The details for all of the processing steps can be found in [17–19]. More refined procedures for constructing the conductivity tensor and anisotropy in different brain regions, cortical areas in particular, would clearly be beneficial and will be addressed in the future.
To provide an illustration of where the conductivity anisotropy and inhomogeneity can form appropriate conditions for cortex surface waves generation we created plots that can be used to characterize the ratio |γ/ω|. To construct the ratio we calculated two vectors, ∂iΣij and Σjjki and compared their norms. For wave vector k we used a vector with the same direction as in ∂iΣij vector and magnitude |k| = |∇Σ|/|Σ|, i.e. our intention is to compare norms of dissipative and wave-like terms at kh ≈ 1 where h is the cortical thickness. Fig.2 shows plot of the ratio of |Σijki| and |∂iΣij| at two different depths inside the brain with dissipative regime in the inner cortex (a) and wave–like conditions in the outer cortex (b).
FIG. 2.
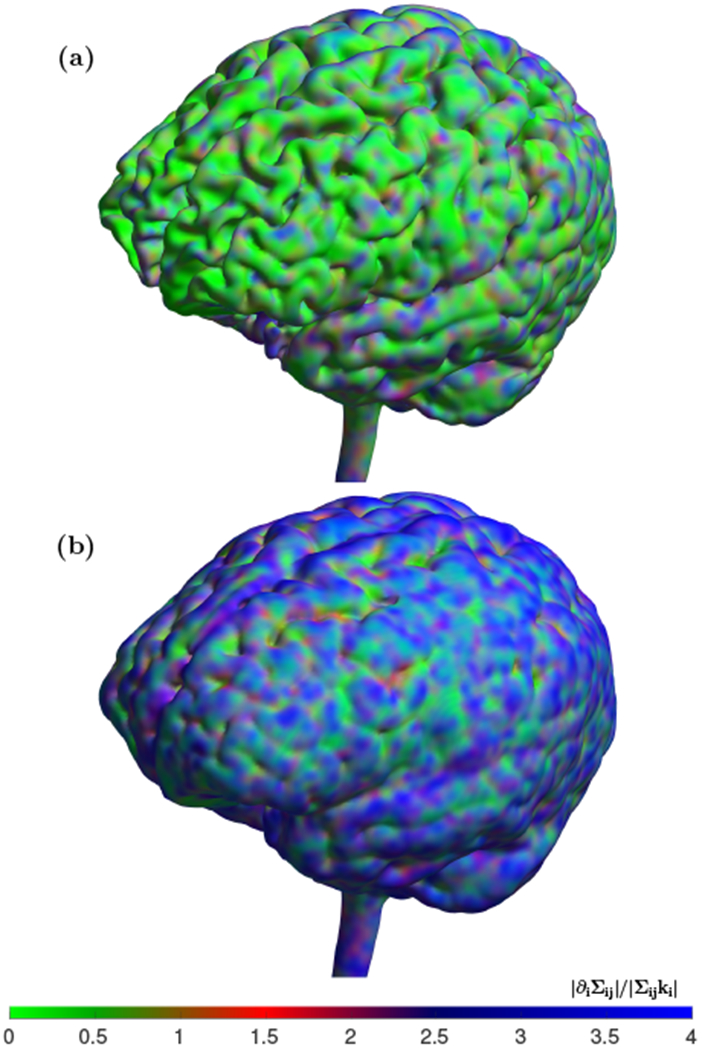
Isovolume maps for comparison of dissipation vs wave-like effects at different cortex layers. (a) The isosurface from the cortex area that may be representative of white–gray matter interface. (b) The isosurface that is located in the outer cortex area of gray matter. The color scheme uses shades of green to mark regions where dissipative term dominates, i.e. |Σijki| ≥ |∂iΣij|, shades of red where |Σijki| < |∂iΣij| ≤ 2|Σij ki|, and shades of blue where the wave-like term is more than two times dominant, i.e. 2|Σijki| < |∂iΣij|. The inner cortex shown in (a) clearly display prevalence of dissipation, whereas the outer cortex shown in (b) allows for wave–like cortex activity in a majority of the locations.
Both anisotropy and inhomogeneity are important for the existence of the cortex surface waves. For example for inhomogeneous but isotropic tissue the conductivity tensor Σij will simply be Sδij, where S is a scalar inhomogeneous conductivity. Therefore both the phase velocity
and the group velocity
will include terms ∇S and ∇S · k, meaning that those waves are not able to propagate normally to the local conductivity gradient ∇S. This restriction is absent in cortex areas when both anisotropy and inhomogeneity are present (due to tensor products in ∇ · Σ and ∇ · Σ · k).
D. Spherical cortex shell model
To provide some (possibly overly optimistic) estimates based on a typical human brain dimensions we can consider a simple spherical cortex shell model with a cortical layer of fixed thickness h ≈ 1.5–3mm spread over a hemisphere of radius R ≈ 75mm, with all parameters kept constant inside the hemisphere (for r < R) and changing as a function of radius r in a cortical layer. Even without taking into account the known strong anisotropy of neural tissue, these simple geometric considerations provides from (4) for the longest waves (with the smallest amount of damping) with
Anisotropy (Σ⊥ < Σ‖) will reduce this estimate even further,
thus further strengthening the condition necessary to support stable waves. This simple spherical shell model can be used to illustrate the natural appearance of loop-type cortical waves, which can be easily understood from simple geometrical optics arguments. Using the dispersion relation (3) with only single component of the conductivity tensor Σzz = S(r), the wave frequency ω can be expressed as
| (8) |
where we have neglected the term because kh ≪ 1. Then from the geometrical optics ray equations
| (9) |
where rl and kl are l component of the coordinate r and wavenumber k vectors respectively, we can get
| (10) |
These equations will generate rays inside the spherical cortex shell showing wave propagation across both the fibers and the conductivity gradient in the cortex subregion where ω dω / dr < 0. For and the wave path has the simplest form – the wave follows the same loop through the cortex over and over again. Different families of frequencies ω and wavevectors k will result in the appearance of cortical wave loops at different cortex locations (more details of spherical shell model are available in Appendix A).
E. Brain waves power spectra
In order to determine a possible energy distribution across different frequencies for these cortical waves some knowledge about the forcing term in (1) is required. A rough estimate for this distribution in the form of a power spectra scaling can be carried out using some simple assumptions. Assuming that the forcing consists of spiking input localized at random locations and times, it can be described as a sum of delta functions, , corresponding to a flat forcing frequency spectrum in the Fourier domain. Then, from the last term in (2) , we can estimate the exponent α = 2 in a power law scaling of the potential ϕ frequency spectrum (i.e. for |ϕω|2 ~ ω−α).
The presence of the cortical wave loops described above can modify this ω−2 dependence and thus modify the spectrum in such a way that spectrum peaks are generated that correspond to these loop wave currents. From (8) we can estimate the range of frequencies where those loops can possibly be present. Taking 1/r ~ 1/R, gives a frequency estimate as , hence for the largest and smallest wavenumbers defined by the smallest (1.5mm) and largest (75mm) loop radii, the frequency f spans the range 1.2–92Hz (υph ≈ 0.002–7m/s). The large scale circular cortical waves of [6] (9–18Hz, 2–5m/s) are clearly inside this range. The above spherical shell wave propagation example (as well as wave simulations presented below) are not able to predict the exact values for wave amplitude as it requires calculation of the balance between excitation and dissipation of these waves at various frequency ranges and the simple estimates using amplitudes of spiking are not that particularly informative as they simply predict the values that are in the range of typically observed field potentials. Nevertheless, even without the amplitude estimation our analysis is able to predict the preferred directions of wave propagation and loop pattern formation based on geometrical and tissue properties. Moreover, this framework provides the mechanisms to incorporate a more complete quantitative description of axonal spiking which we address in the next section.
Evidence for the existence of these wave loop induced spectral peaks is shown in Fig.3, which shows the spectral power of the EEG signal for six subjects [20], averaged over all sensors. The dashed lines outline the predicted f−2 in the lower (f ≲ 1.2Hz) and higher (f ≳ 92Hz) parts of the spectra. The dashed-dotted vertical lines denote the frequency range where the cortical loops may exist, agreeing very well with typically observed EEG excessive activity range, from low frequency delta (0.5–4Hz) to high frequency gamma (25–100Hz) bands.
FIG. 3.
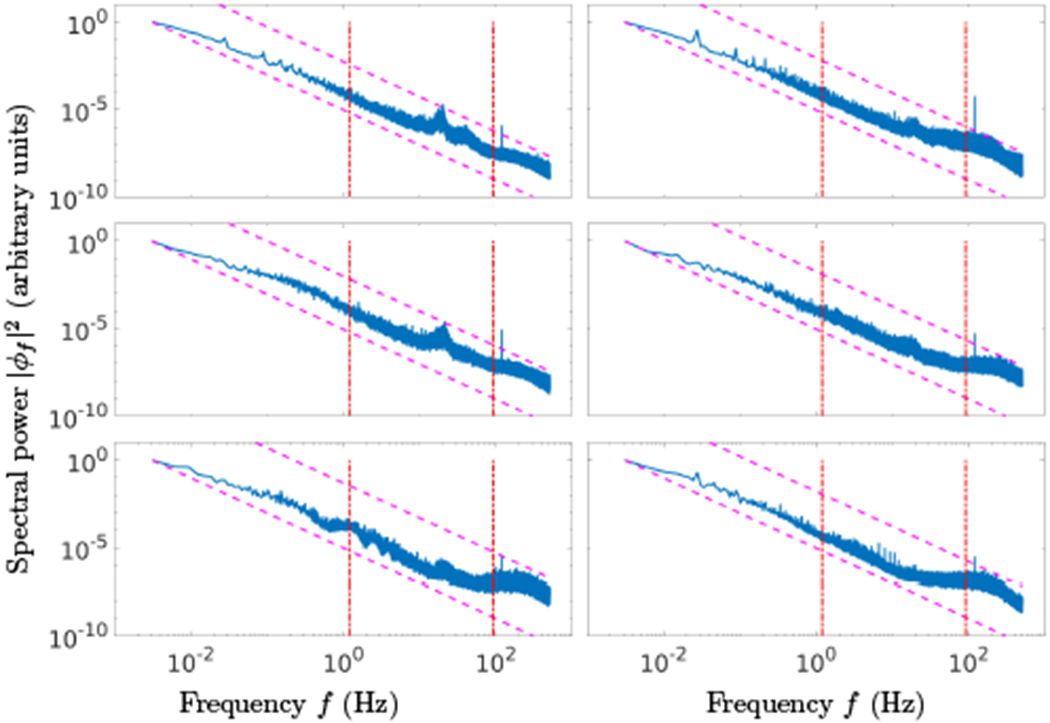
Spectral power of EEG signal collected with 64 sensor array and averaged over all sensors for six independent subjects is shown in six panels. The dashed lines outline the predicted f−2 in the lower (f ≲ 1.2Hz) and higher (f ≳ 92Hz) parts of the spectra. The dashed-dotted vertical lines denote the frequency range where the cortical wave loops may be generated. Both the slope and the range agree very well with typically observed values.
F. Linear brain wave propagation
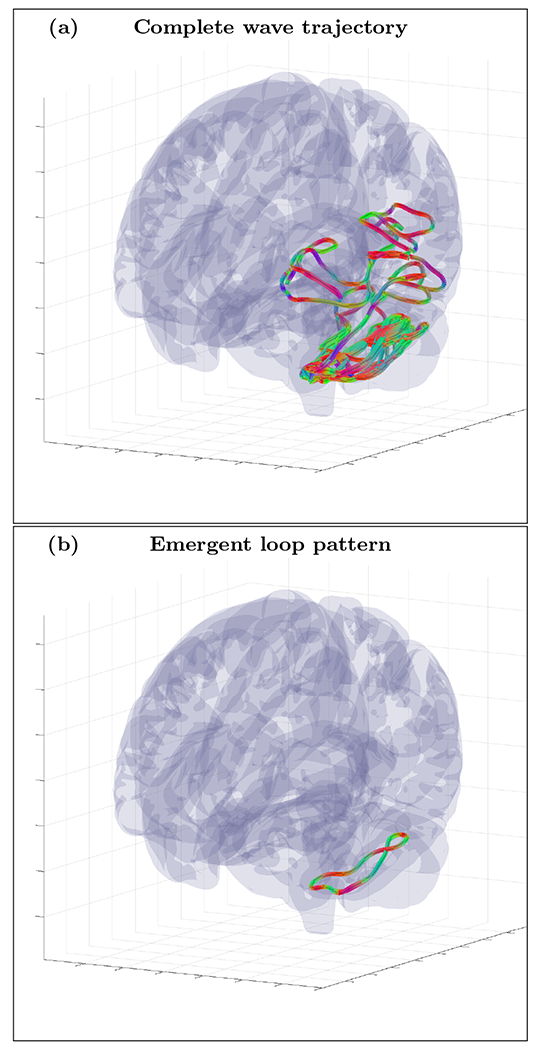
The effect described theoretically above can be demonstrated through numerical simulation of wave propagation in a thin dissipative inhomogeneous and anisotropic cortical layer. As a starting point for numerical study we included Fig. 4, that shows spatial snapshots of the dynamical behavior of randomly generated wave trajectories (the movies are in [21] and in Appendix G with additional technical details) in a regime with γeffLloop/υgr ≤ 1 (where γeff is an effective wave dissipation rate, i.e. a difference between average dissipation and spiky activations rates for a wave packet propagating with group velocity υgr along some characteristic loop of Lloop length. Wave packets are simulated using the ray equations (9) where the general form of anisotropic dispersion relation (3) and (4) is used.
FIG. 4.
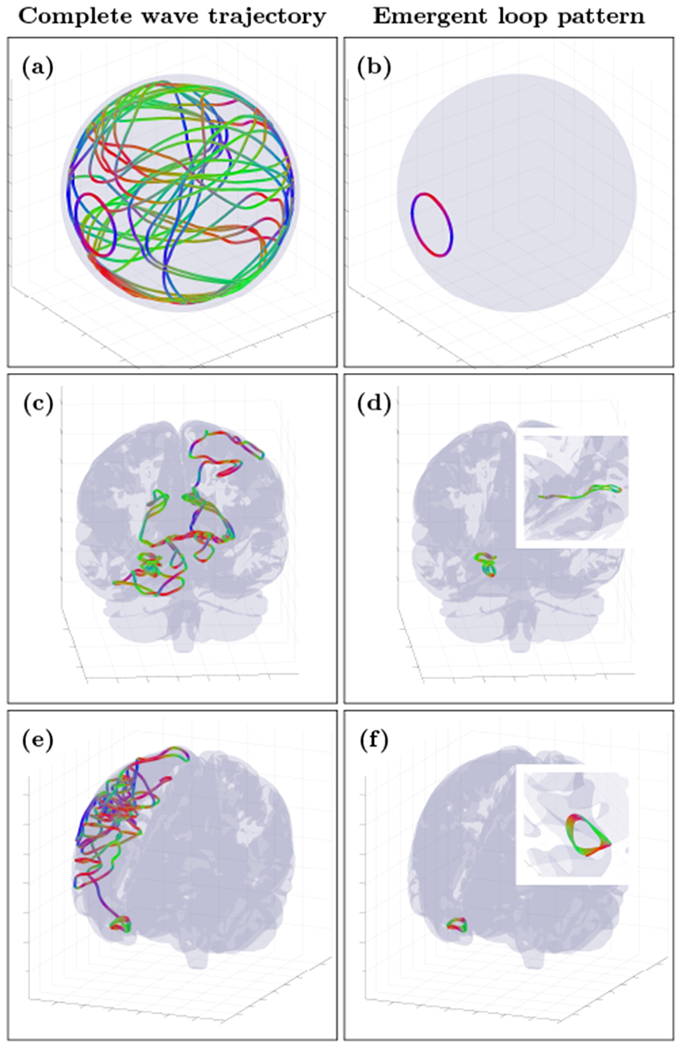
Complete wave packet trajectory snapshots (left column) and emergent stable wave loop patterns (right column) for the thin spherical shell cortex model (a and b) and for the realistic cortex fold geometry (c,d,e and f). All wave packets were initialized with random parameters assuming the presence of spiky activation sources (not shown). Movie files for these and additional loop examples can be found in [21].
In the idealized spherical model some of the emergent persistent localized cortical wave patterns are precisely the simple loop pattern predicted by (10), despite the complex initial spatiotemporal pattern of the initial wave trajectory. As further predicted, the simulations informed by the real human data with the same cortex fold geometry as in Fig.2 (middle and bottom panels) also produce stable loop structures, now embedded within the complex geometry of the cortical folds.
All wave simulations were initialized with wave packets of random parameters (frequency, wave number, location, etc), but clearly show an emergence of localized persistent closed loop patterns at different spatial and temporal scales, from scales as large as the whole brain where rotational wave activity has been experimentally detected in [6] to as small as the resolution used for the cortical layer thickness detection (more details of cortical fold model and wave integration are available in Appendices B to D).
III. NONLINEAR THEORY
A. Reduced equation
The above linear analysis can be extended to include nonlinear effects resulting from a more complex description of the physical processes involving the tissue properties. We assume for simplicity a two dimensional symmetric form of the conductivity tensor with constant diagonal terms Σxx and Σyy (where Σyy is along the fibers conductivity, Σxx < Σyy) and position dependent off–diagonal terms Σxy that are changing linearly with y through a relatively narrow layer at the boundary so that the conductivity gradient exists only inside this layer and is directed along the y axis. We will only be interested in a one dimensional solution for the potential ϕ(x) located in this thin layer of inhomogeneity that can be described by the reduced equation
| (11) |
where γd = Σxx and Ω = ∂y Σxy.
The source term can be assumed to have a frequency independent forcing part with a linear growth rate γe representing some averaged input from random spiking activity and an additional term that describes the nonlinear amplitude/phase coupling of the firing rate to the wave field itself [7, 22],
| (12) |
The solution ϕ can be sought as a Fourier integral expansion
| (13) |
for wave modes with frequencies ωk and wave numbers k (where “c.c.” denotes complex conjugate), that results in a set of coupled equations for time dependent complex amplitudes ak (t) ≡ a(k, t)
| (14) |
where from (3) the wave mode frequencies are inversely proportional to the wave number
| (15) |
and
| (16) |
where all spectral and spatial integrals are assumed to be taken on the infinite domain [−∞, ∞], the spectral integrals are actually converted to the half infinite domain [0, ∞] as a consequence of the symmetry of ak due to ϕ(x, t) being real (from this point we will omit repeating explicit limits of integration where it does not create ambiguity).
The condition of wave propagation (ω/γ > 1), corresponding to small wave growth or damping during a single wave period, provides natural limits for the spectral (k0, k∞) or spatial (l, L) domains to be taken as cutoffs in a case of presence of large or small scale divergences, i.e.
| (17) |
| (18) |
The existence of spatial scales L ≡ 2πΩ/γe and l ≡ 2πγd/Ω does not mean that the waves only propagate inside some fixed [l, L] domain that requires additional boundary conditions. Both the spectral (k0, k∞) and the spatial (l, L) scales simply emphasize the fact that for any frequency it is the combination of the excitation γe and the damping γd that defines an extent where any disturbance of the scalar potential ϕ may be assumed to have wave properties.
B. Resonant coupling of wave modes
The nonlinear terms will include a sum of inputs from multiple waves, i.e., where n is the order of the non-linearity. Those resonant conditions will give rise to coupling terms that includes various combinations of . Additional requirements for frequency resonances produces wave turbulence-like [13] selection rules for the coupling terms that are similar to phase coupling terms in a ring of connected oscillators [23].
For waves having typical dispersion properties, that is with the frequencies directly proportional to the wave numbers (ωk ~ kα α > 0), the maximum oscillatory frequency is increasing and going to infinity with the increase of wave numbers. In this case the nonlinear terms produce a direct cascade of wave energy [13] constantly generating larger and larger frequencies. For the inversely proportional wave dispersion, like the waves considered in this paper, the wave energy will be cascaded into smaller frequencies, thus providing a natural mechanism for synchronization of high frequency spiking input and emergence of low frequency rhythms.
This model is also able to characterize another important phenomenon whose existence is supported by an abundance of experimental data – feedback between field potential and firing rate [7, 22]. The feedback can be represented through nonlinear coupling. This will be demonstrated using the simplest quadratic form for the coupling which can arise through many different processes. More complex feedback can be generated by higher order coupling terms of course but that discussion is beyond the scope of this current paper. The quadratic form of coupling results in
| (19) |
Using symmetry conditions and ω−k = −ωk (a consequence of ϕ*(x) = ϕ(x)) this can be rewritten as
| (20) |
The corresponding conditions for the frequency resonances ωk = ±ωk′ ± ωk″ allow the expression of the non-linear resonant coupling by extraction of only the relevant terms as
| (21) |
where only three out of four wave number resonances appear, as the resonance k + k′ + k″ = 0 is not possible [13], and , and , are the real solutions of quadratic equations 1/k±1/k′±1/|k−k′| = 0.
C. Non–resonant coupling of wave modes
An important addition to these coupling terms arises from the inverse proportionality of frequency and wave number in the dispersion relation (15). The difference of frequencies of nonlinear non-resonant harmonics is decreasing and going to zero with increasing wave number, thus effectively allowing a closed form expression for the limit of k → ∞, an effect that is absent for coupling of waves with directly proportional dispersion. To illustrate this, we will estimate the non-resonant nonlinear input to the k0 wave mode.
| (22) |
where
The approximate expression for the forced oscillations solution can be obtained assuming that all the forcing input originates from the scales of k = k0 (the forcing term γe/k2 in (14) is largest when k = k0). Therefore we will derive the non–resonant input term only for k = k0, thus neglecting nonlinear and damping terms for any k > k0 (more correctly, for any k that are not in resonance with k0 or for . At the limit k → ∞ all frequency deltas δω1−4(k) → ωk0 ≡ ω0 and k − k0 ≈ k, hence approximately we can estimate the non–resonant term as
| (23) |
To estimate forced oscillations terms required in evaluation of the integral (23), one can write from (14), (20) and (22) that
| (24) |
Looking again for an approximate large k solution (ak−k0 ≈ ak for k ≫ k0) and keeping only terms that include ak0 (assuming that the amplitude ak0 is small and can be considered constant relative to any of the δω(k) terms), we can approximately write that
| (25) |
| (26) |
where C1…4(k) and C(k) = Σ Ci(k) are some complex integration constants that we assume to have random phases with the amplitude independent of k, hence, we can use that .
Therefore, the non-resonant input term (23) depends on ak0 and t as
| (27) |
where terms with C(k)C(k) and its complex conjugate vanish because of the randomness of the phases.
More accurate estimation of will require evaluation of integrals similar to
| (28) |
that, although resulting in more complex expressions, nevertheless have the same e−iωk0t asymptotic behavior for t → ∞ to (the details of the derivation of InR and an evaluation of the asymptotic limit t → ∞ are presented in Appendices E and F).
Because the exact numeric coefficients that appear in (27) (or the exact form of algebraic time dependence in (F8) to (F11) for the leading asymptotic terms) may depend on some arbitrary initial background wave spectra, in the following analysis we will introduce some free parameters that can be used to study and characterize possible effects of various linear and nonlinear (e.g. resonant and non-resonant) terms.
Therefore, an equation for the longest wave length brain mode ak0 that integrates the nonlinear nonresonant input from smaller spatial scales can be written as
| (29) |
where γ describes the excitation strength and β is the strength of non-resonant coupling. The last term (with the parameter α) was included to ensure that coupling does not produce an overall mean field excitation, as well as to ensure that in the limit of vanishing coupling (β = 0) the solution of (29)
| (30) |
(where C0 is a constant) has the same asymptotic behavior for t → ∞ as the solution of (11) obtained with time and space scale independent forcing.
The equation (29) can be converted to a system of equations for the amplitude A and phase B (ak0 = AeiB) as
| (31) |
| (32) |
where δA and δB were added to introduce tunable phase delays [24].
D. Solution for non-resonant coupling
The system of equations (31) and (32) includes nonresonant input from all wave modes, but the resonant term (21) should also be added together with additional equations for resonant wave amplitudes that participate in resonant coupling. We will consider this complete system later, but first we will investigate the behavior of the nonlinear non–resonant part only.
Fig. 5 shows the results of numerical solution of the system (31) and (32) for several different sets of parameters. The time evolution of the highest frequency, longest wave length mode exhibits a variety of types of oscillatory behavior, ranging from slightly nonlinear modified sinusoidal shapes to more nonlinear looking shapes similar to network attributed alpha waves or μ-shaped oscillations [10]. Increase in the level of activation γ produces nonlinear signal with the spike–like shape of a single neuron firing.
FIG. 5.
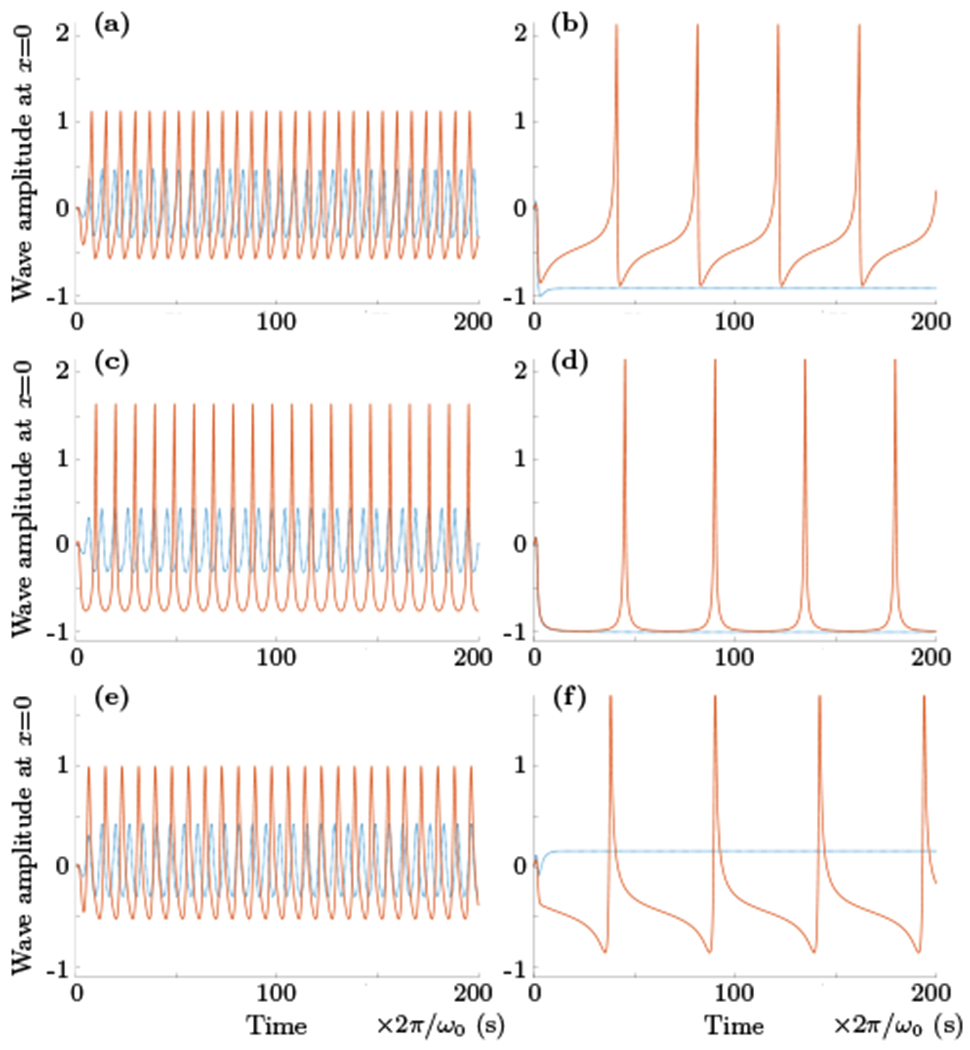
The results of numerical integration of the system (31) and (32), that is time evolution of potential ϕ(x, t) at x = 0 or A(t) cos(B(t) + ωk0t). For all plots the values of ωk0, k0, α and β were set to be equal to 1, δA = 0, and γ and δB were varied. The top,middle and bottom rows show plots for phase delay δB equals to 3π/4, π/2 and π/4 respectively. The left columnn displays transformation from weakly nonlinear oscillations shown by blue dotted lines for γ = 0.75 to more strongly nonlinear regime (solid line, γ = 1.5 (top and bottom) and 2.25 (middle)). The right column shows the strongest nonlinear spiking–like time evolution of potential ϕ (solid line, γ = 2.55 (top and bottom) and 2.96 (middle)) and its transformation to non-oscillatory (blue dotted line) regime for γ = 3 (time and amplitude units are arbitrary).
E. Critical point and synchronized spiking
It is interesting that this spiking-like solution of system (31) and (32) appears near the critical point, and the oscillatory state undergoes bifurcation and transitions to non-oscillatory regime as γ reaches the value above some critical point. To illustrate the reason for this transition we will consider the simplest case of δA = 0 and δB = π/2 (although different δA,B values can be used for a similar analysis as well). The non–oscillatory regime can be reached if dA/dt → 0 and dB/dt → −ωk0 as t → ∞. Then from (31) and (32) one can write that at t → ∞
where B0 is some arbitrary constant phase. Therefore, the non–oscillatory state requires that γ satisfies to
| (33) |
Hence for
| (34) |
the non-oscillatory solution is not possible. The simulations shown in the bottom panels of Fig. 5 confirm that the critical γ value is indeed 3 when ωk0 = α = β = 1. Similar analysis when δA = δB gives the critical γ value equals to (2 − cos (π/3))/sin(π/3) ≈ 1.732.
We would like to emphasize that all variety of models used for a description of action potential neuron spikes, starting from the seminal model by Hodgkin and Huxley [12], and finishing with many dynamical integrate-and-fire models of neuron [10], are based on an approximation of several local neuron variables, e.g. membrane currents, gate voltages, etc., and defining the relations between these local properties. Contrary to this and rather unexpectedly, the equation (29) is obtained through an integration of a large number of oscillatory brain wave modes non-resonantly interacting in an inhomogeneous anisotropic media and shows spiking pattern solutions emerging as a result of this non–resonant multi–mode interaction rather than as a consequence of empirical fitting of nonlinear model to several locally measured parameters. It is also important that the equation (29) can not be separated into “fast” and “slow” parts as typically required for functioning of “traditional” neuron models. Because of this we would like to reiterate that this equation should not be viewed as a single neuron model and should not be considered as an alternative to any of the single neuron models [25]. It describes a mechanism for generation of synchronous spiking activity as a result of a collective input from many non-resonant wave modes. The transition to the synchronous spiking activity occurs in the vicinity of the critical point where a bifurcation from oscillatory to non-oscillatory state happens, thus indirectly supporting the sub-criticality hypothesis [26] of brain activity.
F. Bursting activity
As a next step we employed a more complex expression for the total input from the non-resonant terms by including a sum of all InR integrals (28) instead of a single e−iωk0t exponent input. Fig. 6 shows simulation results for several parameter sets with the same values as were used for plots of Fig. 5 (wk0 = β = k0 = 1, δA = 0). The numerical solution shows more complex behavior that now includes modulation of the spiking rate with lower frequency and emergence of burst-like train of spikes, effects often observed in different types of neuronal activity [10].
FIG. 6.
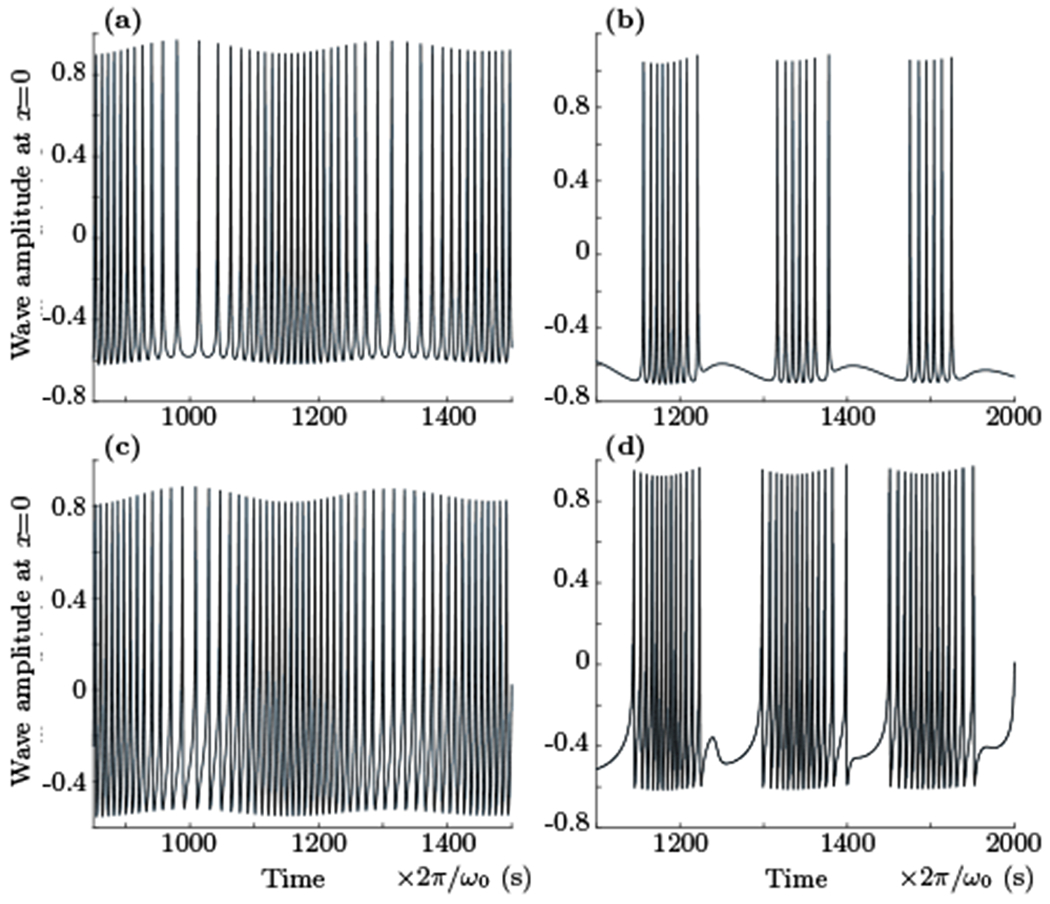
The results of numerical integration of the system (31) and (32) when exponential term was replaced by InR integrals (28) with the region of integration set to 50k0 < k < 1000k0. For all plots the values of ωk0, k0, α and β were set to be equal to 1, δA = 0, and γ and δB were varied. The top and bottom rows show plots for phase delay δB equals to 3π/4 and π/2 respectively. The left column displays modulation of spiking rate for γ = 4.5. The right column shows the nonlinear bursting of spikes for γ = 5.1 (time and amplitude units are arbitrary).
G. Emergence of low frequency brain rhythms
And finally, we considered a model that combines a chain of inputs from nonlinear modes generated due to resonant terms (21) into a set of non-resonant mode equations (29), that results in a system of equations for mode amplitudes ak for k = k0 … kN
| (35) |
where the parameter λ describes the strength of resonant coupling between modes.
We would like to mention two new, rather important, and not entirely obvious features that appear in the nonlinear system (35), but are absent for phase coupled oscillator models (e.g. [23]). First, the system (35) may show multiple critical point transitions corresponding to multiple linear resonant frequencies ωki as activation level γ increases. Second, sufficiently close to the critical point the strong modification of an effective wave mode frequency by the non–resonant input from multiple wave modes may result in nonlinear resonances with different modes that are not possible for linear waves, thus providing a mechanism for emergence of unexpected oscillations difficult to explain by more simplistic models.
Figs.7 and 8 show results of numerical simulation of the system (35), clearly indicating that weak nonlinear resonant coupling between just three modes with frequencies of ωk0, and is capable of explaining an emergence of periodic activity with frequencies up to 100–1000 times lower then the linear frequencies of participating modes. We would like to emphasize again that the system (35) can not be separated into traditional “slow” and “fast” subsystems, hence the low frequency component can not be explained by a modulation [27] of the “fast” subsystem with oscillations of the “slow” part.
FIG. 7.
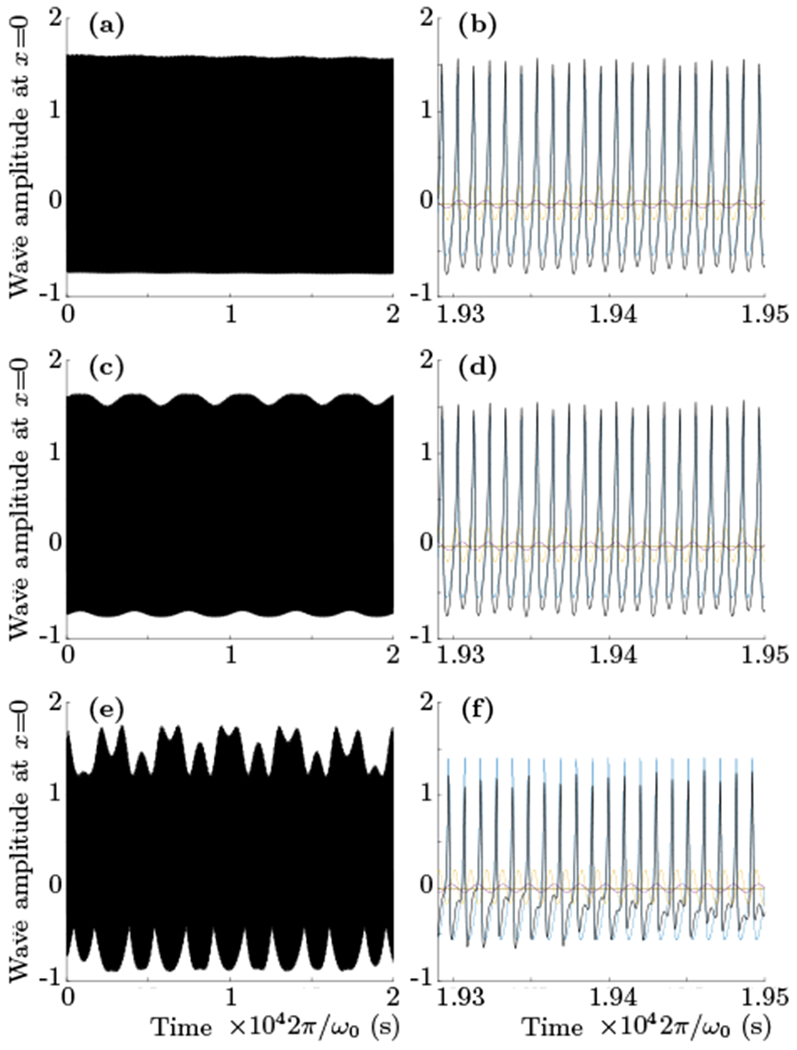
The results of numerical integration of the system (35) for different values of weak resonant coupling λ = 0.001, 0.01,0.05 (top, middle and bottom rows respectively). For all plots the values of ωk0, k0, α and β were set to be equal to 1, and δA = δB = δ = 3π/4. The value of γ is 1.535, that is sufficiently far from the criticality, but nevertheless large enough to modify an effective period for k0 mode to be close to that of k1. The total potential ϕ is plotted with the black and different colors show the oscillations of the individual modes. All plots clearly show emergence of low-frequency component as a result of increase of weak resonant coupling (time and amplitude units are arbitrary).
FIG. 8.
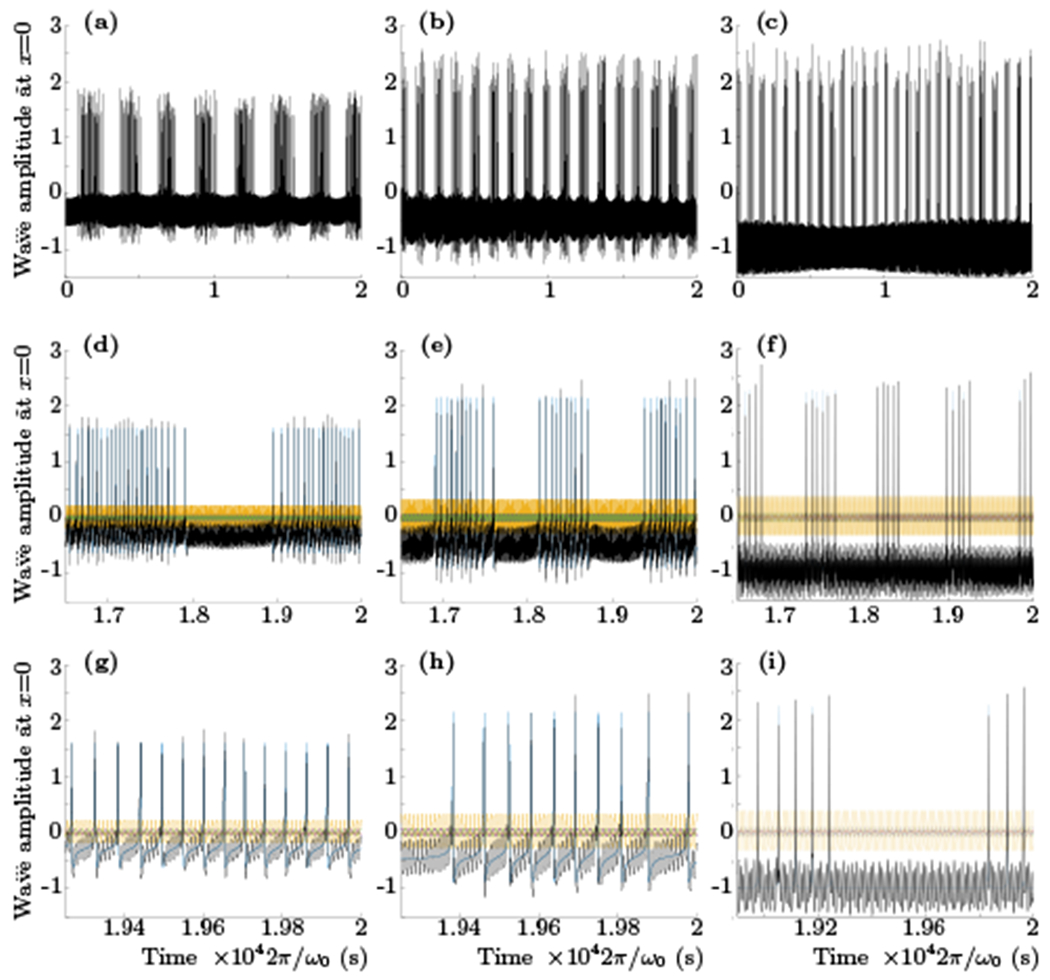
The results of numerical integration of the system (35). For all plots the values of ωk0, k0, α and β were set to be equal to 1 and the resonant coupling λ was 0.05. Different values of δ were again used in real and imaginary parts (as in (31) and (32)) with δA = 3π/4, 0, 0, δB = 3π/4, 3π/4, π/2 and close to the critical values of γ = 1.731, 2.575, 2, 9969 for the left, middle and right columns respectively. The total potential ϕ is plotted with the black and different colors show the oscillations of the individual modes. All plots show that when γ is sufficiently close to criticality a week coupling produces jumps from subcritical to supercritical regimes with amazingly regular low–frequency quasiperiodicity (time and amplitude units are arbitrary).
In Fig. 7 the high frequency spiking is generated with the level of activation γ = 1.535. This activation level is still relatively far from criticality but produces spikes with an effective rate that is close to the next linear resonance frequency. The first, second and third rows clearly show that small increase of the resonant coupling (0.001, 0.01 and 0.05 respectively) results in appearance of component with significantly lower frequency.
Fig. 8 shows several simulations with the level of activation that is close to criticality for the selected set of parameters in each column. The small resonant coupling λ = 0.05 in this case results in more profound effect of quasiperiodic shift of oscillations back and forth from subcritical to supercritical regimes effectively turning spiking on and off with low frequency. Prediction of the actual period of nonlinear low frequency oscillations from the model parameters, e.g. distances from the critical points and other resonances, phase delays, etc., is an interesting open question that will be considered in future work.
IV. DISCUSSION AND CONCLUSIONS
In conclusion, in this paper we have presented an inhomogeneous anisotropic physical model of wave propagation in the brain cortex. The model predicts that in addition to the well-known damped oscillator-like wave activity in brain fibers, there is another class of brain waves that are not directly related to major fibers, but instead propagate perpendicular to the fibers along the highly folded cortical regions in a weakly–evanescent manner that results in their persistence on time scales long compared to waves along brain fibers. The waves can potentially propagate in any direction, including the direction along the fibers or in the direction of the inhomogeneity gradient. However, the dissipation of the waves is smallest when they propagate cross fibers, therefore, on average the cross fiber direction of propagation should be seen more often. For the first time, we have obtained the dispersion relation for those surface cortex waves, and have shown, both analytically and numerically, a plausible argument for their existence. Through numerical analysis we have developed a procedure to generate an inhomogeneous and anisotropic distribution of conductivity tensors using anatomical and diffusion brain MRI data. While the detailed numerical studies of effects and importance of these waves and their possible biological role are beyond the scope of this paper, we have presented preliminary results that suggest that the time of life for these wave–like cortex activity events may significantly exceed the decay time of the typical axon action potential spikes. Thus, they can provide an persistent neuronal response in the cortical areas generated as a result of “along–the–axon” spiky activations.
The ranges of parameters for the waves produced by our model are in agreement with those presented by several studies [7] that show evidence that electrostatic field activity in several areas of animal and human brains are traveling waves that can affect neuronal activity by modulating the firing rates [7] and may possibly play an important functional role in diverse brain structures [8]. The natural self organization of these traveling waves into loop–like structures that our model produces agrees well with recently detected [6] cortical wave activity spatiotemporally organized into circular wave-like patterns on the cortical surface. Self-propagation of endogenous electric fields through a physical cut in vitro when all mechanisms of neuron to neuron communication has been destroyed [9] can potentially be attributed to these waves as well. We have also demonstrated that the peaks these wave loops would induce in EEG spectra are consistent with those typically observed EEG data.
Direct experimental results have shown that even despite the small amplitudes of the external field potentials relative to the threshold of a spiking neuron, external fields can play a substantial role in the spiking activity and “even very small and slowly changing fields that triggered Ve changes under 0.2 mV led to phase locking of spikes to the external field and to a greatly enhanced spike-field synchrony” [28]. Therefore our models ability to predict regions of cortex where external wave activity can emerge and form a sustained loop pattern has the potential to be important for understanding where the neuron spiking synchronization will have better chances to be achieved, hence it can provide substantial input in understanding effects on neural information processing and plasticity.
The unusual dispersion properties of those waves provide a universal physical mechanism for emergence of low frequencies from high frequency oscillations. The simple quadratic nonlinearity introduced as a coupling source for the wave model allowed the derivation of an equation for a nonlinear form of those waves by taking a limit for a large number of non-resonantly interacting wave modes, which we emphasize is a limit that exists only due to the unusual dispersion properties of the waves. The collective input from those non–resonant modes results in nonlinear spiking–like solutions of this equation and an existence of a bifurcation point from oscillatory to non–oscillatory regime. The multi–mode nonlinear system that includes both non-resonant and resonant coupling between multiple modes shows emergence of low frequency modulations as well as strongly nonlinear low frequency quasiperiodic oscillations from subcritical to supercritical regimes. This theory thus provides a basis for relating quantitative tissue microstructural properties (such as anisotropy and inhomogeneity) and measurable larger scale architectural features (e.g, cortical thickness) directly to electrophysiological measurements being performed with increasingly sensitive techniques (such as EEG) within a wide range of important basic and clinical research programs. The ability of this new physical model for the generation, propagation, and maintenance of brain waves may have significant implications for the analysis of electrophysiological brain recording and for current theories about human brain function. Furthermore, the dependence of these waves on brain geometry, such as cortical thickness, has potentially significant implications for understanding brain function in abnormal states, such as Alzheimer’s Disease, where cortical thickness changes are evident, and the dependence on tissue status may be important in conditions such as Traumatic Brain Injury, where tissue damage may alter its anisotropic and inhomogeneous properties.
ACKNOWLEDGEMENTS
LRF and VLG were supported by NSF grants DBI-1143389, DBI-1147260, EF-0850369, PHY-1201238, ACI-1440412, ACI-1550405 and NIH grant R01 MH096100. Data were provided [in part] by the Human Connectome Project, WU-Minn Consortium (Principal Investigators: David Van Essen and Kamil Ugurbil; 1U54MH091657) funded by the 16 NIH Institutes and Centers that support the NIH Blueprint for Neuroscience Research; and by the McDonnell Center for Systems Neuroscience at Washington University. Data collection and sharing for this project was provided by the Human Connectome Project (HCP; Principal Investigators: Bruce Rosen, M.D., Ph.D., Arthur W. Toga, Ph.D., Van J. Weeden, MD). HCP funding was provided by the National Institute of Dental and Craniofacial Research (NIDCR), the National Institute of Mental Health (NIMH), and the National Institute of Neurological Disorders and Stroke (NINDS). HCP data are disseminated by the Laboratory of Neuro Imaging at the University of Southern California. The EEG data is courtesy of Antigona Martinez of the Nathan S. Kline Institute for Psychiatric Research.
Appendix A: Spherical shell cortex model
We first provide details about the procedures used for generating inhomogeneous and anisotropic components of the permittivity scaled conductivity tensor Σ.
Spherical shell cortex model is represented by fixed anisotropy tensor σij(r) ≡ σij scaled by a radial inhomogeneous density ρ(r) ≡ ρ(r), such that the total conductivity tensor Σij(r) is defined by
| (A1) |
where σij is a constant, anisotropic, positive semidefinite symmetric tensor and ρ(r) is piecewise continuous function of radius r (0 ≤ r ≤ 1)
FIG. 9.
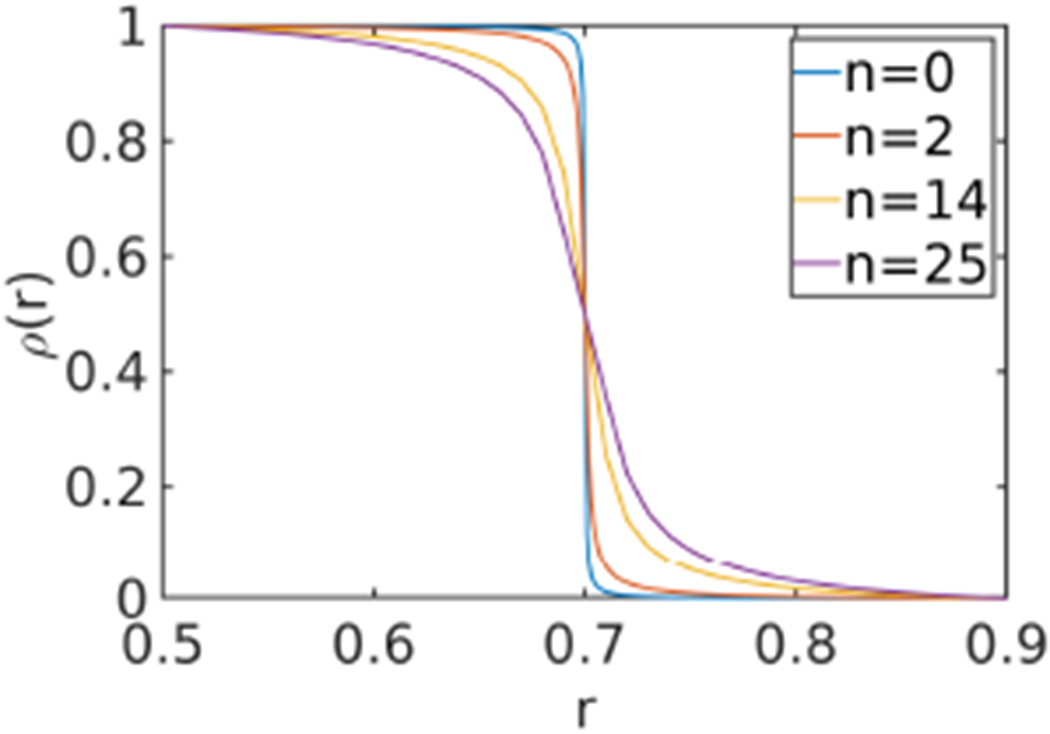
Plot of ρ(r) for different n
The spherical shell cortex wave simulations include three different anisotropic tensor σij choices,
| (A2) |
where (for ε = 0) σ(1) represents the conductivity tensor used in analytical solution of equations (10) of the paper, i.e. currents only in z direction, σ(2) represents different orientation, where currents are allowed in the direction of 45° relative to all axis, and σ(3) represents more complicated current anisotropy, with crossing currents flowing in x and z direction, but with no currents in y direction.
Parameters n, r0 and r1 used to control the thickness of the inhomogeneous “cortical” layer (r0=0.5, r1=0.9, α∞=500 and n =0,2,14 and 25 used for Figs. 10 to 13).
Appendix B: Cortical fold model
For cortical fold model the conductivity tensor Σij(r) is again defined as a product of inhomogeneous ρ(r) and anisotropic σij(r) parts (A1), but both parts are now functions of brain locations.
1. Inhomogeneity estimation
The inhomogeneous density function ρ(r) is estimated from high resolution anatomical MRI data by processing it with SWD [17] (skull stripping, field of view normalization, noise filtering) and then registering to MNI152 space [29, 30] with SYM-REG [19]. The final 1mm3 182x218x182 volume is used as the inhomogeneous density ρ(r).
2. Anisotropy estimation
For the anisotropy tensor σij(r) several different test cases were employed.
a. Fixed anisotropy orientation and value
The same σ(1), σ(2) and σ(3) fixed (location independent) anisotropic tensors as in the spherical shell cortex model (A2) were assigned to every location in the brain. This is the simplest case that may allow to separate the effects of inhomogeneity and anisotropy on loop pattern formation.
b. Varying anisotropy orientation and fixed anisotropy value
Multiple diffusion direction and diffusion gradient strength MRI data were used to estimate diffusion tensor Dij [31].
The anisotropy orientation was estimated using eigenvector d(1) of the diffusion tensor Dij with the largest eigenvalue . The anisotropy tensor σij(r) was defined as
| (B1) |
where the value of anisotropy is constant across the volume (ε = 0, 0.01 and 0.1 were used for different test examples). R is a rotation matrix between directions (0,0,1) and d(1) ≡ (x, y, z) that can be expressed as
| (B2) |
c. Varying anisotropy orientation and value
Similarly to the previous case the diffusion tensor Dij was estimated for each voxel and eigenvector d(1) with the largest eigenvalue was used to define the anisotropy tensor major axis. The position dependent anisotropy value was defined by intoducing parameter ε as either or (in both cases resulting in axisymmetric form of the conductivity tensor) and also using two different values and for σ22 and σ11.
d. Varying anisotropy orientation and value estimated from microstructure fiber anisotropy
The microstructure anisotropy at the level of a single cell and its extracellular vicinity may be significantly higher than detected by diffusion MRI estimates. Recent measurements of effective impedance that involve both intercellular and extracellular electrodes [32] show significantly lower conductivity (by orders of magnitude) than conductivity obtained by measurements between extracellular electrodes only. Although attributing this to lower than typically assumed conductivity (or higher impedance) of extracellular medium may be questionable [33], this clearly confirms high anisotropy for the effective conductivity that should be used for analysis of effects of intercellular and membrane sources (and these are the most important type of sources for generation of surface brain waves considered in this paper). This may be important for future generation and refinement of the macroscopic conductivity estimates from microstructure data.
We assumed here that anisotropic form of with ε = 0.001, 0.01 or 0.1 can be used to describe different levels of intercellular conductivity as well as microstructure extracellular conductivity in the vicinity of cell membranes (where z-direction corresponds to the direction of the fiber). Using full brain tractography results [34] we generated the anisotropic part of the conductivity tensor σ(r) in voxel at r location as an average over all fiber orientations assuming N fibers inside the voxel with Rk orientation matrix for every fiber k, i.e.
| (B3) |
with the complete form of the conductivity tensor Σ again given by (A1).
Appendix C: Wave trajectory integration
To obtain the trajectory of a brain wave with frequency ω emitted at a point r0 with an initial wave vector k0 we substitute the inhomogeneous anisotropic conductivity tensor Σ in the wave dispersion relation (imaginary part of eq. (3) of the paper)
| (C1) |
and obtain wave ray equations as
| (C2) |
| (C3) |
| (C4) |
| (C5) |
We integrate these equations starting at τ=0, t = 0, r = r0 and k = k0 to trace the wave trajectory t(τ), r(τ), and k(τ).
For numerical integration it is beneficial to split k into magnitude k and direction parts (, and ), rewrite the last two equations as
| (C6) |
| (C7) |
where in the last equation the right hand side is orthogonal to to guarantee that , and the algebraic expression (C1) was substituted for the differential equation for wave vector magnitude k.
Appendix D: Wave dissipation and excitation
An integral along the wave trajectory t(τ), r(τ) and k(τ)
| (D1) |
with any appropriate model form of wave excitation γexc describes a change of wave energy W along its path. This may allow the study of many interesting questions of brain wave dynamics, i.e. to identify potential active area where wave intensity may grow as a result of certain frequency and/or spatial distributions of neuronal spiky activation, or to estimate the spatial extent of coherent activation area as a result of some particular point sources, or to find when and/or how these waves may potentially become important in triggering neuronal firing, that is to study possible mechanisms of synchronization and feedback, etc.
Appendix E: Derivation of InR integral
We assume that the initial amplitude values for all wave modes are set at some random level ϵ(k) and we can write for ak(0)
| (E1) |
where for the initial phase ψ(k) we assume that it is a continuously differentiable function up to at least the second derivative with dψ(k)/dk → 0 at both k → 0 and k → ∞ and with the derivatives bounded for any k (including at k → ∞ and k → 0), i.e. |dψ(k)/dk| < M and |d2ψ(k)/dk2| < M, where M is a constant. For the initial amplitude ϵ(k) will assume a power law type dependence ϵ(k) ~ kν.
The linear solution of (14) then will be
| (E2) |
As the fastest growing linear solution for any k∞ ≥ k ≥ k0 corresponds to k = k0, we will derive a nonlinear equation for ak0 evaluating (23) and including only input from this ak0 mode in the evaluation of nonlinear terms for the rest of ak modes, hence for k = k0
| (E3) |
and for k > k0
| (E4) |
where in (E4) we don’t need to keep linear terms as they either result in decaying solution or their linear growth is exponentially slower than the linear growth due to forcing by the ak0 term when k > k0 and , therefore we ignored the linear terms obtaining (24). We also don’t need to keep them in nonlinear parts as, due to our propagating waves requirements (17) and (18), they only result in the appearance of a small imaginary components of frequencies ωk.
Therefore we can write an approximate forced solution for (E4) (without using the k ≫ k0 condition this time) as
| (E5) |
Now we can substitute (E5) into akak±k0 and products of (E3) to obtain the nonlinear equation for ak0. Substituting it only into a single part of the products and using (E1) for the second part will result in a set of integrals
| (E6) |
that may be divergent at k → 0 or k → ∞ (therefore the k = k0 and/or k = k∞ cutoffs should be used) and with any possible resonances in δωj(k) ignored (i.e. taken as a principal value integrals). The obvious results of those integrals is just a small nonlinear modification of ωk0 frequency (a nonlinear frequency shift).
If we substitute (E5) into both parts of products we will obtain expressions similar to (28) integrals where we now also included initial amplitudes ϵ(k) and phases ψ(k)
| (E7) |
where a Taylor expansion was used to replace with and the variable of integration for the second expression has been changed to k/k0. The integral limits are not shown (assumed to be from 0 to ∞), but as the integrals may be divergent at k = 0 and/or k = ∞, the cutoffs at k = k0 and/or k = k∞ may be applied if needed.
Appendix F: Evaluation of InR asymptotic at t → ∞
Different signs in (E7) can result in different asymptotic expressions at t → ∞ therefore we will independently evaluate two expressions that have different leading terms in the expansion. First, we will consider an integral
| (F1) |
and then we will do the evaluation for the integral with a different sign in the integrand expression
| (F2) |
The signs in k ± 1 and ±dψ/dk are not important for evaluation of the leading expansion term, hence we have chosen the plus sign for simplicity.
We will first introduce a change of variables
| (F3) |
selecting from two possible solutions k(x) the one that corresponds to 0 < k < ∞ domain. That will result in
| (F4) |
Now we will introduce another change of variable
| (F5) |
as Ψ is bounded anywhere in the leading order of t → ∞ we can substitute x with an expression
| (F6) |
where we introduced z = y + iΨ. This change of variables results in
| (F7) |
Taking integrand expansion at t → ∞ we can find the leading order term of expansion at t → ∞ as
| (F8) |
Similarly for the integral with a different sign in the integrand expression we obtain
| (F9) |
The asymptotics (F8) and (F9) are valid if does not go to zero. When this is not true the expressions for and become
| (F10) |
and
| (F11) |
All the above expressions show that the oscillatory mode e−iωk0t emerges as result of integration of multimode nonresonant terms but the conditions on the initial amplitudes and phases of the modes determine if this oscillation mode slowly (algebraically not exponentially) grows or decays at large times.
The wavenumber spectral power |ak|2 ~ kμ can be related to the frequency spectral power |aω|2 ~ ωτ as
| (F12) |
therefore, τ = −μ − 2. Of course, this equality gives the exact relation between frequency and wavenumber spectra only if just the wave modes with ωk = Ω/k dispersion contribute to all temporal and spatial oscillation modes and this is not necessarily true as other propagating and non–propagating modes can be present. Nevertheless, it outlines the general trend that the spectra with a steeper frequency dependence (with smaller τ or larger μ ≡ 2ν, that is with a greater “energy” of lower frequency modes relatively to higher frequency modes) will generate asymptotically growing high frequency e−iωk0t oscillations, whereas more shallow frequency spectra (with large τ or smaller μ ≡ 2ν, that is with increased presence of high frequency modes) will show asymptotic decay of the high frequency e−iωk0t oscillations. Thus the asymptotic expressions show the existence of nonlinear processes that provide a mechanism for spectral regulation.
Appendix G: Persistent wave loop patterns
One of the interesting questions is the possibility of persistent pattern formation/self–organization from a randomly emitted distribution of brain waves influenced by inhomogeneous anisotropic structure of their dispersion. Considering a simplest case of fixed difference between wave excitation and dissipation, i.e. assuming propagation of wave packets of fixed width (exponentially decaying) and searching for any closed parts of wave trajectories (loops) that are shorter than the packet width can provide a clue about possible answer. Fig. 4 as well as Figs. 10 to 25 (and hyperlinked movies) show formation of persistent loops for a variety of wave packet initial conditions as well as for different models of conductivity tensor inhomogeneity and anisotropy constructed from dMRI or whole brain tractography.
Examples of wave trajectories and emergent persistent loop patterns for the spherical shell cortex model with varying amounts of tensor anisotropy and inhomogeneous shell layer thickness (Figs. 10 to 13).
Examples of wave trajectories and emergent persistent loop patterns for cortical fold geometry with different approaches used for estimation of inhomogeneity and anisotropy are shown in Figs. 14 to 25. Among those examples are several simple cases with variable inhomogeneity and fixed anisotropy (similar to the above spherical shell cortex model) as well as with more complex estimates of anisotropy based on multiple diffusion gradients MRI (dMRI) acquisitions. Assuming a linear dependence between diffusion and conductivity tensors [35] several combinations of the diffusion tensor eigenvectors were used to describe the conductivity tensor anisotropy. In a more complex approach, the full brain tractography [18] generated fiber distributions [34] were used to infer anisotropy through direct integration of single fiber anisotropy parameters in each voxel.
All wave trajectory figures are hyperlinked and include references to location of movies showing dynamical development of wave trajectories.
FIG. 10.
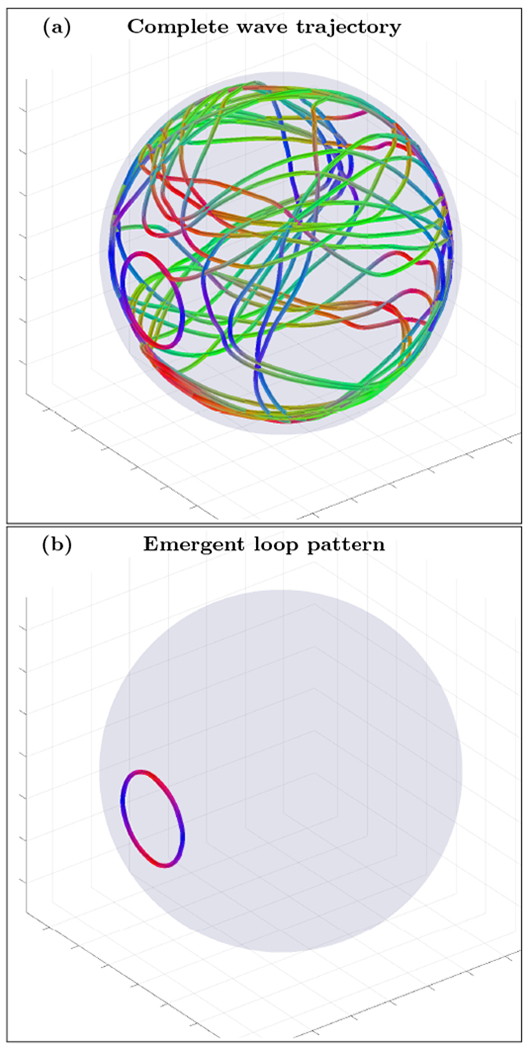
An example of complete wave trajectory (a) and emergent loop pattern (b) for the spherical shell cortex model with crossing fibers anisotropy tensor σ(3) and narrow inhomogeneity layer (n=0, r0=0.5 and r1=0.9). The trajectory was initialized with wave vector inside the inhomogeneous layer with voxel coordinates r=(142,142,142). High resolution movie links: S1-H1/S1-H1, S1-H2/S1-H2. Low resolution movie links: S1-L1/S1-L1, S1-L2/S1-L2.
FIG. 11.
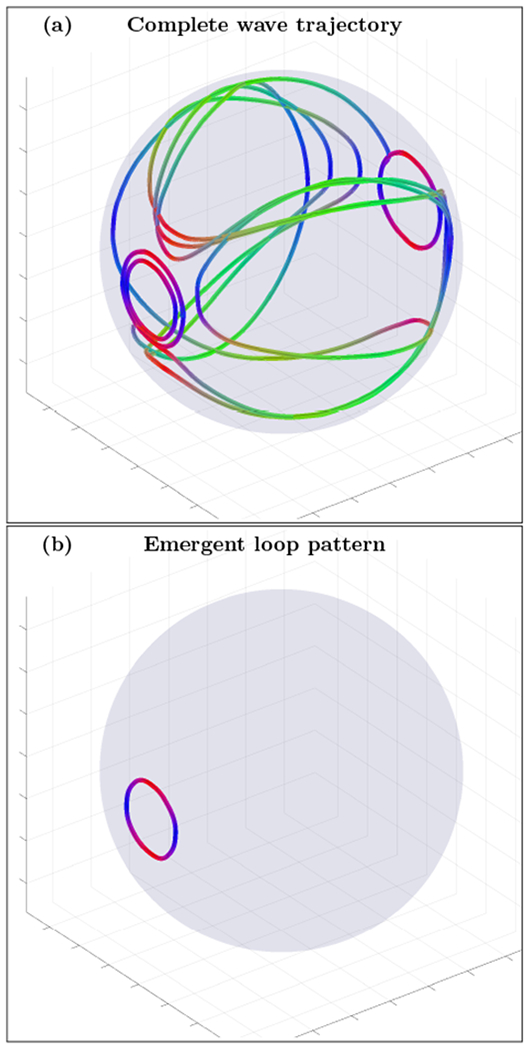
An example of complete wave trajectory (a) and emergent loop pattern (b) for the spherical shell cortex model with crossing fibers anisotropy tensor σ(3) and slightly wider inhomogeneity layer (n=2, r0=0.5 and r1=0.9). The trajectory was initialized with wave vector inside the inhomogeneous layer with voxel coordinates r=(80,33,100). High resolution movie links: S2-H1/S2-H1, S2-H2/S2-H2. Low resolution movie links: S2-L1/S2-L1, S2-L2/S2-L2.
FIG. 12.
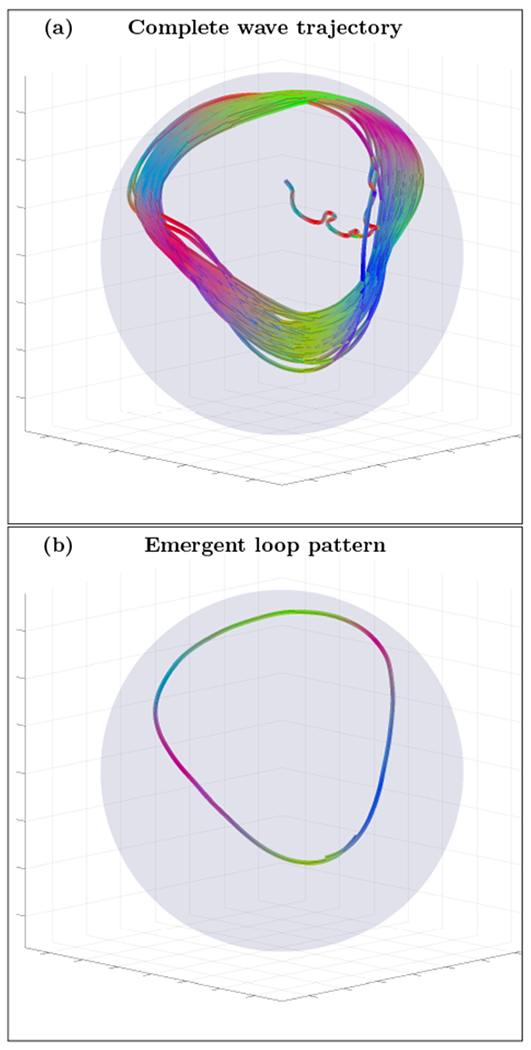
An example of complete wave trajectory (a) and emergent loop pattern (b) for the spherical shell cortex model with 45° orientation single fiber anisotropy tensor σ(2) and wide inhomogeneity layer (n=25, r0=0.5 and r1=0.9). The trajectory was initialized with wave vector inside the inhomogeneous layer with voxel coordinates r=(145,145,145). High resolution movie links: S3-H1/S3-H1, S3-H2/S3-H2. Low resolution movie links: S3-L1/S3-L1, S3-L2/S3-L2.
FIG. 13.
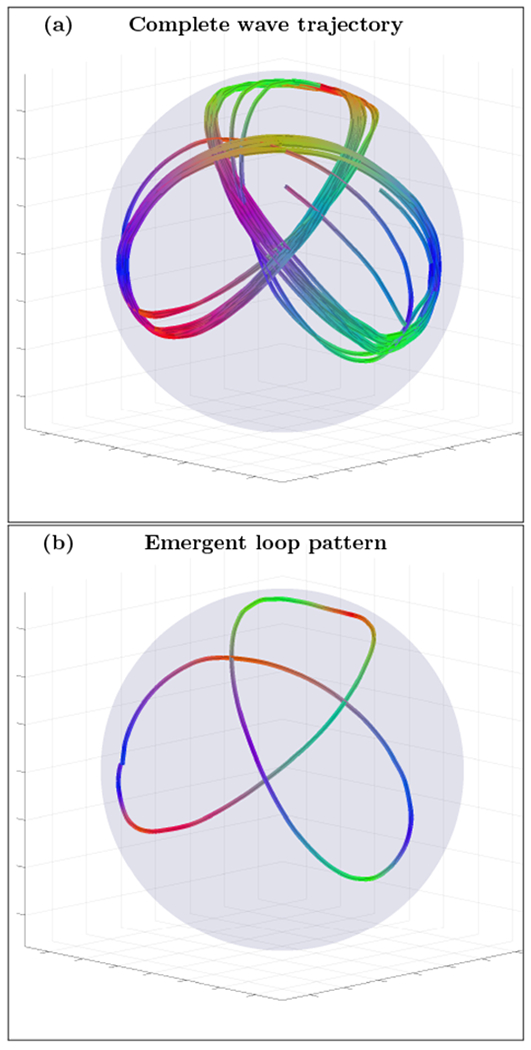
An example of complete wave trajectory (a) and emergent loop pattern (b) for the spherical shell cortex model with 45° orientation single fiber anisotropy tensor σ(2) and intermediately wide inhomogeneity layer (n=14, r0=0.5 and r1=0.9). The trajectory was initialized with wave vector inside the inhomogeneous layer with voxel coordinates r=(141,141,141). High resolution movie links: S4-H1/S4-H1, S4-H2/S4-H2. Low resolution movie links: S4-L1/S4-L1, S4-L2/S4-L2.
FIG. 14.
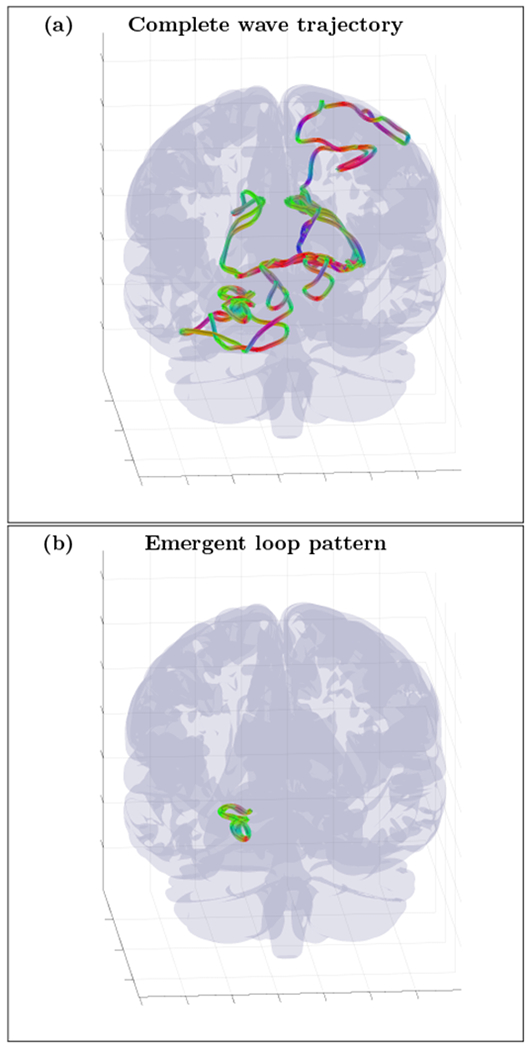
An example of randomly initialized complete wave trajectory (a) and emergent loop pattern (b) for the cortical fold model with inhomogeneity extracted from HRA volume registered to MNI152 space and with diffusion MRI derived position dependent anisotropy tensor . The trajectory was initialized with wave vector k=(−0.75, 0.23, −0.62) inside the inhomogeneous layer with voxel coordinates r=(55,130,130). High resolution movie links: S5-H1/S5-H1, S5-H2/S5-H2, S5-H3/S5-H3. Low resolution movie links: S5-L1/S5-L1, S5-L2/S5-L2, S5-L3/S5-L3.
FIG. 15.
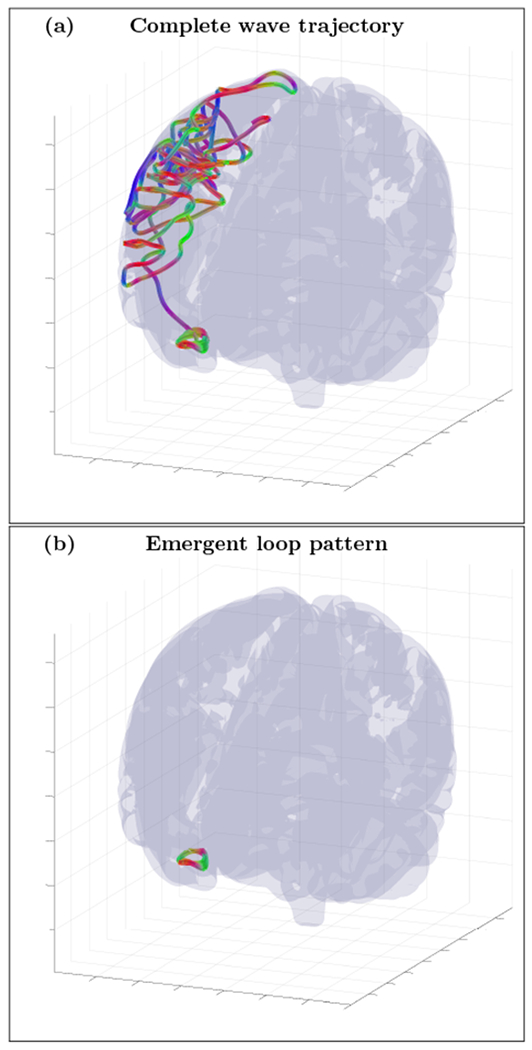
An example of randomly initialized complete wave trajectory (a) and emergent loop pattern (b) for the cortical fold model with inhomogeneity extracted from HRA volume registered to MNI152 space and with diffusion MRI derived position dependent anisotropy tensor . The trajectory was initialized with wave vector k=(−0.9,0.24,0.36) inside the inhomogeneous layer with voxel coordinates r=(66,94,126). High resolution movie links: S6-H1/S6-H1, S6-H2/S6-H2, S6-H3/S6-H3. Low resolution movie links: S6-L1/S6-L1, S6-L2/S6-L2, S6-L3/S6-L3.
FIG. 16.
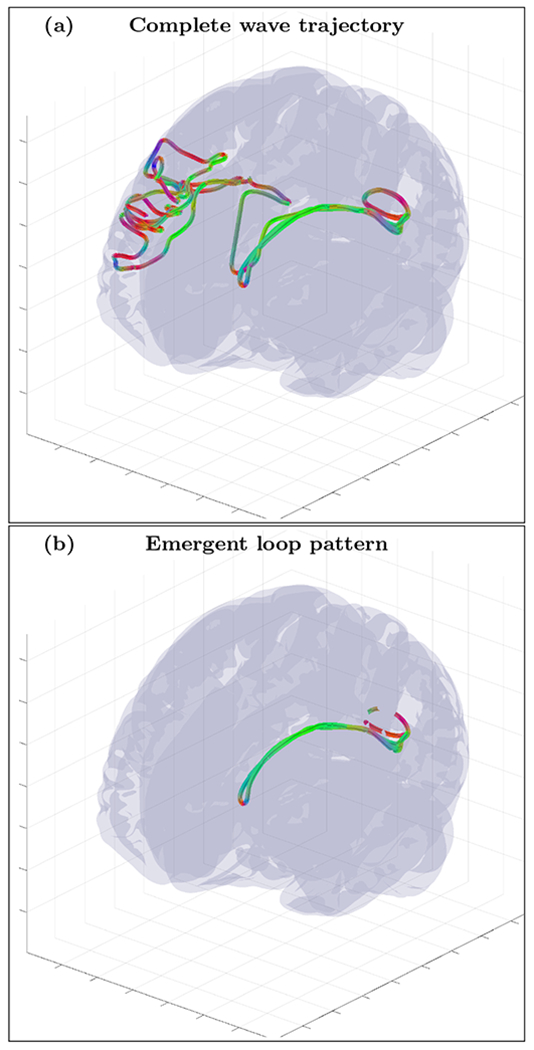
An example of randomly initialized complete wave trajectory (a) and emergent loop pattern (b) for the cortical fold model with inhomogeneity extracted from HRA volume registered to MNI152 space and with diffusion MRI derived position dependent anisotropy tensor and ). The trajectory was initialized with wave vector k=(−0.77,−0.63,0.11) inside the inhomogeneous layer with voxel coordinates r=(49,153,97). High resolution movie links: S7-H1/S7-H1, S7-H2/S7-H2, S7-H3/S7-H3. Low resolution movie links: S7-L1/S7-L1, S7-L2/S7-L2, S7-L3/S7-L3.
FIG. 17.
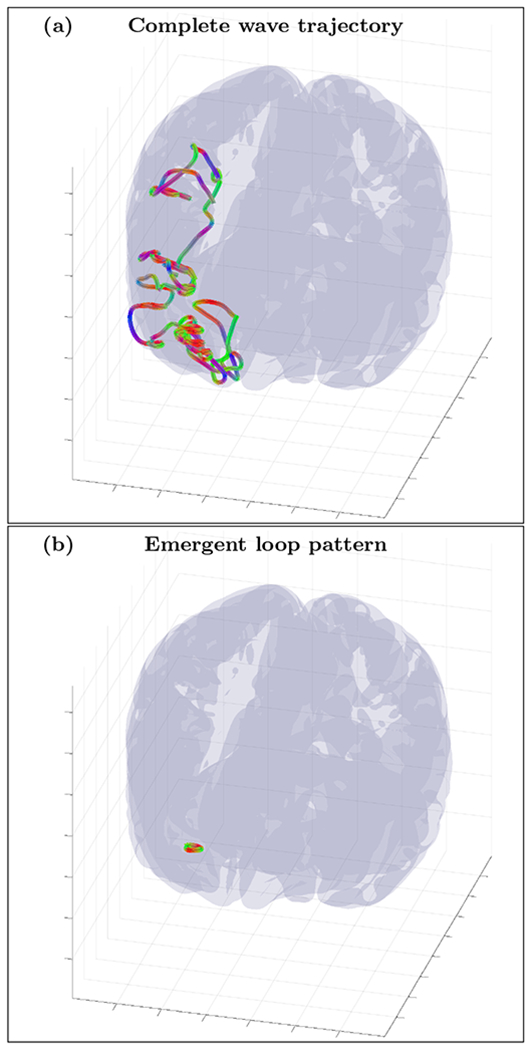
An example of randomly initialized complete wave trajectory (a) and emergent loop pattern (b) for the cortical fold model with inhomogeneity extracted from HRA volume registered to MNI152 space and with fixed anisotropy tensor σ(1) (ε = 0.1). The trajectory was initialized with wave vector k=(0.56,0.58,−0.59) inside the inhomogeneous layer with voxel coordinates r=(72,156,120). High resolution movie links: S8-H1/S8-H1, S8-H2/S8-H2, S8-H3/S8-H3. Low resolution movie links: S8-L1/S8-L1, S8-L2/S8-L2, S8-L3/S8-L3.
FIG. 18.
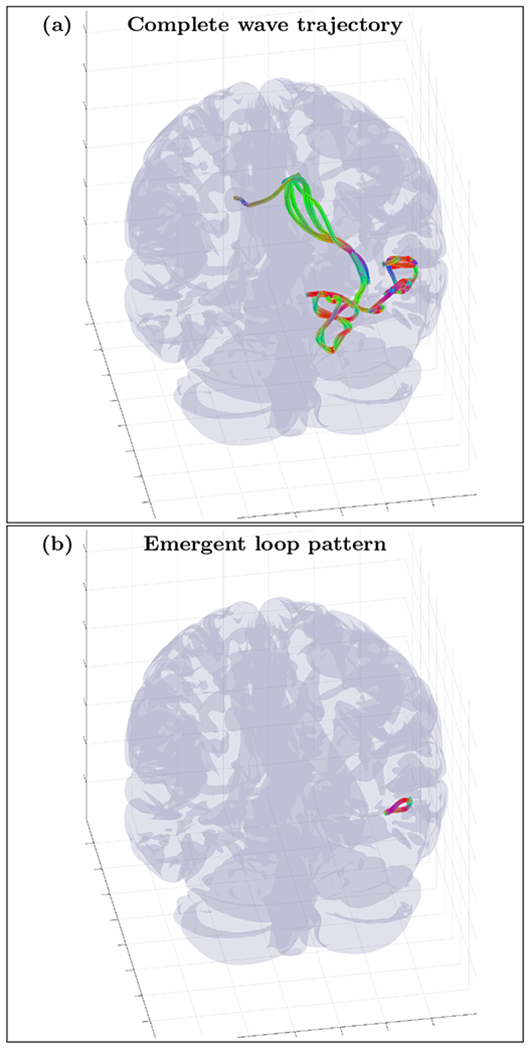
An example of randomly initialized complete wave trajectory (a) and emergent loop pattern (b) for the cortical fold model with inhomogeneity extracted from HRA volume registered to MNI152 space and with diffusion MRI derived position independent anisotropy tensor RT σ(1) R (ε = 0.1). The trajectory was initialized with wave vector k=(−0.13,−0.97,−0.21) inside the inhomogeneous layer with voxel coordinates r=(111,103,110). High resolution movie links: S9-H1/S9-H1, S9-H2/S9-H2, S9-H3/S9-H3. Low resolution movie links: S9-L1/S9-L1, S9-L2/S9-L2, S9-L3/S9-L3.
FIG. 19.
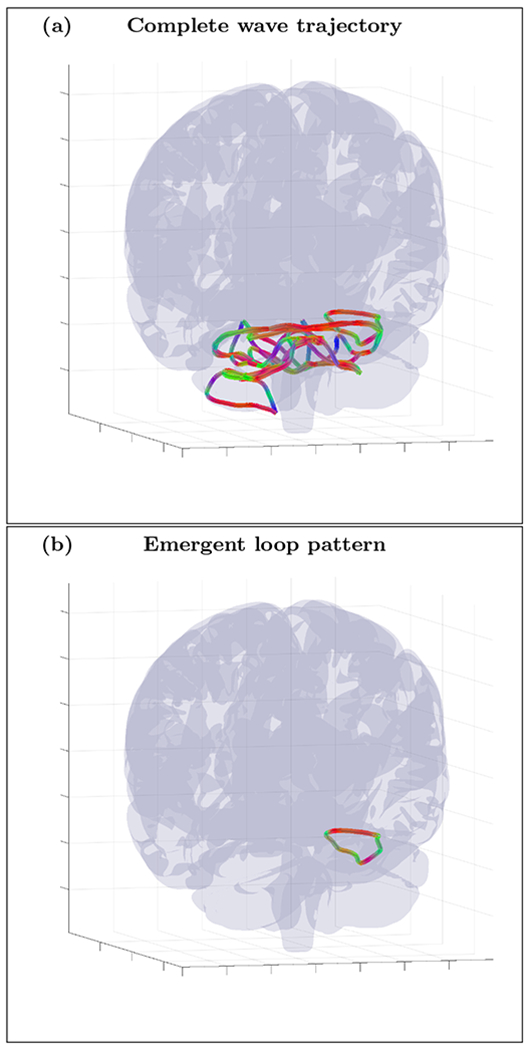
An example of randomly initialized complete wave trajectory (a) and emergent loop pattern (b) for the cortical fold model with inhomogeneity extracted from HRA volume registered to MNI152 space and with fixed anisotropy tensor σ(1) (ε = 0.01). The trajectory was initialized with wave vector k=(0.42,−0.41,0.81) inside the inhomogeneous layer with voxel coordinates r=(114,85,22). High resolution movie links: S10-H1/S10-H1, S10-H2/S10-H2, S10-H3/S10-H3. Low resolution movie links: S10-L1/S10-L1, S10-L2/S10-L2, S10-L3/S10-L3.
FIG. 20.
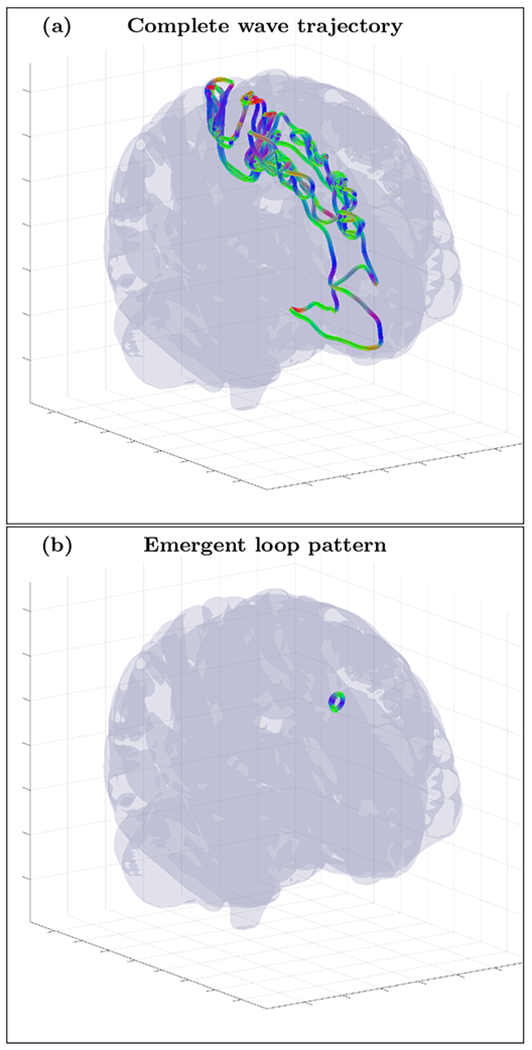
An example of randomly initialized complete wave trajectory (a) and emergent loop pattern (b) for the cortical fold model with inhomogeneity extracted from HRA volume registered to MNI152 space and with fixed anisotropy tensor σ(2) (ε = 0.1). The trajectory was initialized with wave vector k=(−0.90,0.24,0.36) inside the inhomogeneous layer with voxel coordinates r=(66,86,126). High resolution movie links: S11-H1/S11-H1, S11-H2/S11-H2, S11-H3/S11-H3. Low resolution movie links: S11-L1/S11-L1, S11-L2/S11-L2, S11-L3/S11-L3.
FIG. 21.
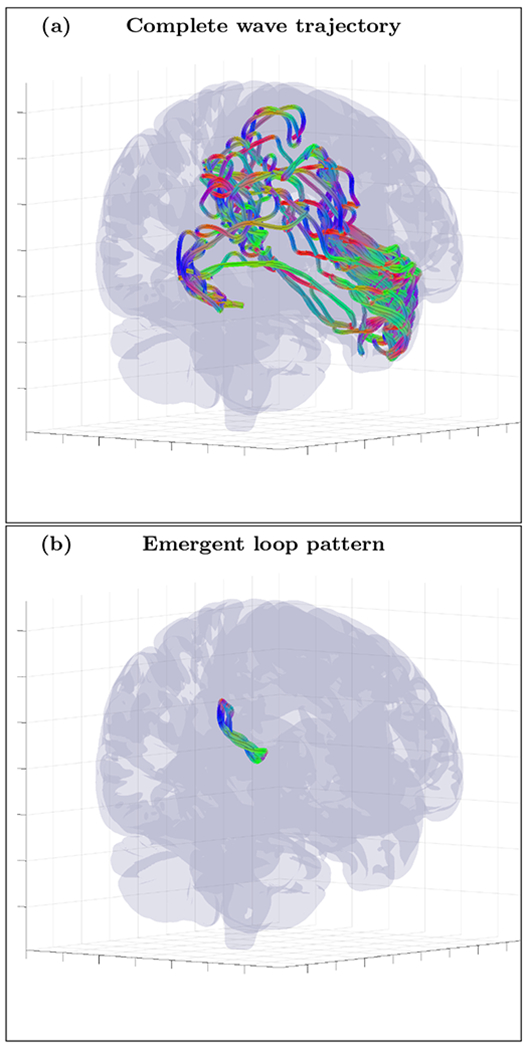
An example of randomly initialized complete wave trajectory (a) and emergent loop pattern (b) for the cortical fold model with inhomogeneity extracted from HRA volume registered to MNI152 space and with diffusion MRI derived position independent anisotropy tensor RT σ(1) R (ε = 0.01). The trajectory was initialized with wave vector k=(−0.90,0.24,0.36) inside the inhomogeneous layer with voxel coordinates r=(66,87,126). High resolution movie links: S12-H1/S12-H1, S12-H2/S12-H2, S12-H3/S12-H3. Low resolution movie links: S12-L1/S12-L1, S12-L2/S12-L2, S12-L3/S12-L3.
FIG. 22.
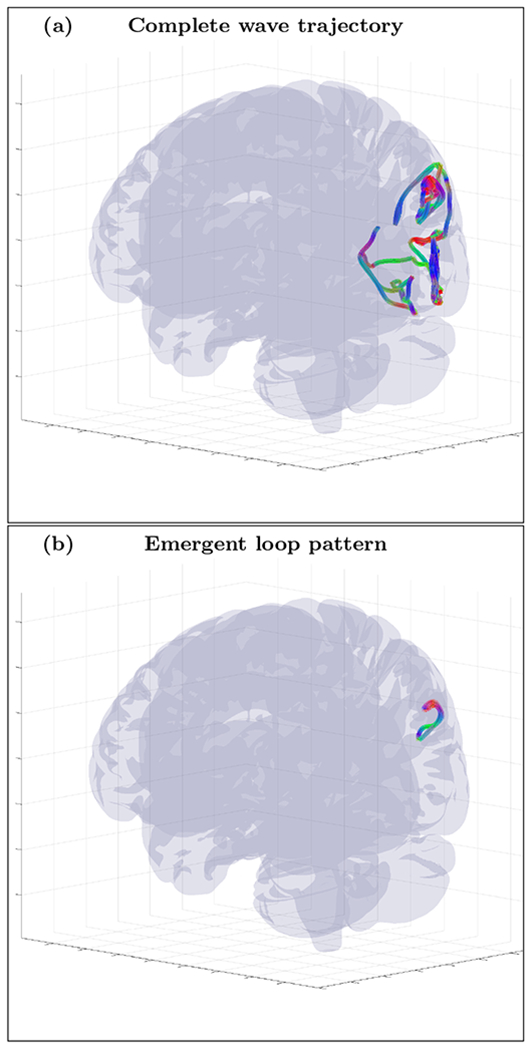
An example of randomly initialized complete wave trajectory (a) and emergent loop pattern (b) for the cortical fold model with inhomogeneity extracted from HRA volume registered to MNI152 space and with tractography derived anisotropy tensor . The trajectory was initialized with wave vector k=(0.4,−0.83,0.4) inside the inhomogeneous layer with voxel coordinates r=(75,61,90). High resolution movie links: S13-H1/S13-H1, S13-H2/S13-H2, S13-H3/S13-H3. Low resolution movie links: S13-L1/S13-L1, S13-L2/S13-L2, S13-L3/S13-L3.
FIG. 23.
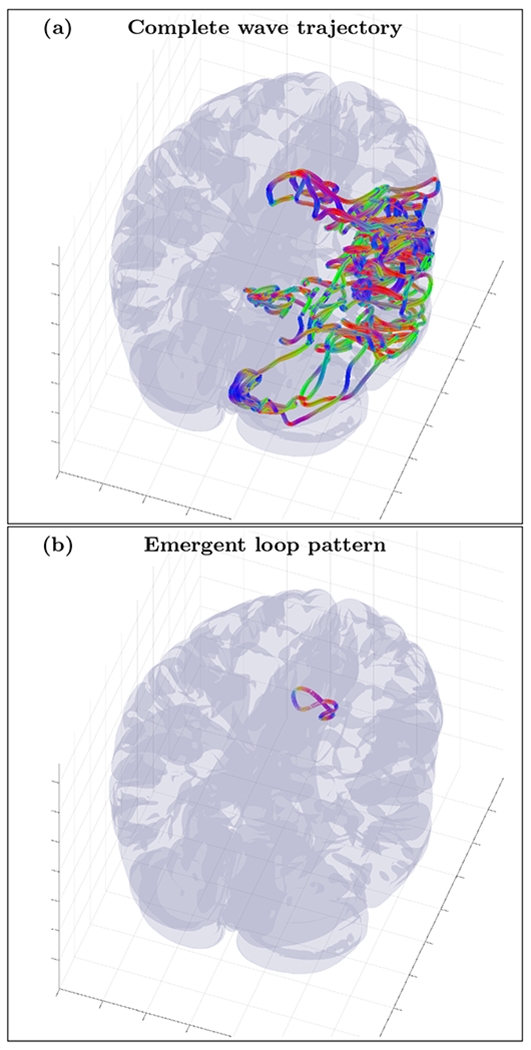
An example of randomly initialized complete wave trajectory (a) and emergent loop pattern (b) for the cortical fold model with inhomogeneity extracted from HRA volume registered to MNI152 space and with tractography derived anisotropy tensor . The trajectory was initialized with wave vector k=(0.66,0.5,0.56) inside the inhomogeneous layer with voxel coordinates r=(33,77,56). High resolution movie links: S14-H1/S14-H1, S14-H2/S14-H2, S14-H3/S14-H3. Low resolution movie links: S14-L1/S14-L1, S14-L2/S14-L2, S14-L3/S14-L3.
FIG. 24.
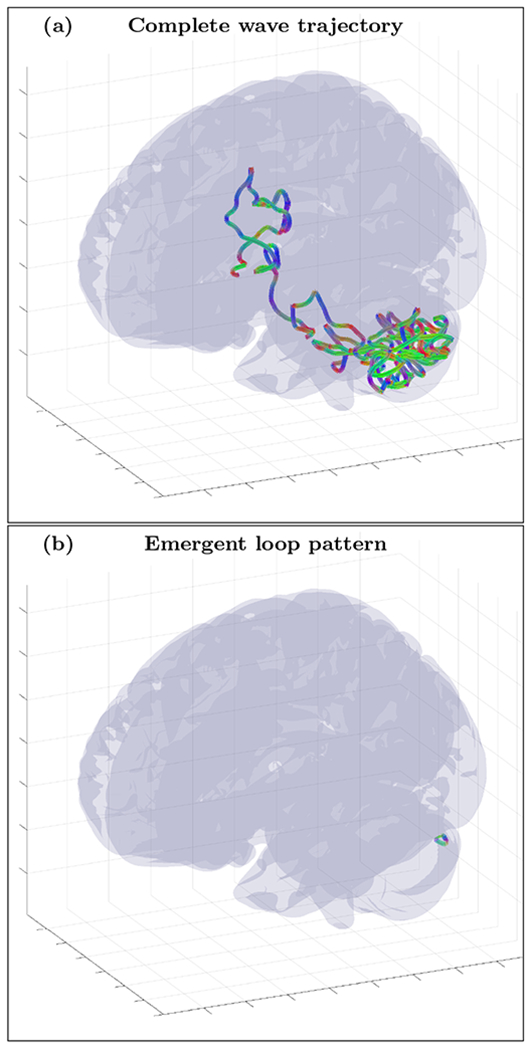
An example of randomly initialized complete wave trajectory (a) and emergent loop pattern (b) for the cortical fold model with inhomogeneity extracted from HRA volume registered to MNI152 space and with tractography derived anisotropy tensor . The trajectory was initialized with wave vector k=(0.36,0.67,−0.65) inside the inhomogeneous layer with voxel coordinates r=(77,123,64). High resolution movie links: S15-H1/S15-H1, S15-H2/S15-H2, S15-H3/S15-H3. Low resolution movie links: S15-L1/S15-L1, S15-L2/S15-L2, S15-L3/S15-L3.
FIG. 25.
An example of randomly initialized complete wave trajectory (a) and emergent loop pattern (b) for the cortical fold model with inhomogeneity extracted from HRA volume registered to MNI152 space and with tractography derived anisotropy tensor . The trajectory was initialized with wave vector k=(−0.06,0.38,0.92) inside the inhomogeneous layer with voxel coordinates r=(132,113,96). High resolution movie links: S16-H1/S16-H1, S16-H2/S16-H2, S16-H3/S16-H3. Low resolution movie links: S16-L1/S16-L1, S16-L2/S16-L2, S16-L3/S16-L3.
Contributor Information
Vitaly L. Galinsky, Center for Scientific Computation in Imaging, University of California at San Diego, La Jolla, CA 92037-0854, USA.
Lawrence R. Frank, Center for Scientific Computation in Imaging, University of California at San Diego, La Jolla, CA 92037-0854, USA and Center for Functional MRI, University of California at San Diego, La Jolla, CA 92037-0677, USA.
References
- [1].Monai H, Inoue M, Miyakawa H, and Aonishi T, Low-frequency dielectric dispersion of brain tissue due to electrically long neurites, Phys Rev E Stat Nonlin Soft Matter Phys 86, 061911 (2012); [DOI] [PubMed] [Google Scholar]; Ingber L and Nunez PL, Neocortical dynamics at multiple scales: EEG standing waves, statistical mechanics, and physical analogs, Math Biosci 229, 160 (2011). [DOI] [PubMed] [Google Scholar]
- [2].Li XP, Xia Q, Qu D, Wu TC, Yang DG, Hao WD, Jiang X, and Li XM, The Dynamic Dielectric at a Brain Functional Site and an EM Wave Approach to Functional Brain Imaging, Scientific Reports 4, 6893 (2014); [DOI] [PMC free article] [PubMed] [Google Scholar]; Zalesky A, Fornito A, Cocchi L, Gollo LL, and Breakspear M, Time-resolved resting-state brain networks, Proc. Natl. Acad. Sci. U.S.A 111, 10341 (2014). [DOI] [PMC free article] [PubMed] [Google Scholar]
- [3].Van Essen DC, Smith SM, Barch DM, Behrens TEJ, Yacoub E, Ugurbil K, and for the WU-Minn HCP Consortium, The WU-Minn Human Connectome Project: An overview., NeuroImage 80, 62 (2013). [DOI] [PMC free article] [PubMed] [Google Scholar]
- [4].Tuch DS, Wedeen VJ, Dale AM, George JS, and Belliveau JW, Conductivity Mapping of Biological Tissue Using Diffusion MRI, Annals of the New York Academy of Sciences 888, 314 (1999); [DOI] [PubMed] [Google Scholar]; Haueisen J, Tuch DS, Ramon C, Schimpf PH, Wedeen VJ, George JS, and Belliveau JW, The influence of brain tissue anisotropy on human EEG and MEG, NeuroImage 15, 159 (2002); [DOI] [PubMed] [Google Scholar]; Hallez H, Vanrumste B, Hese PV, D’Asseler Y, Lemahieu I, and de Walle RV, A finite difference method with reciprocity used to incorporate anisotropy in electroencephalogram dipole source localization, Physics in Medicine & Biology 50, 3787 (2005). [DOI] [PubMed] [Google Scholar]
- [5].Nunez PL and Srinivasan R, Neocortical dynamics due to axon propagation delays in cortico-cortical fibers: EEG traveling and standing waves with implications for top-down influences on local networks and white matter disease, Brain Res. 1542, 138 (2014). [DOI] [PMC free article] [PubMed] [Google Scholar]
- [6].Muller L, Piantoni G, Koller D, Cash SS, Halgren E, and Sejnowski TJ, Rotating waves during human sleep spindles organize global patterns of activity that repeat precisely through the night, Elife 5 (2016). [DOI] [PMC free article] [PubMed] [Google Scholar]
- [7].Lubenov EV and Siapas AG, Hippocampal theta oscillations are travelling waves, Nature 459, 534 (2009); [DOI] [PubMed] [Google Scholar]; Zhang H, Watrous AJ, Patel A, and Jacobs J, Theta and Alpha Oscillations Are Traveling Waves in the Human Neocortex, Neuron 98, 1269 (2018); [DOI] [PMC free article] [PubMed] [Google Scholar]; Muller L, Chavane F, Reynolds J, and Sejnowski TJ, Cortical travelling waves: mechanisms and computational principles, Nat. Rev. Neurosci 19, 255 (2018); [DOI] [PMC free article] [PubMed] [Google Scholar]; Fox SE, Wolfson S, and Ranck JB, Hippocampal theta rhythm and the firing of neurons in walking and urethane anesthetized rats, Exp Brain Res 62, 495 (1986); [DOI] [PubMed] [Google Scholar]; Stewart M, Quirk GJ, Barry M, and Fox SE, Firing relations of medial entorhinal neurons to the hippocampal theta rhythm in urethane anesthetized and walking rats, ibid. 90, 21 (1992); [DOI] [PubMed] [Google Scholar]; Czurko A, Huxter J, Li Y, Hangya B, and Muller RU, Theta phase classification of interneurons in the hippocampal formation of freely moving rats, J. Neurosci 31, 2938 (2011). [DOI] [PMC free article] [PubMed] [Google Scholar]
- [8].Weiss SA and Faber DS, Field effects in the CNS play functional roles, Front Neural Circuits 4, 15 (2010). [DOI] [PMC free article] [PubMed] [Google Scholar]
- [9].Qiu C, Shivacharan RS, Zhang M, and Durand DM, Can Neural Activity Propagate by Endogenous Electrical Field?, J. Neurosci 35, 15800 (2015); [DOI] [PMC free article] [PubMed] [Google Scholar]; Zhang M, Ladas TP, Qiu C, Shivacharan RS, Gonzalez-Reyes LE, and Durand DM, Propagation of epileptiform activity can be independent of synaptic transmission, gap junctions, or diffusion and is consistent with electrical field transmission, ibid. 34, 1409 (2014); [DOI] [PMC free article] [PubMed] [Google Scholar]; Chiang CC, Shivacharan RS, Wei X, Gonzalez-Reyes LE, and Durand DM, Slow periodic activity in the longitudinal hippocampal slice can self-propagate non-synaptically by a mechanism consistent with ephaptic coupling, J. Physiol. (Lond.) 597, 249 (2019); [DOI] [PMC free article] [PubMed] [Google Scholar]; Shivacharan RS, Chiang CC, Zhang M, Gonzalez-Reyes LE, and Durand DM, Self-propagating, non-synaptic epileptiform activity propagates by endogenous electric fields, Exp. Neurol (2019). [DOI] [PubMed] [Google Scholar]
- [10].Buzsaki G, Rhythms of the Brain (Oxford University Press, 2006); [Google Scholar]; Gerstner W, Kistler WM, Naud R, and Paninski L, Neuronal Dynamics: From Single Neurons to Networks and Models of Cognition (Cambridge University Press, New York, NY, USA, 2014). [Google Scholar]
- [11].Frank TD, Daffertshofer A, Peper CE, Beek PJ, and Haken H, Towards a comprehensive theory of brain activity:. Coupled oscillator systems under external forces, Physica D Nonlinear Phenomena 144, 62 (2000); [Google Scholar]; Goel P and Ermentrout B, Synchrony, stability, and firing patterns in pulse-coupled oscillators, Physica D Nonlinear Phenomena 163, 191 (2002). [Google Scholar]
- [12].Hodgkin AL and Huxley AF, A quantitative description of membrane current and its application to conduction and excitation in nerve, J. Physiol. (Lond.) 117, 500 (1952). [DOI] [PMC free article] [PubMed] [Google Scholar]
- [13].Zakharov VE, L’vov VS, and Falkovich G, Kolmogorov Spectra of Turbulence I: Wave Turbulence, 1st ed., Springer Series in Nonlinear Dynamics (Springer-Verlag; Berlin Heidelberg, 1992); [Google Scholar]; Nazarenko S, Wave Turbulence, 1st ed., Lecture Notes in Physics 825 (Springer-Verlag Berlin Heidelberg, 2011). [Google Scholar]
- [14].Gabriel S, Lau RW, and Gabriel C, The dielectric properties of biological tissues: II. Measurements in the frequency range 10 Hz to 20 GHz, Phys Med Biol 41, 2251 (1996); [DOI] [PubMed] [Google Scholar]; The dielectric properties of biological tissues: III. Parametric models for the dielectric spectrum of tissues, 41, 2271 (1996). [DOI] [PubMed] [Google Scholar]
- [15].Rayleigh JWS, On Waves Propagated along the Plane Surface of an Elastic Solid, Proceedings of the London Mathematical Society 17, 4 (1885). [Google Scholar]
- [16].Kartashov IN and Kuzelev MV, Dissipative surface waves in plasma, Plasma Physics Reports 40, 650 (2014). [Google Scholar]
- [17].Galinsky VL and Frank LR, Automated segmentation and shape characterization of volumetric data, Neuroimage 92, 156 (2014). [DOI] [PMC free article] [PubMed] [Google Scholar]
- [18].Galinsky VL and Frank LR, Simultaneous multi-scale diffusion estimation and tractography guided by entropy spectrum pathways, IEEE Trans. Med. Imag 34, 1177 (2015). [DOI] [PMC free article] [PubMed] [Google Scholar]
- [19].Galinsky VL and Frank LR, Symplectomorphic registration with phase space regularization by entropy spectrum pathways, Magn Reson Med , 1 (2018). [DOI] [PMC free article] [PubMed] [Google Scholar]
- [20].Martinez A, Gaspar PA, Hillyard SA, Bickel S, Lakatos P, Dias EC, and Javitt DC, Neural oscillatory deficits in schizophrenia predict behavioral and neurocognitive impairments, Front Hum Neurosci 9, 371 (2015); [DOI] [PMC free article] [PubMed] [Google Scholar]; Woldorff MG, Liotti M, Seabolt M, Busse L, Lancaster JL, and Fox PT, The temporal dynamics of the effects in occipital cortex of visual-spatial selective attention, Brain Res Cogn Brain Res 15, 1 (2002). [DOI] [PubMed] [Google Scholar]
- [21].Galinsky VL and Frank LR, Brain wave loops movies (2018), supplemental Material on Zenodo (https://zenodo.org/record/3686054), OneDrive (https://ucsdcloud-my.sharepoint.com/:f:/g/personal/vgalinsky_ucsd_edu/EhzB6j-1WLVDmiV094llcYoBKIK8OzsVDO61o3EuWJvV1A?e=tutVY0) and on DropBox (https://www.dropbox.com/sh/aads9hluqqzqfi6/AAC4Jzt8a-pH4FfJEf_6JUnBa?dl=0).
- [22].Buzsaki G, Theta oscillations in the hippocampus, Neuron 33, 325 (2002). [DOI] [PubMed] [Google Scholar]
- [23].Kuramoto Y and Battogtokh D, Coexistence of Coherence and Incoherence in Nonlocally Coupled Phase Oscillators, Nonlinear Phenom. Complex Syst 5, 380 (2002); [Google Scholar]; Kuramoto Y, Reduction methods applied to non-locally coupled oscillator systems, in Nonlinear Dynamics and Chaos: Where do we go from here?, edited by Hogan J, Krauskopf A, di Bernado M, Wilson R, Osinga H, Homer M, and Champneys A (CRC Press, 2002) pp. 209–227. [Google Scholar]
- [24].Abrams DM and Strogatz SH, Chimera States for Coupled Oscillators, Physical Review Letters 93, 174102 (2004), nlin/0407045. [DOI] [PubMed] [Google Scholar]
- [25].Fitzhugh R, Impulses and Physiological States in Theoretical Models of Nerve Membrane, Biophys. J 1, 445 (1961); [DOI] [PMC free article] [PubMed] [Google Scholar]; Nagumo J, Arimoto S, and Yoshizawa S, An active pulse transmission line simulating nerve axon, Proceedings of the IRE 50, 2061 (1962); [Google Scholar]; Morris C and Lecar H, Voltage oscillations in the barnacle giant muscle fiber, 35, 193 (1981). [DOI] [PMC free article] [PubMed] [Google Scholar]
- [26].Wilting J and Priesemann V, Inferring collective dynamical states from widely unobserved systems, Nat Commun 9, 2325 (2018). [DOI] [PMC free article] [PubMed] [Google Scholar]
- [27].Rinzel J, A formal classification of bursting mechanisms in excitable systems, in Lecture Notes in Biomathematics (Springer Berlin Heidelberg, 1987) pp. 267–281. [Google Scholar]
- [28].Anastassiou CA, Perin R, Markram H, and Koch C, Ephaptic coupling of cortical neurons, Nat. Neurosci 14, 217 (2011). [DOI] [PubMed] [Google Scholar]
- [29].Fonov V, Evans AC, Botteron K, Almli CR, McKinstry RC, Collins DL, Ball WS, Byars AW, Schapiro M, Bommer W, Carr A, German A, Dunn S, Rivkin MJ, Waber D, Mulkern R, Vajapeyam S, Chiverton A, Davis P, Koo J, Marmor J, Mrakotsky C, Robertson R, McAnulty G, Brandt ME, Fletcher JM, Kramer LA, Yang G, McCormack C, Hebert KM, Volero H, Botteron K, McKinstry RC, Warren W, Nishino T, Almli CR, Todd R, Constantino J, McCracken JT, Levitt J, Alger J, O’Neil J, Toga A, Asarnow R, Fadale D, Heinichen L, Ireland C, Wang DJ, Moss E, Zimmerman RA, Bintliff B, Bradford R, Newman J, Evans AC, Arnaoutelis R, Pike GB, Collins DL, Leonard G, Paus T, Zijdenbos A, Das S, Fonov V, Fu L, Harlap J, Leppert I, Milovan D, Vins D, Zeffiro T, Van Meter J, Lange N, Froimowitz MP, Botteron K, Almli CR, Rainey C, Henderson S, Nishino T, Warren W, Edwards JL, Dubois D, Smith K, Singer T, Wilber AA, Pierpaoli C, Basser PJ, Chang LC, Koay CG, Walker L, Freund L, Rumsey J, Baskir L, Stanford L, Sirocco K, Gwinn-Hardy K, Spinella G, McCracken JT, Alger JR, Levitt J, and O’Neill J, Unbiased average age-appropriate atlases for pediatric studies, Neuroimage 54, 313 (2011). [DOI] [PMC free article] [PubMed] [Google Scholar]
- [30].Fonov V, Evans A, McKinstry R, Almli C, and Collins D, Unbiased nonlinear average age-appropriate brain templates from birth to adulthood, NeuroImage 47, S102 (2009), organization for Human Brain Mapping 2009 Annual Meeting. [Google Scholar]
- [31].Niethammer M, San Jose Estepar R, Bouix S, Shenton M, and Westin CF, On diffusion tensor estimation, Conf Proc IEEE Eng Med Biol Soc 1, 2622 (2006). [DOI] [PMC free article] [PubMed] [Google Scholar]
- [32].Gomes JM, Bedard C, Valtcheva S, Nelson M, Khokhlova V, Pouget P, Venance L, Bal T, and Destexhe A, Intracellular Impedance Measurements Reveal Non-ohmic Properties of the Extracellular Medium around Neurons, Biophys. J 110, 234 (2016). [DOI] [PMC free article] [PubMed] [Google Scholar]
- [33].Barbour B, Analysis of Claims that the Brain Extracellular Impedance Is High and Non-resistive, Biophys. J 113, 1636 (2017). [DOI] [PMC free article] [PubMed] [Google Scholar]
- [34].Galinsky VL and Frank LR, The lamellar structure of the brain fiber pathways, Neural Comput. 28, 2533 (2016). [DOI] [PMC free article] [PubMed] [Google Scholar]
- [35].Tuch DS, Wedeen VJ, Dale AM, George JS, and Belliveau JW, Conductivity tensor mapping of the human brain using diffusion tensor MRI, Proc. Natl. Acad. Sci. U.S.A 98, 11697 (2001). [DOI] [PMC free article] [PubMed] [Google Scholar]


