Abstract
Chromatin is the macromolecular assembly containing the cell’s genetic information, and its architectural conformation facilitates accessibility to activation sites and thus gene expression. We have developed an analytical framework to quantify chromatin ultrastructure with optical hyperspectral microscopy. Chromatin structure can be described as a mass fractal, with packing scaling D up to certain genomic length scales. Considering various system geometries, we established a model to measure D with the interferometric microscopy technique Partial Wave Spectroscopy (PWS). We further validated this analysis using Finite Difference Time Domain (FDTD) to simulate electrodynamic propagation for the PWS system. Measurements of D were consistent with ground-truth ChromTEM calculations, enabling a high-throughput, label free approach to quantifying chromatin structure in the nanometer length scale regime.
In order to enclose more than 2 meters of human DNA within a nuclear diameter less than 10μm and still allow for gene-specific accessibility, genomic DNA must fold into an organized, yet compact arrangement with varying length-scales of packing structure. In the lowest order, DNA wraps around histone proteins forming 11nm nucleosome complexes, recognized as the “beads on a string” structure. Above this level of organization, recent imaging studies have identified the primary in situ organization of chromatin as disordered chains with diameters ranging between 5–24nm, that pack together with varying volume concentration [1]. At a larger scale, chromatin is organized into packing domains (PD) within which it adopts a power-law scaling relationship between the number of monomers (Nf), proportional to the mass of the polymer and the space it occupies (eg. Nf α rD)[2]. Within the power-law regime, chromatin packing behavior can be characterized by the fractal dimension, D [3]. This parameter gives insight into the physical structure of chromatin, for example, higher values of D describe increased chromatin packing with a shift in the mass-density distribution towards more heterogeneous structures. Additionally, the biological significance of D has been demonstrated and correlated with phenotypic plasticity, cancer staging, and large-scale gene expression patterns [4–6]. For length scales beyond a PD (∼6kbp–∼5Mbp), chromatin is organized into chromosomal compartments associated by transcriptional activity, however the interplay between PDs and large-scale chromatin organization is poorly understood [7].
While there is an increasing number of techniques to quantify chromatin structure, few can image with sufficient resolution while collecting significant statistics. A recent super resolution (SR) development using single nucleosome labeling has enabled live cell, dynamic imaging of chromatin structure with 20nm resolution [8]. However, high irradiation technologies are known to induce phototoxicity and alter molecular structure.
Chromatin transmission electron microscopy (ChromTEM) uses bright-field TEM in combination with DNA labeling to acquire 2D images of chromatin structure with nanometer level spatial resolution. Using autocorrelation analysis on the chromatin mass density distribution, chromatin packing scaling D can unambiguously be measured by power law fitting. ChromTEM, although considered a ground truth measurement of chromatin organization, is time intensive and does not allow for live-cell imaging.
PWS, on the other hand, is label-free, high-throughput, and uses a relatively simple, visible light microscopy system for 2D interference based live-cell imaging. It relies on a common-path reference at the cell-glass interface to amplify the backscattering spectrum from refractive index (RI) variations within a cell. From this signal, the spectral variance, Σ, can be computed for every x-y pixel. Previous analysis [5] has related this to the power spectral density (PSD) of the sample’s RI fluctuations after modulation by the microscope transfer function. As a statistical metric, Σ is sensitive to structural changes in the range of 20–300nm, below the system’s diffraction limit. However, it is not explicitly a structural metric and thus is not directly comparable to other nanoscale imaging techniques. Here, we outline and validate a method to relate Σ, a measured optical parameter, to D, a physical descriptor of nuclear organization, while considering the effect of chromatin volume concentration ϕ and genomic length Nf.
Within the nucleus, chromatin is the strongest contributor to the PWS signal as most other macromolecules and physicochemical elements (i.e. ions) comprising the nuclear environment are outside the length-scale sensitivity of PWS. In order to establish a direct relationship between the chromatin packing scaling D from PWS spectral variance Σ, we first express Σ as a function of the mass-density autocorrelation function (ACF) shape parameter DB, then convert DB to the packing scaling D. The ACF of a purely fractal media is a power-law function with exponent proportional to fractal dimension D as follows: Bρ α rD−3 [3]. However, a strict power-law function approaches infinity at the origin, a behavior that is not physical, as the smallest structural unit of chromatin are nucleotides which have finite size. Additionally, the ACF of a single PD gradually decays to zero. Thus, a modified power-law ACF was employed to include a lower and upper length scale limit, and allow for both continuity and differentiability at all length scales [9, 10]:
| (1) |
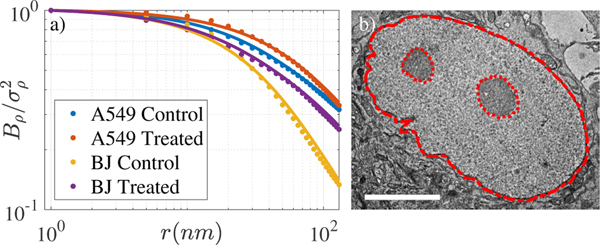
where r is the spatial separation, and is the normalization term such that is , the variance of mass-density. Γ(x, a) is the upper incomplete gamma function, and lmin and lmax characterize the lower and upper length scales of fractality, respectively. DB is a model parameter that describes the shape of Bρ and is related to D, the fractal dimension. This model for Bρ was fit to experimentally measured ACFs from ChromTEM images of chromatin structure in lung adenocarcinoma A549 cells and differentiated BJ fibroblasts, and matched with marginal errors (median R2 of 0.99 over all samples for the fitting range fixed between 0–200nm) (Fig. 1), demonstrating the flexibility of this model.
Fig. 1.
Bρ model (solid lines) fit to experimental ACFs of chromatin mass density computed from ChromTEM of nuclei. (b) An example ChromTEM image of a BJ nucleus is shown with nucleus masked and nucleoli ignored. Scale bar 5μm.
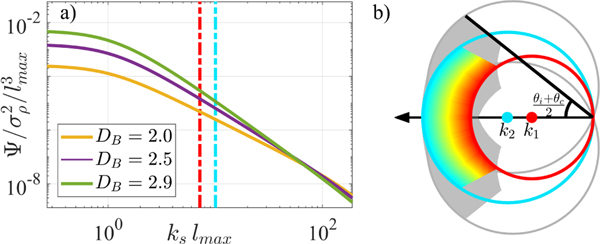
The scattering response of a media can be determined by its PSD. Taking the 3D Fourier Transform of Bρ(r), we obtain the PSD: Ψ(ks, DB), a function of the scattering wavenumber in air ks, shown in Fig. 2(a). Examining the backscattered sample space using Ewald representation in Fig. 2(b) for the PWS experimental setup, we see how the extended numerical aperture achieved with a large collection (NAc) and moderate illumination (NAi) allows for high lateral resolution, while spectral analysis enables differentiation between varying sample structures.
Fig. 2.
(a)The normalized PSD Ψ is shown, where the dashed lines indicate the back-scattered frequencies for visible light illumination. (b) Ewald representation of back-scattered frequency space with NAi of 0.55 and NAc of 1.49. Colored region depicts wavelengths 500–700nm for planar illumination, while greyed region incorporates the response from the entire NAi.
An ideal model would have a direct correspondence between each physical descriptor of chromatin structure and each model parameter. Within the fractal regime, the genomic size of chromatin, Nf can be related to lmax by dividing the total volume occupied by mass by the volume of an elementary particle. Integrating the ACF over 3D space to obtain volume [3], we can compute Nf for a single domain as follows:
| (2) |
As Nf is monotonic with lmax, Eq. (2) can be inverted numerically to generate the ACF as a function of Nf. It is also useful to relate the model parameter DB to packing scaling D. The ACF slope was set to decay according to the packing scaling as follows:
| (3) |
The DB to D relationship, as determined from the fit to the slope in Eq. (3), is shown in Fig. 3a, and is consistent for varying values of Nf and lmin. Importantly, while DB can take on any real value, D can only physically take on values between 5/3 for a self-avoiding polymer, and 3 for a completely space filling polymer.
Fig. 3.
(a) Model parameter DB as it relates to fractal dimension D with the y=x reference line shown. Surface plots showing (b) Σ vs D and ϕ (c) Nf; black lines denote the cross sections shown in respective insets.
Next, we utilize the relationship between spectral variance and the spatial ACF: Σ2 α [Bρ ⊗ T(r)]|r=0, denoted by the convolution (⊗) between the ACF and a smoothing function T, characterized by the microscope’s NA and the source spectrum [5]. Since Σ2 is linearly related to the ACF, a linear decomposition of the Bρ would result in a linear summation of Σ2. Employing the Laplace transform within the fractal regime, Bρ can be decomposed into a sum of weighted exponential functions:
| (4) |
Here, e−r/lc is a set of exponential basis functions with varying lc, the characteristic length. P contains the weights for each exponential basis in the form of a probability distribution function and can be obtained by the normalized inverse Laplace transform of Eq. (4), as follows:
| (5) |
Employing Parseval’s theorem, Eq. (4) can be written in the spectral space with the same weighting function P. We thus obtain the relationship between spectral variance Σ2 and DB:
| (6) |
is the spectral variance from an exponential ACF with characteristic length lc and has a closed-form solution [5]:
| (7) |
where R is the product of the forward and reverse Fresnel transmission and reflection coefficients at the cell/glass interface, normalized by the reflectance of the glass/media interface:
| (8) |
Additionally, k is the center wavelength in vacuum, L is the effective thickness of the sample limited by either the cell thickness or depth of field (), and is the variance of RI fluctuations within the nucleus.
Next, to estimate the RI of the nucleus nnucleus, we consider the effect of chromatin density and a fixed contribution from mobile crowders (MCs, e.g., RNA polymerases, mRNAs, miRNAs) on scattering. The densities of these molecular components relate to nnucleus through the Gladstone-Dale equation:
| (9) |
where n0 = 1.332 is the RI of water, is the RI increment, and ρC and ρMC are the densities of chromatin and MCs, respectively. The chromatin volume concentration is ϕ and the volume fraction of MCs in the nuclear space unoccupied by chromatin is denoted ϕMC. MCs consist of mediators, RNA polymerases, nucleosome remodellers, and histone modifiers, many of which are large protein complexes. The range of ρMC for relevant molecules in the nucleus was estimated to be between 1.3 − 1.7, with larger proteins tending to have a lower density. Since larger proteins occupy a larger volume fraction, the average set . We further estimated by approximating the weight and total volume occupied by a single nucleosome and its linker DNA. Values of ϕ were kept within 0.12–0.55, in accordance with previously measured values [1]. Finally, we considered MCs to have a maximum volume concentration within the nucleus, ϕMC = 0.05. Uncertainty propagation showed that nnucleus = 1.37 ± 0.01 resulted in a 7% change in Σ.
We estimated the standard deviation of RI fluctuations σn by assuming ϕ follows a binomial distribution:
| (10) |
Then, we numerically calculated a series of Σ(DB) for varying DB by first inputting physiologically relevant values for ϕ and Nf, and computing lmax, nnucleus, and σn from Eqs. (2, 9, 10), respectively. lmin was set to 1nm, the radius of the fundamental structural unit of chromatin, the nucleotide base pair. These values were used in Eqs. (5) and (7) to compute P and as inputs to Eq. (6). Importantly, the relationship between Σ and DB can be accurately represented by a linear approximation. For ϕ = 0.32, Nf = 1.0Mbp, NAi = 0.55 and NAc = 1.49 we obtain Σ ≈ 0.14(DB − 1.45), with R2 of 0.999.
Finally, we scanned through all possible D values in order to generate a numerical mapping for Σ(D) as a function of ϕ and Nf, as shown in Fig. 3(b-c). The Nf values displayed (0.2–2Mbp) encapsulates the interquartile range for PDs measured by ChromSTEM. Importantly, we note the primary contributor to changes in Σ are variations in D, even considering the appropriate limits of ϕ and Nf.
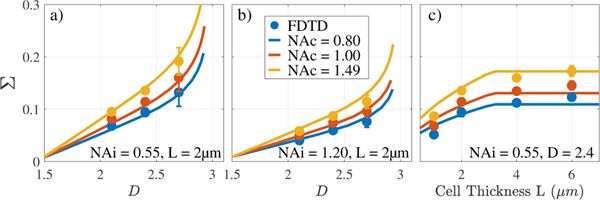
To validate this theoretical framework, we used Angora [11], an open source, simulation software that implements Finite Difference Time Domain (FDTD) for microscopy modelling. We generated random media samples (5 repetitions for each configuration) with dimensions 4μm × 4μm × Lμm, resolution Δx=20nm, mean RI=1.36, mounted on a glass slide (RI=1.517) and immersed in cell media (RI=1.337). The nuclear statistics were characterized by the ACF in Eq. (1), lmin was fixed to 1nm, and Nf=1.0Mbp. We varied system parameters including NAi and NAc and simulated an oil-immersion bright-field epi-illumination configuration, as per the experimental PWS system. The incident beam illuminated with wavelengths 500–700nm, was focused on the cell-glass interface, and the backscattered spectral image cube was measured in the far-field. As consistent with PWS analysis, we first normalized the spectral cube to the reference, acquired from a cell-free simulation of glass-media interference. Next, we computed the pixel by pixel variance across wavelengths, and averaged Σ per simulation. FDTD results are plotted against the theoretical derivations described above, and are shown in Fig. 4. The analytical relationship here excludes MCs and instead fixes σn=0.04, as consistent with simulation.
Fig. 4.
Σ to D conversion for varying D (a,b) and cell thickness (c). FDTD and analytical results are shown for a wide range of system and media configurations.
Nuclear statistics from two cell lines were measured both by PWS and ChromTEM to show extensibility of analytical approach: A549 and BJ cells untreated (control) or treated with a dose of 100 nM Dexamethasone (Sigma-Aldrich, St. Louis, MO, D6645) were imaged after 12 hours (A549) or 32 hours (BJ) of treatment. Dexamethasone treatment has previously been demonstrated to alter whole-scale genome connectivity [12].
The PWS optical instrument is built on a commercial inverted microscope using a CCD coupled to a liquid crystal tunable filter to perform hyperspectral imaging. Spectrally resolved images were collected between 500–700nm with 2nm steps. Images were processed by first normalizing by a reference measurement of the clear dish, convolving with a low pass filter, sinc(kDOF) to remove frequencies beyond the DOF, and then computing the variance across wavelengths. Cells were cultured in 35mm glass-bottom petri dishes until approximately 70% confluent, then imaged directly. A total of 300 A549 control, 323 A549 treated, 67 BJ control and 100 treated BJ nuclei were accumulated in the population based Σ measurements. PWS images of representative BJ cells after converting Σ to D are shown in Fig. 5.
Fig. 5.
PWS images and corresponding D values of a BJ cell (a) before dexamethasone treatment and (b) 32 hours after-wards. Scale bar 10μm.
ChromTEM samples were prepared by the previously developed ChromEM staining protocol [1]. Following heavy metal staining of the nucleus, cells were dehydrated in ethanol and embedded in resin and cured for 48 hours. Using an ultramicrotome, 50 nm thick resin sections were cut and deposited onto copper 200 mesh grid with carbon/formvar film (EMS) and plasma cleaned. Each sample resulted in a 150μm × 150μm × 50nm cross section of the cells, and imaged with 3nm lateral resolution. To process acquired ChromTEM images, nuclear segmentation excluded background and nucleoli, as shown in Fig. 1a. The 2D ACF was computed, rotationally averaged, and D was fit with Bρ α rD−3 in the range of r between 50–100nm. A total of 37 samples were acquired: 8 A549 control, 12 A549 treated, 5 BJ control and 12 BJ treated in the measurements of D.
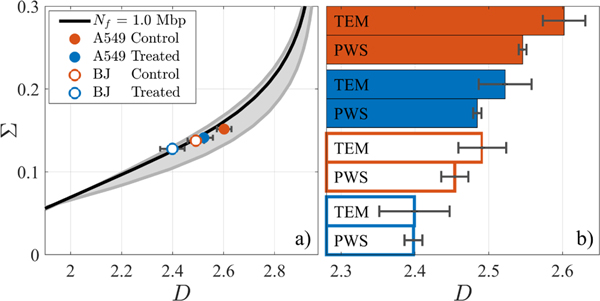
Analytical and experimental results show a consistent trend as displayed in Fig. 6(a), where ChromTEM D and PWS Σ measurements from each cell population are plotted. While the true Nf of each cell population is unknown, the relationship between Σ and D is largely unaffected by Nf and experimental results follow the theoretical mapping within physiologically relevant ranges for Nf. Additionally, using Nf=1Mbp and ϕ=0.32, we plot the D measured by both ChromTEM and PWS in Fig. 6(b) across all cell groups.
Fig. 6.
(a) Σ vs. D mapping, where grey lines denote Nf of 0.2–2.0Mpb. Experimental measurements from two cell lines under two treatment conditions as measured by PWS (Σ) and ChromTEM (D) are shown. (b) With Nf=1Mbp and ϕ=0.32, PWS Σ were converted to D and are compared to ChromTEM. Error bars are standard error between average nuclear D.
We have thus laid the theoretical framework to compute the physical chromatin packing scaling D, from optically measured interferometric spectral variance Σ. Validating this framework with numerical FDTD simulations and ChromTEM imaging experiments, both with nanometer resolution, we found chromatin packing scaling D can be recovered. We believe this will enable interferometric imaging techniques to characterize tissue morphology for exploratory research, functional nano-sensing and better detection and characterization of pathology.
Acknowledgement.
An award of computer time was provided by the INCITE program. This research used resources of the Argonne Leadership Computing Facility, which is a DOE Office of Science User Facility supported under Contract DE-AC02-06CH11357.
Funding. National Institutes of Health (NIH) (R01CA225002, R01CA200064, R01CA228272); National Science Foundation (NSF) (EFMA-1830961).
Footnotes
Disclosures. The authors declare no conflicts of interest.
REFERENCES
- 1.Ou HD, Phan S, Deerinck TJ, Thor A, Ellisman MH, and O’Shea CC, Science 357 (2017). [DOI] [PMC free article] [PubMed] [Google Scholar]
- 2.Wang RK, J. Mod. Opt. 47, 103 (2000). [Google Scholar]
- 3.Iashina EG and Grigoriev SV, J. Exp. Theor. Phys. 129, 455 (2019). [Google Scholar]
- 4.Metze K, Expert. review molecular diagnostics 13, 719 (2013). [DOI] [PMC free article] [PubMed] [Google Scholar]
- 5.Cherkezyan L, Zhang D, Subramanian H, Capoglu I, Taflove A, and Backman V, J. Biomed. Opt. 22, 030901 (2017). [DOI] [PMC free article] [PubMed] [Google Scholar]
- 6.Virk RKA, Wu W, Almassalha LM, Bauer GM, Li Y, Van-Derway D, Frederick J, Zhang D, Eshein A, Roy HK, Szleifer I, and Backman V, Sci. Adv. 6, eaax6232 (2020). [DOI] [PMC free article] [PubMed] [Google Scholar]
- 7.Hansen AS, Cattoglio C, Darzacq X, and Tjian R, Nucleus. 9, 20 (2018). [DOI] [PMC free article] [PubMed] [Google Scholar]
- 8.Nozaki T, Imai R, Tanbo M, Nagashima R, Tamura S, Tani T, Joti Y, Tomita M, Hibino K, Kanemaki MT, Wendt KS, Okada Y, Nagai T, and Maeshima K, Mol. cell 67, 282 (2017). [DOI] [PubMed] [Google Scholar]
- 9.Xu M and Alfano RR, Opt. letters 30, 3051 (2005). [DOI] [PubMed] [Google Scholar]
- 10.Sheppard CJR, Opt. Lett. 32, 142 (2006). [DOI] [PubMed] [Google Scholar]
- 11.Capoglu IR, Taflove A, and Backman V, IEEE Antennas Propag. Mag. 55, 80 (2013). [Google Scholar]
- 12.AM D, IC M, A B, LK H, SM L, LC B, CM V, WH M, A S, L S, CA G, GE C, and TE R, Cell systems 7 (2018). [Google Scholar]


