Abstract
Cultured murine macrophages (RAW 264.7) were used to investigate the effects of fracking sand dust (FSD) for its pro-inflammatory activity, in order to gain insight into the potential toxicity to workers associated with inhalation of FSD during hydraulic fracturing. While the role of respirable crystalline silica in the development of silicosis is well documented, nothing is known about the toxicity of inhaled FSD. The FSD (FSD 8) used in these studies was from an unconventional gas well drilling site. FSD 8was prepared as a 10 mg/ml stock solution in sterile PBS, vortexed for 15 s, and allowed to sit at room temperature for 30 min before applying the suspension to RAW 264.7cells. Compared to PBS controls, cellular viability was significantly decreased after a 24 h exposure to FSD. Intracellular reactive oxygen species (ROS) production and the production of IL-6, TNFα, and endothelin-1 (ET-1) were up-regulated as a result of the exposure, whereas the hydroxyl radical (˙OH) was only detected in an acellular system. Immunofluorescent staining of cells against TNFα revealed that FSD 8 caused cellular blebbing, and engulfment of FSD 8 by macrophages was observed with enhanced dark-field microscopy. The observed changes in cellular viability, cellular morphology, free radical generation and cytokine production all confirm that FSD 8 is cytotoxic to RAW 264.7 cells and warrants future studies into the specific pathways and mechanisms by which these toxicities occur.
Keywords: Fracking sand dust, Occupational exposure, Cytotoxicity, Inflammation, Macrophages
1. Introduction
The United States is currently the world’s largest consumer and producer of hydraulic fracturing (fracking) sand, with 70% of domestic production coming from Minnesota and Wisconsin (Benson and Wilson, 2015). Comprised primarily of α-quartz sand and used as a proppant during hydraulic fracturing, fracking sand is rarely used as-mined, and is often subject to processes such as material extraction, crushing, washing, cleaning, and drying. This manipulation leads to the production of dust (FSD)(Liang et al., 2016). Mechanical manipulation of the sand at the well site also generates dust during the process of preparing fluid to be pumped into the well bore, where the sand serves as a proppant to maintain fissure patency. Chemical analysis of the FSD has indicated that many minerals other than silica are components of the dust (Fedan et al., 2020).
Worksite exposure to FSD can occur in several ways: during sand moving operations, loading operations, traffic on site from sand and crew trucks, and wherever else dust may be visible. These exposures pose inhalation health hazards for workers primarily due to the high levels of respirable crystalline silica (RCS) to which workers can be exposed (Esswein et al., 2012). In 2012, researchers from the National Institute for Occupational Safety and Health (NIOSH) found that 47% of full shift air samples collected from eleven hydraulic fracturing sites in five states exceeded the Occupational Safety and Health Administration’s (OSHA) permissible exposure limit for RCS. The inhalation of RCS is a well-known cause of silicosis, a well-documented occupational disease, and a significant cause of premature morbidity and mortality.
Alveolar macrophages, epithelial cells and fibroblasts are all activated by silica particles. The deposition of silica dust in small airways of the lung, where they are ingested by macrophages, elicits an initial inflammatory response. This response is characterized by an up-regulation and release of cytokines, such as IL-1β, TNFα, and IL-6, along with an increase in reactive oxygen species (ROS) production, cell membrane and DNA damage, and activation of nuclear transcription factors (Shi et al., 1998; Vallyathan et al., 1998; Fubini and Hubbard, 2003; Hornung et al., 2008). The initial inflammatory stage is followed by the second, fibrotic or reparative phase, in which polypeptide growth factors regulate neovascularization and re-epithelialization of injured lung tissue. The uptake of silica particles also initiates apoptotic cell death, along with the release of already-ingested silica particles, which are then re-engulfed by other alveolar macrophages, thus maintaining a state of sustained inflammation (Huaux, 2007). Macrophages, therefore, play a central role in the development of silicosis.
The potential toxicities of FSD have not yet been identified. Using the RAW 264.7 macrophage cell line, the purpose of this investigation was to examine pro-inflammatory cytokine production, nuclear DNA damage, ROS production, and particle engulfment in response to FSD exposures. We hypothesized that both particle silica dust particles as well as associated minerals or other substances present in the FSD could play a role in FSD-induced biological effects.
This report is the third in a series of tandem papers in which the potential toxicity of FSD has been comprehensively investigated. The first paper in the series (Fedan, 2020) describes the overall scope of the investigation in the context of current knowledge about silica toxicity and research gaps. The other studies in this series have examined the physical and chemical properties of FSD 8 (Fedan et al., 2020), and its effects on lung ventilatory and non-ventilatory functions, inflammatory mechanisms, and cardiovascular, immune and nervous systems (Russ et al., 2020; Anderson et al., 2020; Sager et al., 2020; Krajnak et al., 2020; Sriram et al., 2020), and been summarized (Investigative Team, 2020). In the absence of any information about its potential toxicity, a comprehensive rat animal model study (see Fedan, J.S., Toxicol Appl Pharmacol. 000, 000–000, 2020) has also been designed to investigate the bioactivities of several FSDs in comparison to MIN-U-SIL® 5, a respirable α-quartz reference dust used in previous animal models of silicosis, in several organ systems.
2. Methods
2.1. FSD preparations
The FSD used in this study is FSD 8 (Fedan et al., 2020), which was collected at a gas well in which hydraulic fracturing (fracking) was used. Physical and chemical characterizations of FSD 8 are described elsewhere (Fedan et al., 2020). All experiments were run in triplicate, with fresh preparations of FSD used each time. Stock suspensions of neat FSD 8 were mixed with sterile, phosphate buffered saline (PBS) at a concentration of 10 mg/ml. The suspensions were vortexed for 15 s and allowed to sit at room temperature for 30 min before applying to the cells. This was done to investigate whether soluble bioactive matter could be extracted from the FSD.
2.2. Particle size and surface area
The distribution of particle sizes in suspension was measured using Nanosight NS300 Nanoparticle Tracking Analysis software (Malvern, UK). To measure the surface area of particles, FSD was degassed using an ASAP2020 unit (Micromeritics Corp.; Norcross, GA) under 500 μm Hg vacuum pressure and heated to 350 °C for a period of 4 h. The Brunauer, Emmett and Teller (BET) method of analysis for surface area was measured using nitrogen gas adsorption. A value of 0.162 nm2 was used for the molecular cross-sectional area of nitrogen at 77 K. The BET was calculated from at least six adsorption points in the range p/p0 = 0.01–0.3; the values were normalized by dry sample mass to calculate specific surface area with units of m2/g. Particle sizes in suspension and surface area are shown in Fig. 1.
Fig. 1.
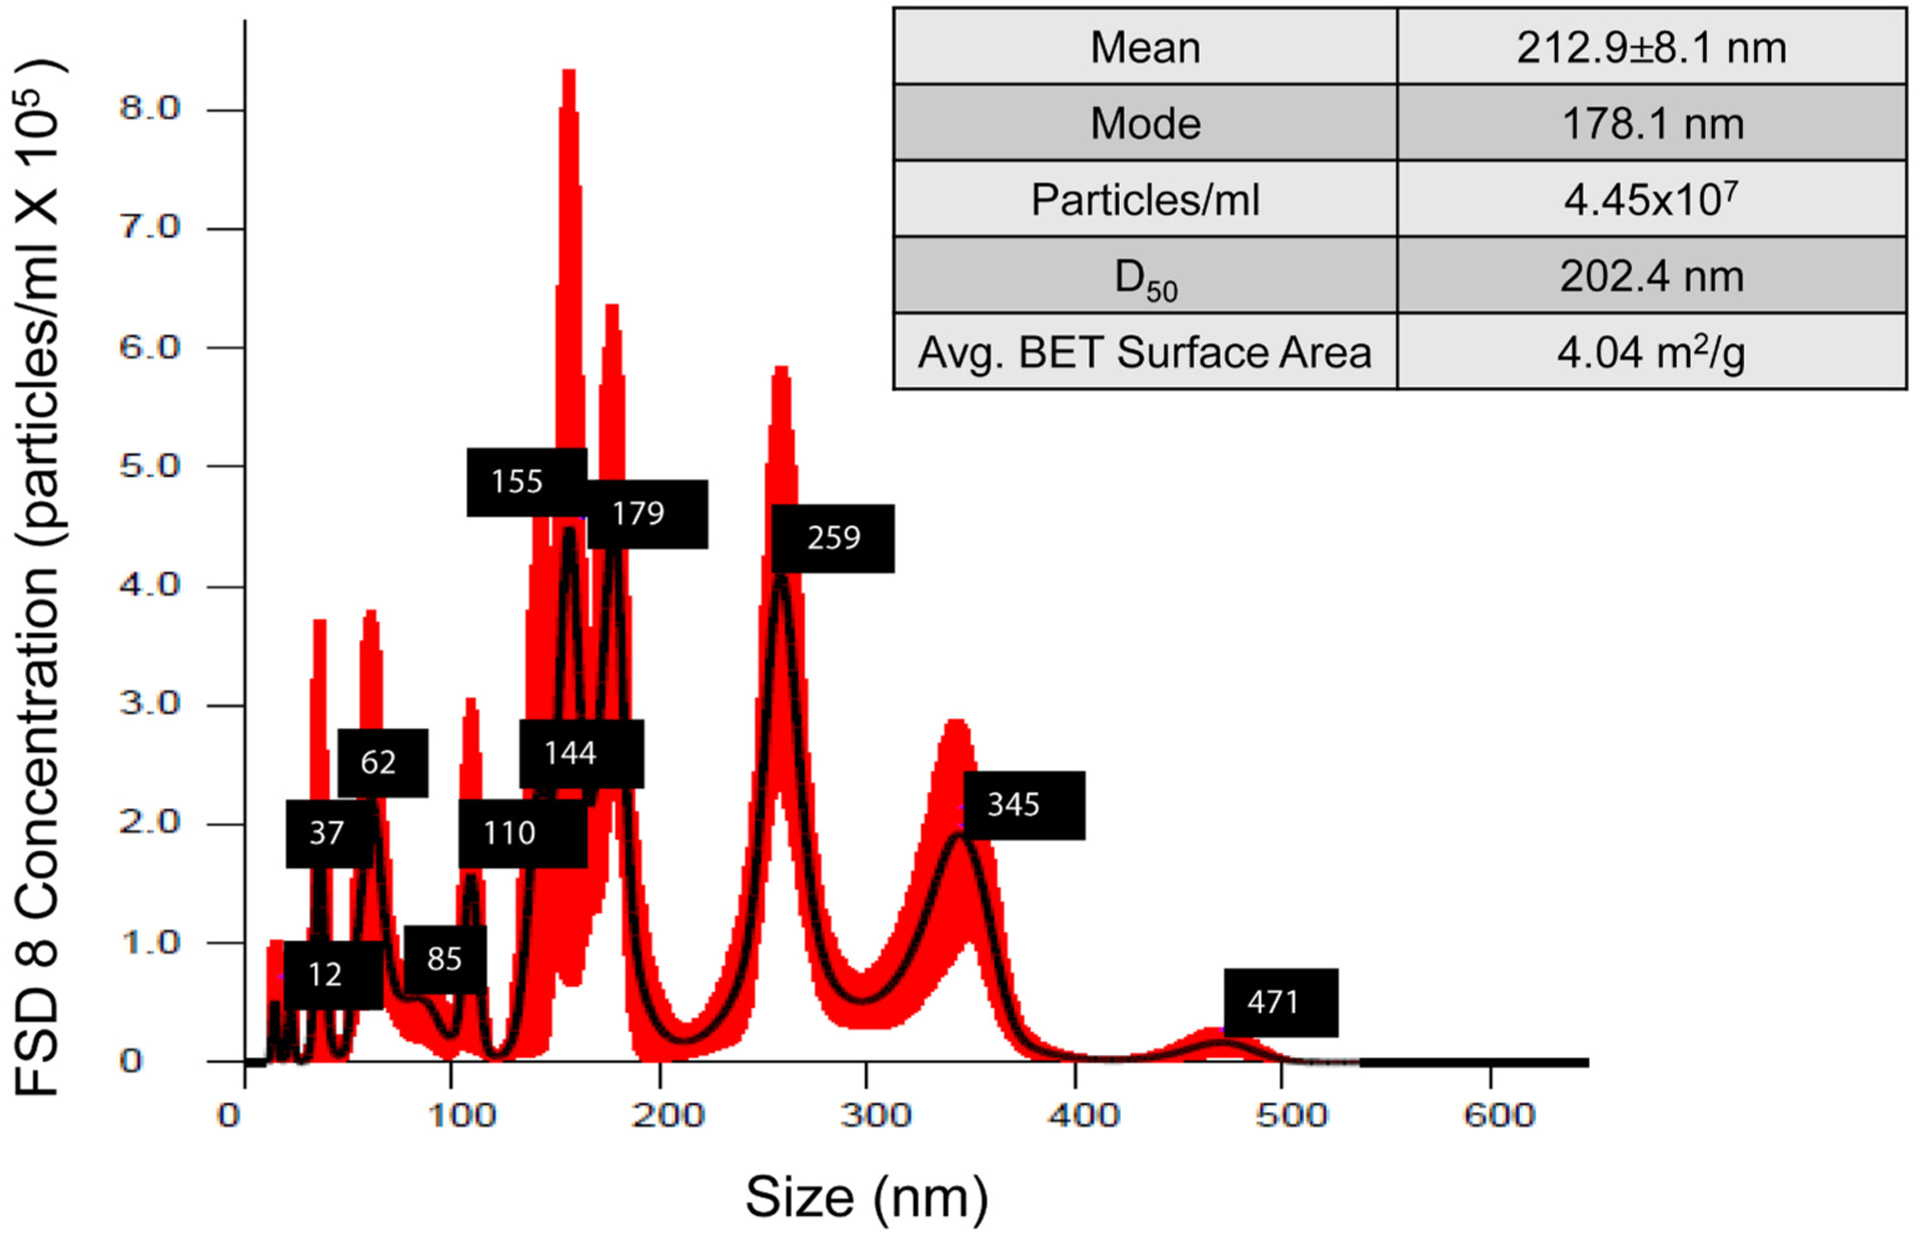
Size and surface area distribution profile of FSD 8 in suspension. Average particle size ± standard error, along with mode, particle concentration, and distribution of particles according to size, are shown. D50 indicates the percentage of particles that are below the 50th percentile, which gives an indication of the distribution of particle sizes within the sample.
2.3. Microbial growth
Two methods were used to rule out the presence of active bacterial growth in FSD 8, which is a known, pro-inflammatory stimulant.
2.3.1. Limulus amebocyte lysate (LAL)
The endpoint chromogenic LAL test (Lonza; Walkersville, MD) was used to test for the presence of gram-negative bacterial endotoxin. Briefly, FSD was mixed with LAL and incubated for 10 min at 37 °C. At the end of the incubation, a chromogenic substrate was added, and samples were incubated for an additional 6 min. An acidic “stop” solution was added, and the absorbance was determined spectrophotometrically at 405 nm. Absorbance was directly proportional to the amount of endotoxin present.
2.3.2. Microbial DNA extraction, amplification and sequencing
Three samples were processed for genomic DNA (gDNA) extraction: a sterile PBS control, 10 mg of FSD 8 before washing, and 10 mg of FSD 8 1 h after washing in sterile PBS. Each sample was placed in a 2 ml reinforced tube containing 300 mg glass beads (212–300 μm, acid-washed; Sigma-Aldrich; St. Louis, MO) and 650 μl sterile PBS. Tubes were centrifuged at 20,000 ×g for 1 min, the supernatant fluid was discarded, and 350 μl of tissue lysis buffer (Roche Applied Sciences; Penzberg, Germany) was added. Samples were placed in a Bead Mill 24 homogenizer (Fisher Scientific; Waltham, MA) and processed at 5 m/s for 30 s before centrifugation at 20,000 ×g for 1 min. The supernatant fluid was then transferred to a sterile 1.5-ml microcentrifuge tube along with 40 ml of CelLytic B Cell Lysis Reagent (Sigma-Aldrich). After incubation at 37 °C for 15 min, the samples were processed using the Roche High Pure PCR Template Prep Kit (Rittenour et al., 2014; Lemons et al., 2017).
Fungal and bacterial ribosomal DNA regions were then amplified using the primer sets Fun18Sf/ITS4 (Pitkaranta et al., 2008) and p8FPL/p806R (McCabe et al., 1995), respectively, as previously described (Rittenour et al., 2014; Lemons et al., 2017). Amplification of the ribosomal DNA was then confirmed using agarose gel electrophoresis. As bacterial 16S rDNA amplification was confirmed, the amplified DNA was processed for Sanger sequencing using previously described methods (Lemons et al., 2017). The resulting sequences were clustered into operational taxonomic units (OTUs) at a 97% similarity cutoff and taxonomically placed by querying against the National Center for Biotechnology Information database (Lemons et al., 2017).
2.4. Macrophage cell culture
Murine macrophage (RAW 264.7) cells (ATCC; Manassas, VA) were used for all experiments and chosen because of their monocyte/macrophage morphology. Cells were cultured in Dulbecco’s modified Eagle’s medium (DMEM) supplemented with 10% fetal bovine serum (FBS) and 50 mg/ml of penicillin/streptomycin (Invitrogen Life Sciences; Grand Island, NY). Cells were maintained at 37 °C in a 5% CO2 in air incubator and passaged by scraping into either DMEM or PBS, depending on the experiment.
2.5. Cellular viability
Cells were seeded at a density of 5 × 10⁴ cells/well in 96-well plates. After a 24 h growth period, cells were incubated with FSD 8 suspensions at final concentrations of 1 mg/ml and 5 mg/ml for either 4 or 24 h, with a final volume of 200 μl/well. At 4 h prior to the end of the 24 h exposure, medium was removed and replaced with phenol red-free Minimum Essential Medium (ThermoFisher Scientific; Pittsburgh, PA) containing 0.5 mg/ml of water soluble 3-(4,5-dimethylthiazol-2-yl)-2,5-diphenyltetrazolium bromide (MTT; Invitrogen; Carlsbad, CA).
For the 4 h exposure, cells were only exposed to FSD in the phenol red-free MEM containing 0.5 mg/ml MTT. Cells were then placed back into the incubator for 4 h, allowing insoluble purple formazan crystals to form. At the end of 4 h, medium was replaced with 100 μl of dimethyl sulfoxide (ThermoFisher Scientific) to solubilize the formazan crystals, mixed, and incubated for 10 min at 37 °C. Control wells containing no cells were also run to measure any potential background produced by particles when incubated with cells. Absorbance was measured at 570 nm using a Synergy H1 Multi-Mode Microplate Reader (BioTek Instruments, Inc.; Winooski, VT).
2.6. Electron spin resonance
Electron spin resonance (ESR) trapping with 5′5-dimethylpyrroline N-oxide (DMPO) was used to detect the presence of short-lived free radical intermediates. The ability of FSD to produce the hydroxyl radical (˙OH) under Fenton-like reaction conditions with exposure to hydrogen peroxide (H2O2) and in cultured cells was determined using a quartz flat cell assembly and Brüker EMX spectrometer (Billerica, MA). RAW 264.7 cells were used at a final concentration of 106 cells/ml, along with 5 mg/ml FSD 8, and 200 mM DMPO, which were mixed with PBS and incubated at 37 °C for 5 min before being loaded into the flat cell for analysis. For acellular experiments, a final concentration of 5 mg/ml FSD, 10 mM H2O2 and 200 mM DMPO was used. Peak heights were representative of relative levels of spin-trapped ˙OH radicals.
2.7. Comet assay
RAW 264.7 cells were seeded at a density of 0.25 × 10⁶cells/well in 12-well plates and grown to 50% confluence and incubated with either 0.5 mg/ml or 1 mg/ml of an FSD 8 suspension, or 1 mM Cr (VI) (Na2Cr2O7; Sigma-Aldrich) as a positive control, for 4 and 24 h. Cells were then washed with PBS, scraped, and added to pre-warmed agarose glass slides. Using an alkaline unwinding solution, cells were then lysed and subjected to electrophoresis at 21 V and 50 mA (Trevigen, Inc.; Gaithersburg, MD) for 1 h, causing any fragmented DNA to migrate out of the nuclear region of cells. Cells were then fixed with 70% ethanol overnight and labeled with SYBR green dye (ThermoFisher) to bind double-stranded DNA. Images were acquired using an Olympus AX70 microscope with an Olympus DP73 digital camera (Olympus, Center Valley; PA). The Comet Assay IV software (Perceptive Instruments; Bury Saint Edmonds, UK) was used to count comet tails (n = 50 tails counted per experimental condition).
2.8. Intracellular ROS assay
Cells were seeded at a density of 5 × 10⁴ cells/well in 96-well plates and incubated with 2′,7′-dichlorohydrofluorescin diacetate (DCFH-DA), a cell permeable fluoroprobe, at a final concentration of 1 mM in serum-free DMEM for 45 min at 37 °C in a final volume of 200 μl per well. Cells were washed twice in PBS and DMEM was subsequently added back into the wells along with 1 or 5 mg/ml of the FSD 8 suspension, or 1 mM Cr (VI) as a positive control. Cells were then incubated for 1, 2, 4 and 6 h at 37 °C. Plates were read at 485 nm excitation/530 nm emission at the end of each respective time point to measure ROS production. For negative controls, DMEM and FSD were plated in wells in the absence of DCFH-DA, and readings were subtracted from those taken when exposed cells were present to account for any autofluorescence.
2.9. Enzyme linked immunosorbent assay (ELISA) of cytokines
Commercially available kits for the cytokines TNFα and IL-6 were purchased from R & D Systems (Minneapolis, MN) and ET-1 kits were purchased from Enzo Life Sciences (Farmingdale, NY). The methods followed the manufacturer’s instructions. Cell culture supernatant was collected from murine macrophages exposed to either 1 mg/ml or 5 mg/ml FSD 8 for 4 h or 24 h and stored at −80 °C until ready for analysis.
2.10. Immunofluorescence
Cells were seeded at a density of 2 × 10⁵ cells/chamber in Falcon chamber slides (ThermoFisher) and allowed to attach for 24 h. Cells were then exposed to suspensions of FSD 8 for 24 h. Cells were subsequently rinsed three times with PBS, followed by 10% neutral buffered formalin fixation, for a total of 30 min. Cells were then rinsed with PBS and blocked at room temperature for 3 h with 2% BSA + 0.3% Triton-X solution, followed by an overnight incubation at 4 °C with a primary antibody for TNFα (Ab6671; Abcam, Cambridge, MA). The following day, cells were rinsed with PBS and incubated with a fluorescent-tagged secondary antibody (Ab15007) for 45 min. Cells were again washed with PBS, mounted with medium containing DAPI for nuclear staining (Ab104139) and cover-slipped. Random images (n = 4) from each treatment group were taken using an Olympus AX70 upright microscope.
2.11. Enhanced dark-field microscopy (EDM)
EDM was used to detect particles in RAW 264.7 cells treated with FSD over a period of 24 h. The enhanced dark-field optical system images scattered light, and particles present produce an image with an intensity that is approximately 20-fold greater than surrounding tissues, which do not significantly scatter light, allowing visualization of the particles.
For detection of FSD 8 particles by EDM, the optical microscopes consisted of a transmitted light microscope (Olympus B63 with motorized condenser, controller and reflected light system) and a CytoViva EDM (CytoViva; Auburn, AL). The CytoViva EDM has a high signal-to-noise, dark field-based illumination optics adapted to an Olympus BX41 microscope (Olympus America Inc.; Center Valley, PA) which also includes a hyperspectral imaging camera with ENVI 4.8 analysis software and the CytoViva 3-D positioning and analysis software for serial section reconstruction. Both the transmission light microscope and EDM were equipped with an Olympus DP73 digital camera with Cellsens Dimension camera control and measurement software (Olympus America Inc.). Images for both systems were taken at either high-resolution 4800 × 3600 pixels or 2400 × 1800 pixels.
2.12. Statistical analysis
Statistical analyses of results were run using either one-way or two-way analysis of variance (ANOVA) models using Tukey’s post hoc comparisons on GraphPad Prism 6.0 (San Diego, CA). Calculations for the percent DNA in comet-tails was performed with Perceptive Instruments Comet Assay IV. Differences were regarded as significant when P < 0.05.
3. Results
3.1. Negligible endotoxin units detected with LAL
Under standard conditions, it was determined that the FSD suspension contained 0.19 endotoxin units (EU). This was not significantly different when compared to the reagent blank, and was regarded as an amount insufficient to contribute to inflammatory responses.
3.2. Active bacterial growth not a likely source of observed inflammatory response
Results will be presented below indicating that FSD 8 initiated inflammatory responses. Thus, bacterial and fungal ribosomal DNA regions were amplified using universal primer sets and sequenced to identify the microbial species present in FSD 8 before and after washing in PBS. Bacterial, but not fungal, rDNA was visualized using agarose gel electrophoresis (data not shown). To characterize further the bacterial composition of FSD 8, the amplified DNA was sequenced to taxonomically identify the bacteria and determine if there were species unique to the fracking sand. Twenty species were identified in the four samples sequenced. Of those 20, 6 species were detected in the extraction reagent control and made up almost 70% of the sequences identified in the three other samples. The remaining 14 species identified in the FSD 8 and PBS control are presented in Table 1. Four of these, Microococcus sp., Bacillus cohnii, Enterococcus cecorum, and Leptotrichia buccalis, were unique to the washed FSD 8, but did not appear in great abundance to suggest active growth.
Table 1.
Identification of bacterial species in FSD 8 following 16S rDNA sequence analysis.
| Bacterial OTU Identification | PBS | Neat FSD 8 | Washed FSD 8 |
|---|---|---|---|
| Corynebacterium durum | 0.00% | 4.35% | 0.00% |
| Corynebacterium tuberculostearicum | 0.00% | 8.70% | 0.00% |
| Micrococcus sp. | 0.00% | 0.00% | 4.35% |
| Actinobacteria sp. | 4.17% | 0.00% | 0.00% |
| Porphyromonadaceae sp. | 0.00% | 4.35% | 0.00% |
| Bacillus cohnii | 0.00% | 0.00% | 4.35% |
| Gemella haemolysans | 4.17% | 0.00% | 8.70% |
| Staphylococcus epidermidis | 0.00% | 8.70% | 4.35% |
| Carnobacterium divergens | 0.00% | 4.35% | 4.35% |
| Enterococcus cecorum | 0.00% | 0.00% | 8.70% |
| Lactobacillus jensenii | 0.00% | 4.35% | 0.00% |
| Streptococcus parasanguinis | 4.17% | 0.00% | 0.00% |
| Leptotrichia buccalis | 0.00% | 0.00% | 8.70% |
| Neisseriales sp. | 0.00% | 4.35% | 0.00% |
3.3. FSD causes a decrease in cellular viability at 24 h
The enzymatic cleavage of the tetrazolium salt WST-1 to formazan was used to assess cellular viability in cells at the 4 and 24 h time points. A significant decrease in viability was observed in cells treated with 5 mg/ml FSD at 24 h when compared to 4 h and also to PBS controls. The treatment of cells with 1 mg/ml FSD did not have any detectable effects on viability over the course of time (Fig. 2).
Fig. 2.
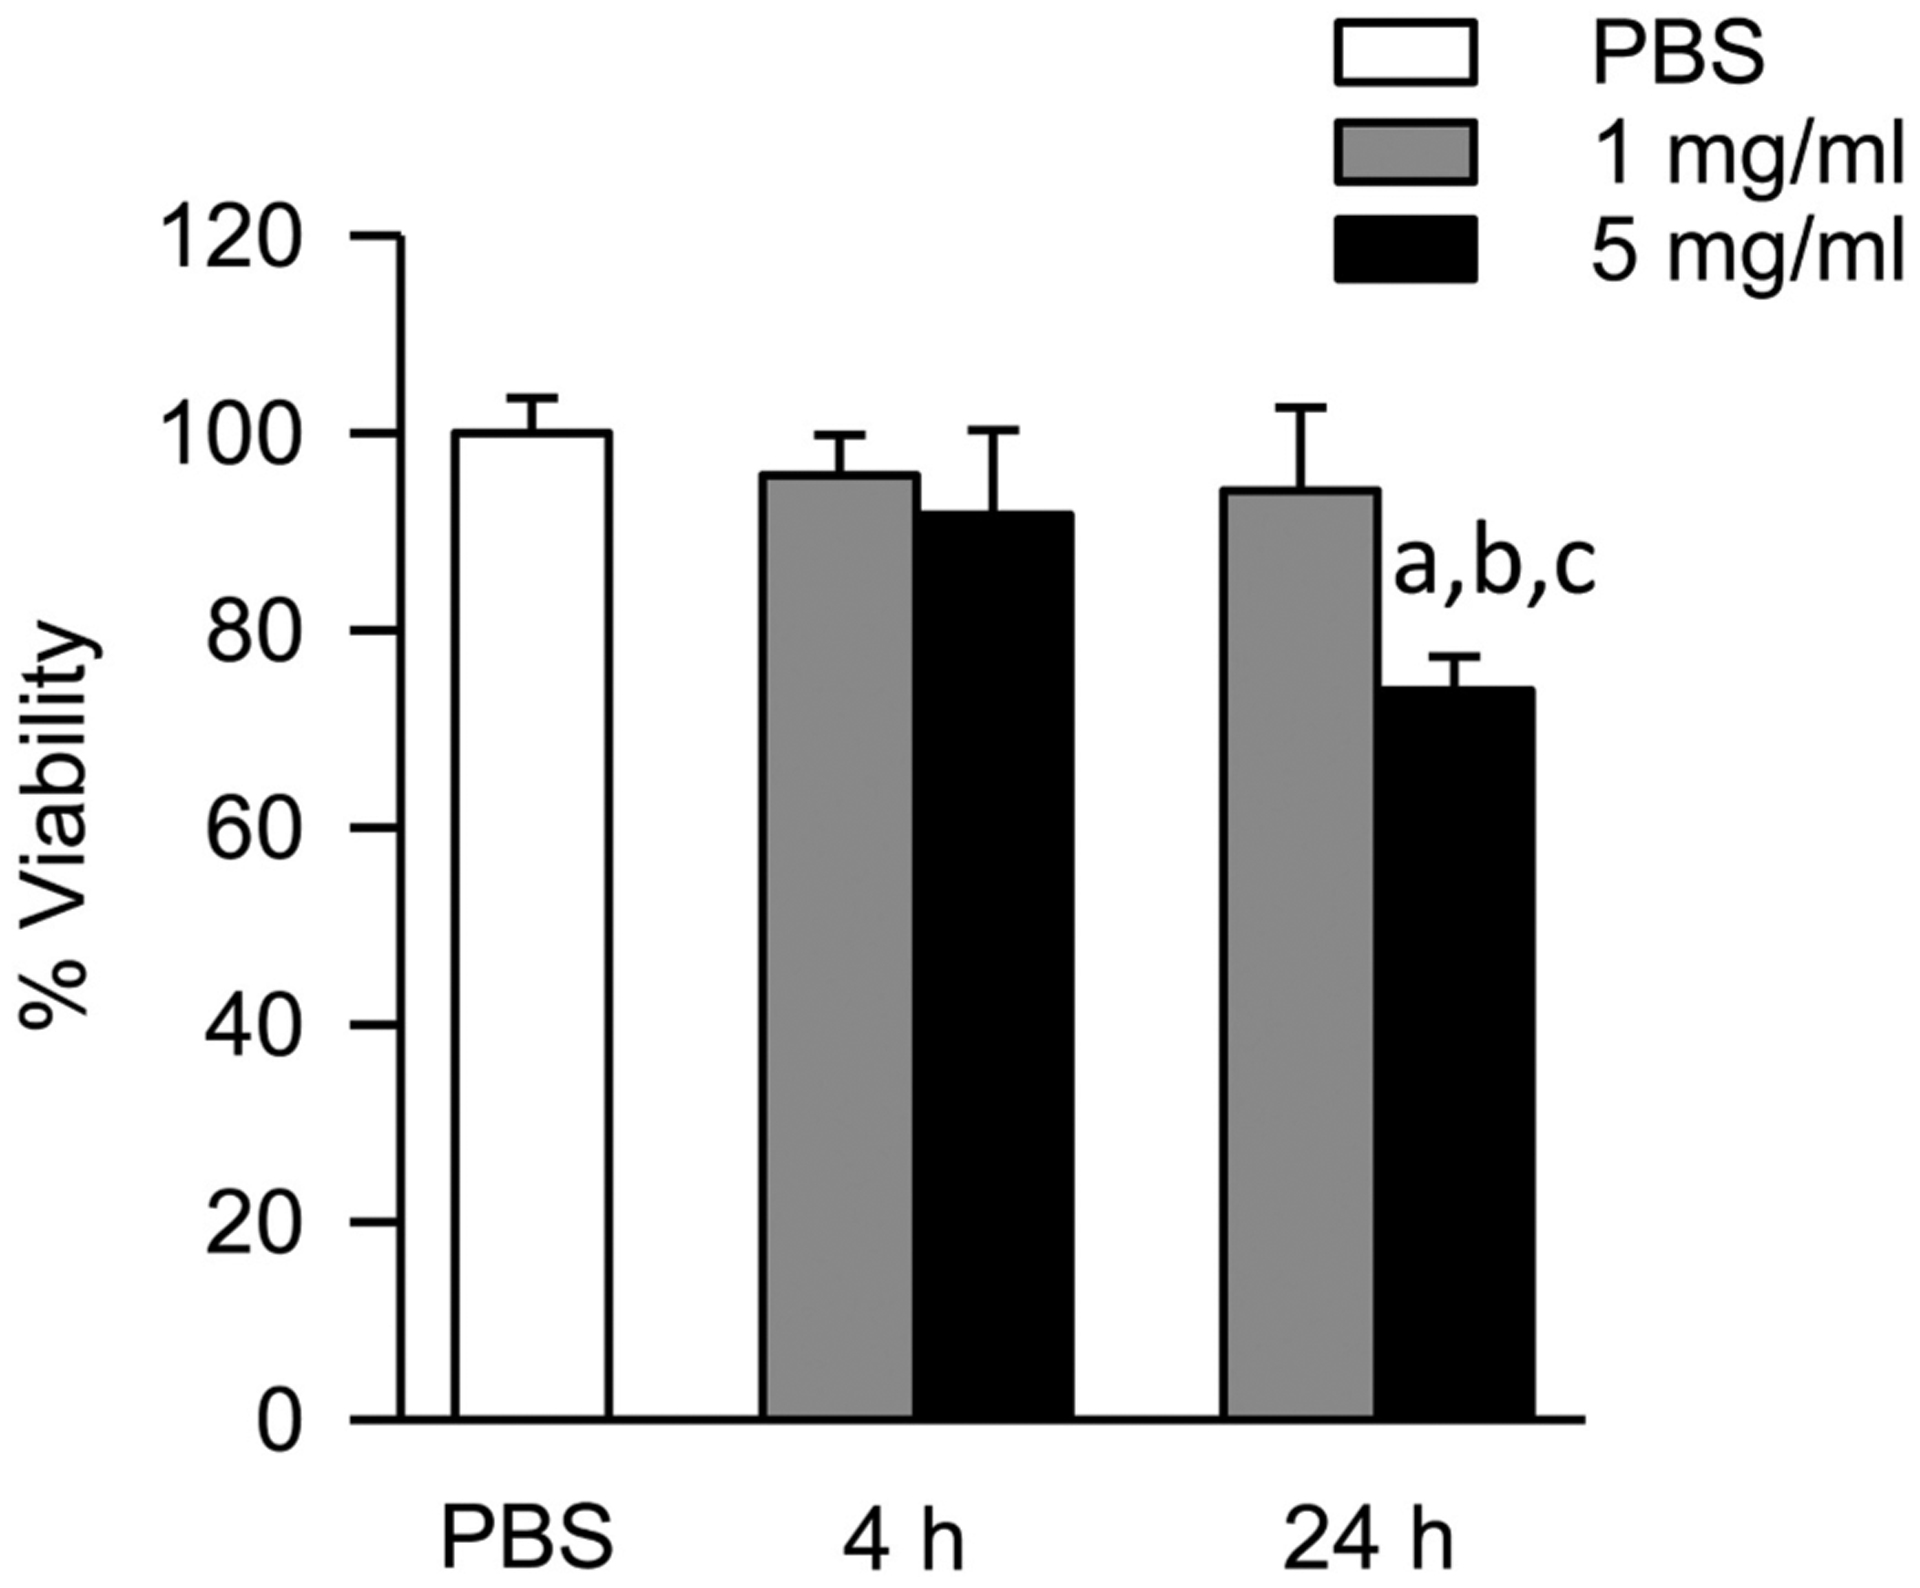
Effect of FSD 8 on cell viability. At 24 h, a significant decrease in cellular viability was observed in the 5 mg/ml treatment group when compared to PBS controls. The viability of cells treated with 5 mg/ml FSD was decreased significantly at 24 h when compared to 4 h. aFSD 8 vs. PBS; b4 h vs. 24 h (within dose); cmg/ml vs. 5 mg/ml.
3.4. FSD produces significant amounts of ˙OH in an acellular system
Acellular Fenton-like reactions with the FSD 8 suspension produced significantly greater levels of ˙OH radicals when compared to the negative control, with representative ESR spectra shown (Fig. 3A and B, respectively). Cellular ESR also was performed, but no peaks were detected (data not shown).
Fig. 3.
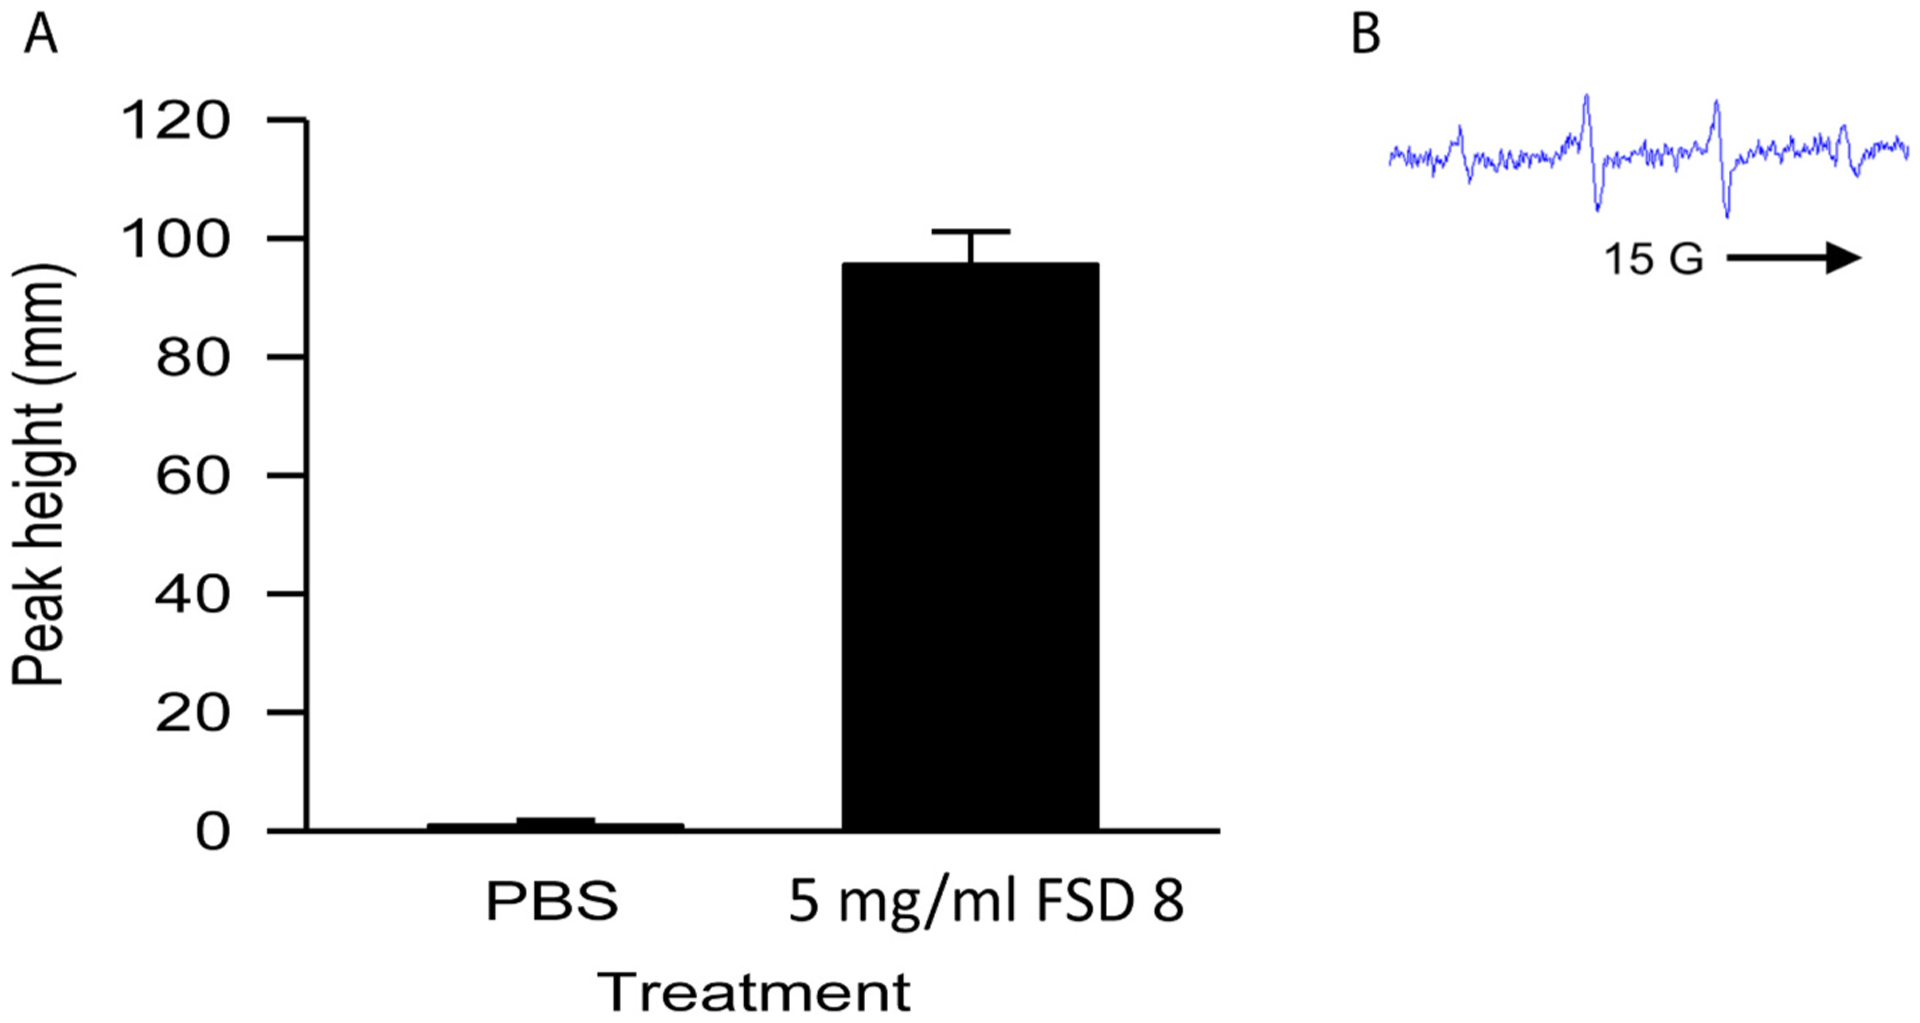
˙OH production stimulated by FSD 8 in an acellular system. Signal intensity (peak height) was used to measure by ESR the relative amounts of ˙OH produced. A) Fenton-like reactions were carried out in an acellular system using FSD 8 suspensions. B) Representative spectra is shown. aFSD 8 vs. PBS.
3.5. Significant intracellular ROS production detected in supernatants after incubation with FSD 8
DCFH-DA was used to measure the intracellular production of ROS in RAW 264.7 cells over the course of a 4 h-incubation. Between 2 and 4 h, both doses of FSD 8, as well as the positive control, Cr(VI), resulted in significantly greater intracellular ROS levels when compared to the PBS controls (Fig. 4).
Fig. 4.
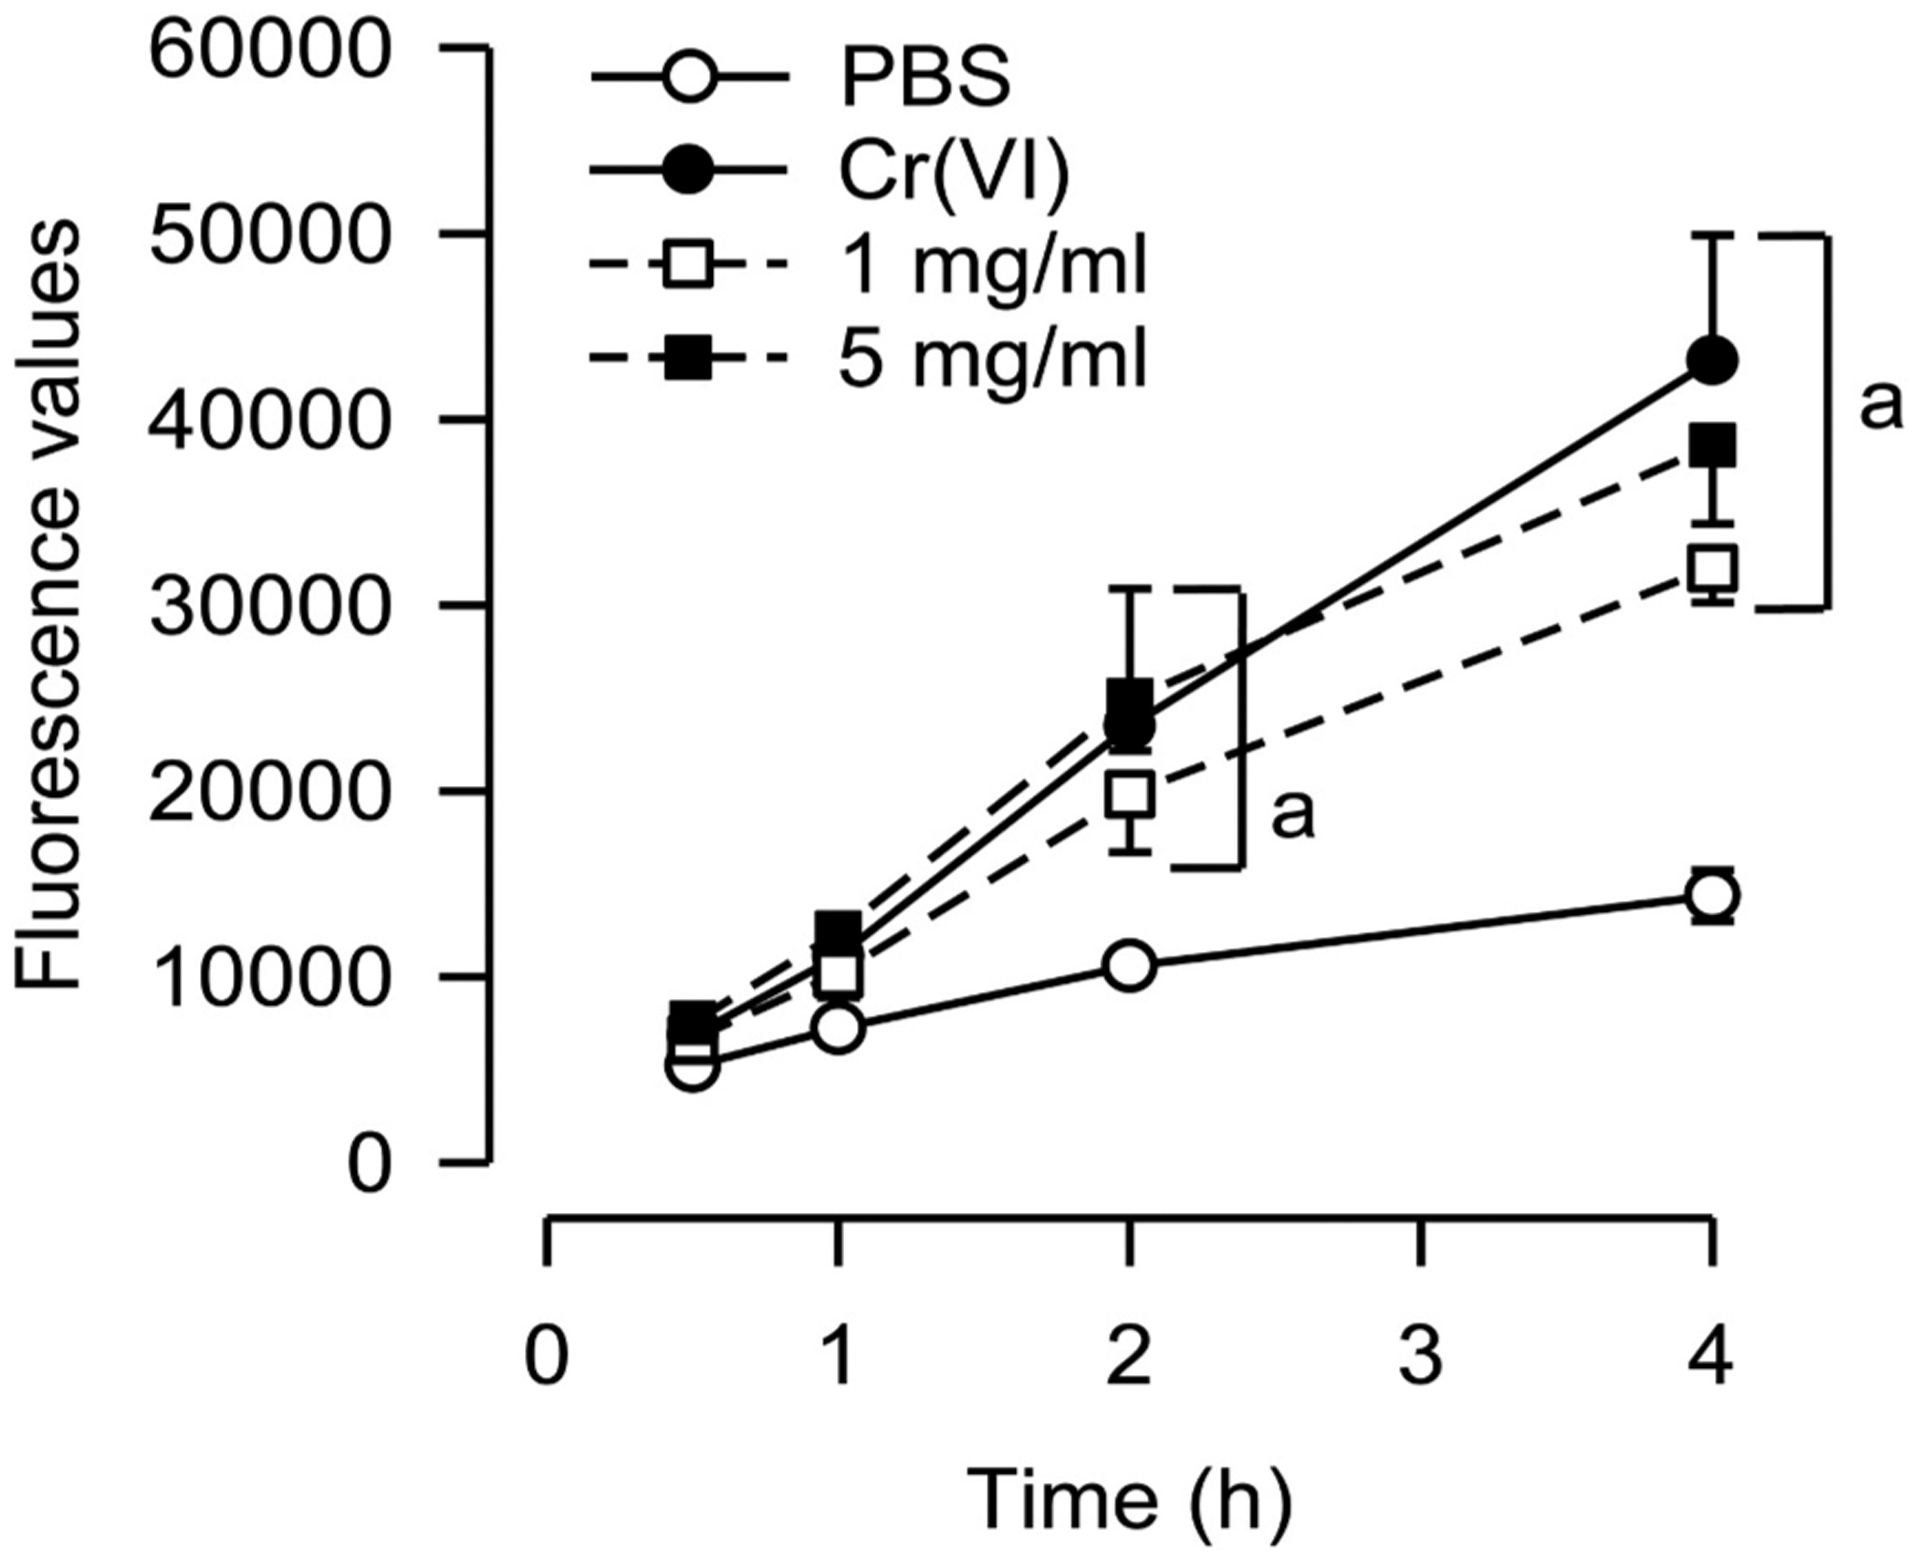
Intracellular ROS production in FSD 8 supernatants. At the 2 h and 4 h time points, both concentrations of FSD 8 produced significant amounts of intracellular ROS when compared to PBS. aFSD vs. PBS.
3.6. DNA damage in comet tail assays increases with dose
Using the COMET assay, damage to nuclear DNA was assessed. Both 0.5 and 1.0 mg/ml FSD 8 produced significantly greater damage to DNA when compared to PBS. As the dose of FSD was increased from 0.5 mg/ml to 1.0 mg/ml, a significant increase in the percentage of DNA in comet tails was observed (Fig. 5A). Representative images from treatment groups revealed a heterogeneous response, with the majority of cells in the Cr(VI) and FSD 8 treatment groups producing COMET tails (Fig. 5B).
Fig. 5.
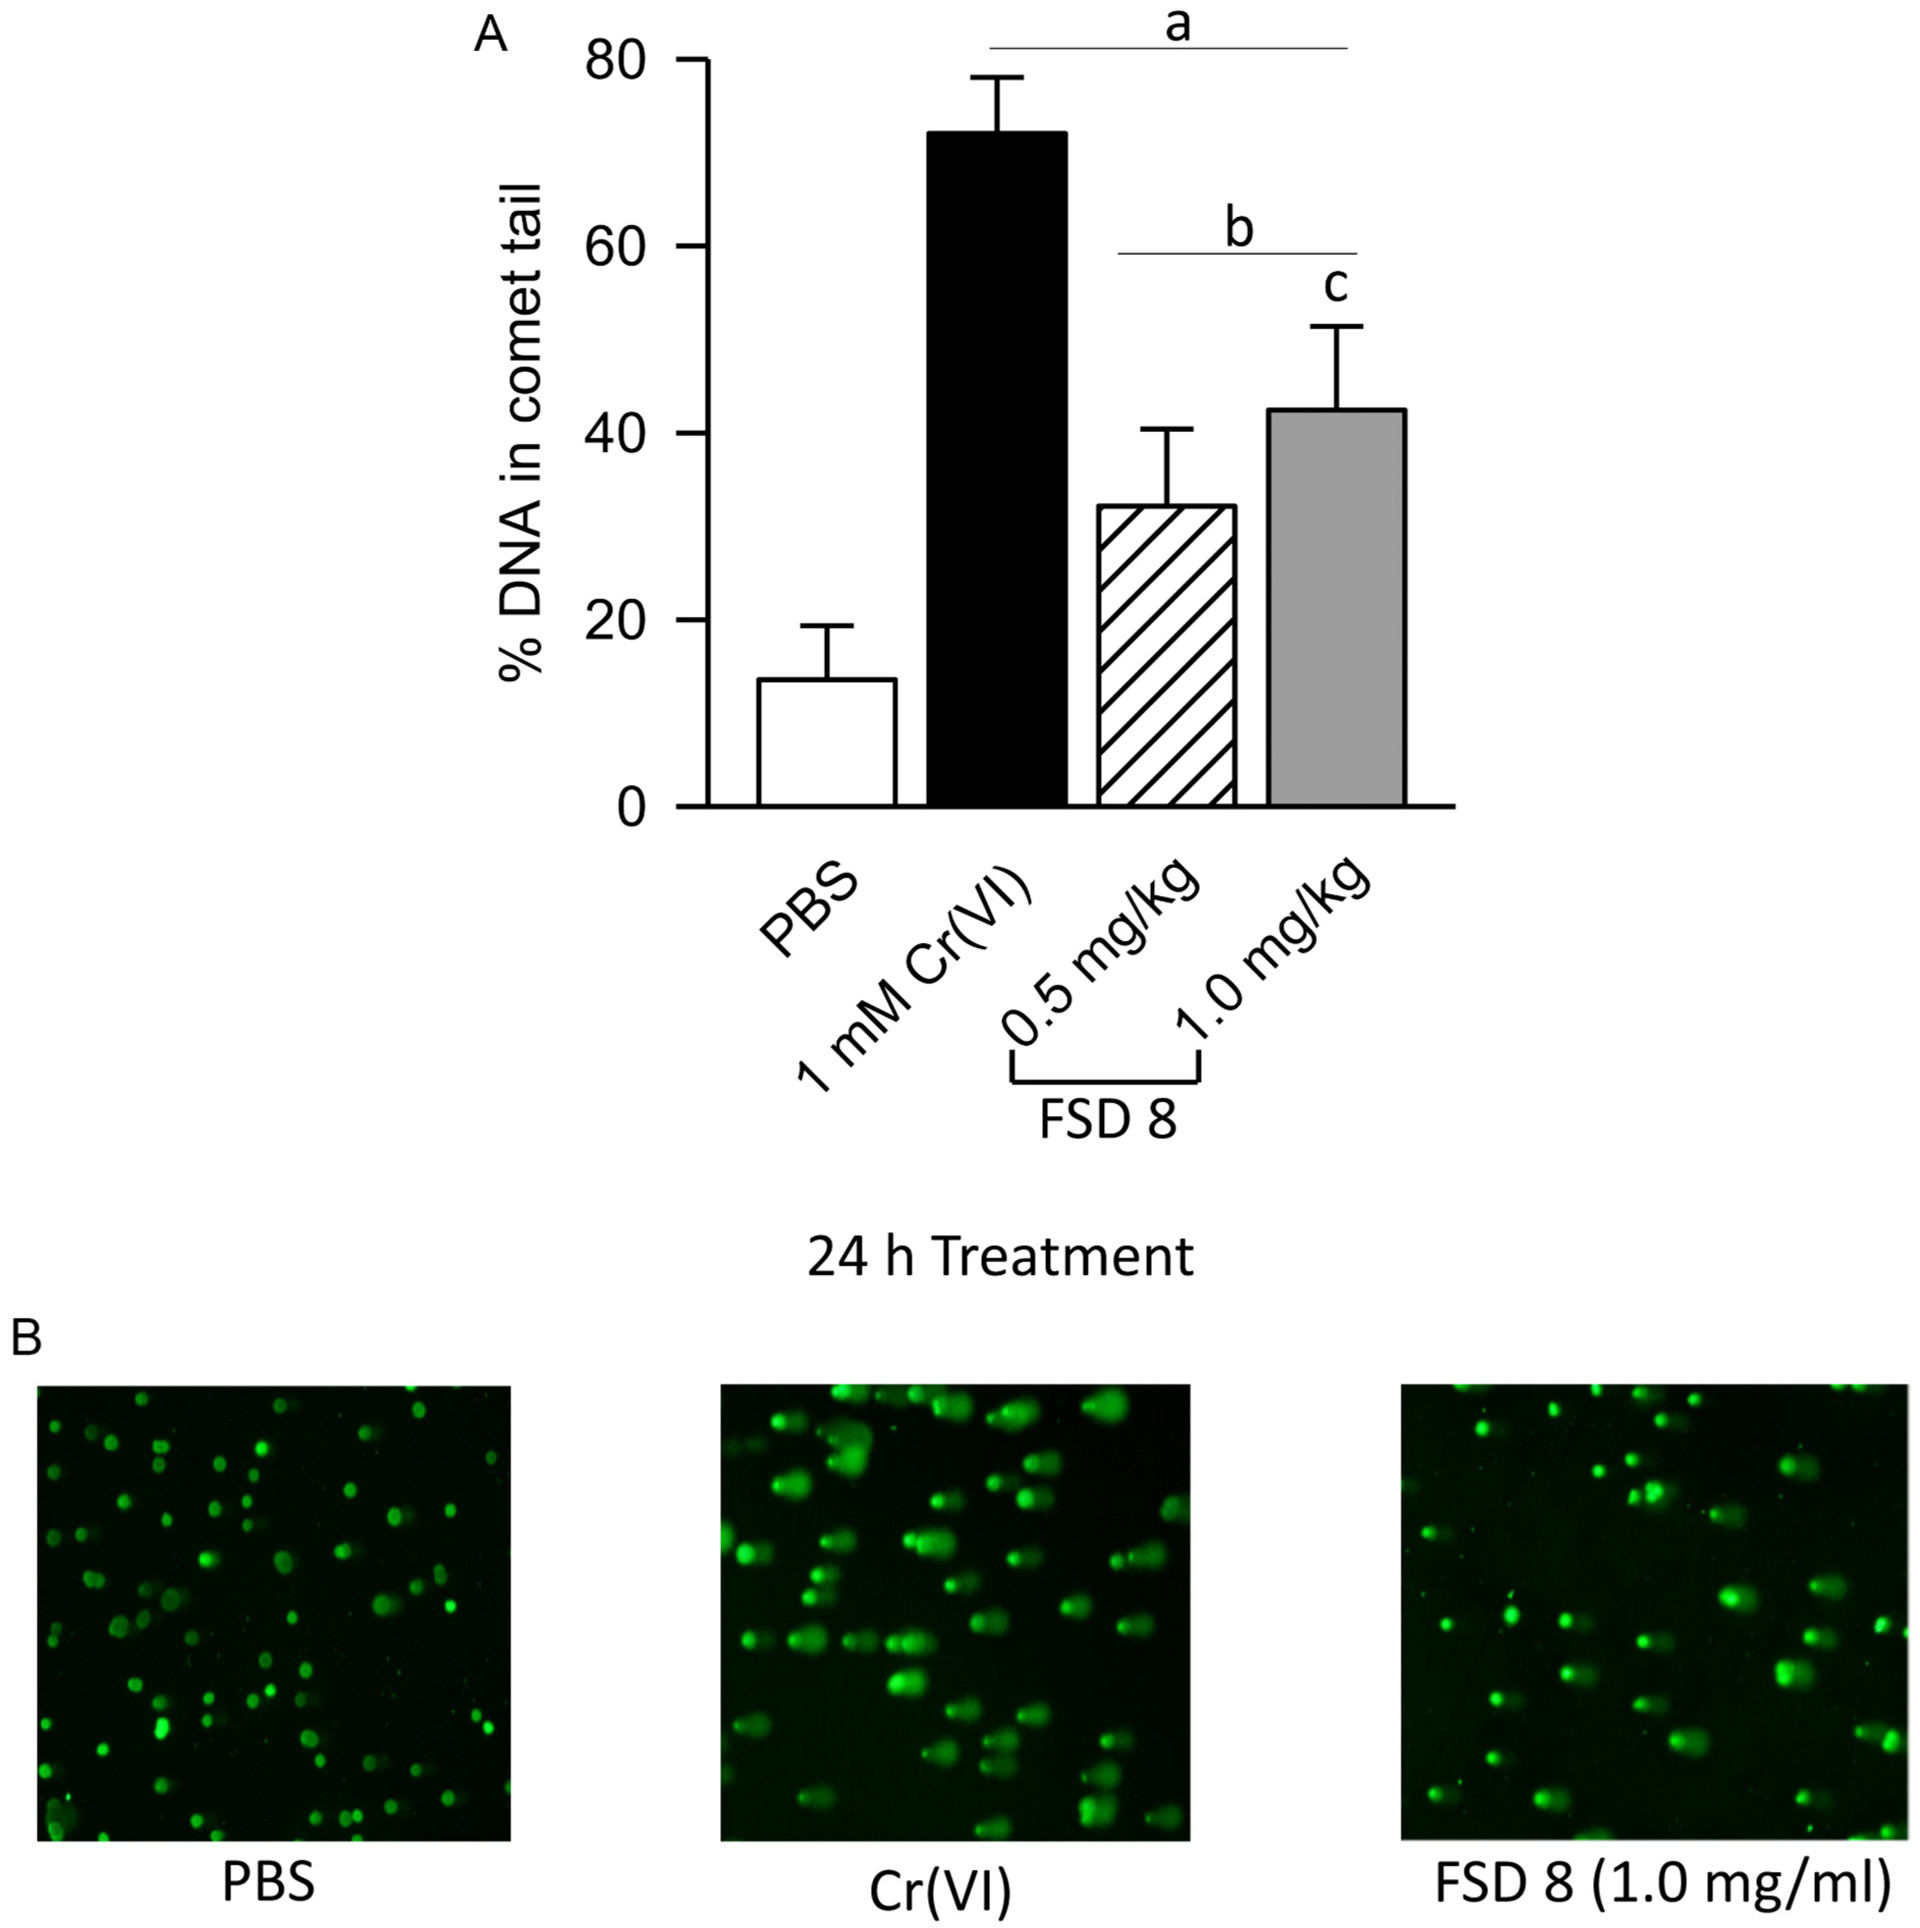
FSD 8 causes DNA damage. A) At 0.5 mg/ml and 1.0 mg/ml, FSD 8 produced significantly greater and dose-dependent damage to DNA when compared to PBS controls. B) Micrographs are representative images of RAW 264.7 cells treated with FSD 8 at the 24 h time point. aFSD 8 vs. PBS; aFSD vs. Cr(VI); c0.5 mg/ml vs. 1.0 mg/ml.
3.7. Pro-inflammatory cytokine response
The production of TNFα and IL-6 were measured in supernatants after 4 and 24 h incubation. TNFα production peaked at 24 h, with the 5 mg/ml treatment group producing ten times more TNFα compared to baseline PBS levels (Fig. 6A). For IL-6, the 5 mg/ml treatment group caused significantly greater production of cytokines at 24 h when compared to PBS controls, and also when compared to 1 mg/ml FSD 8 treatment at 4 h and both treatment groups at 24 h (Fig. 6B).
Fig. 6.
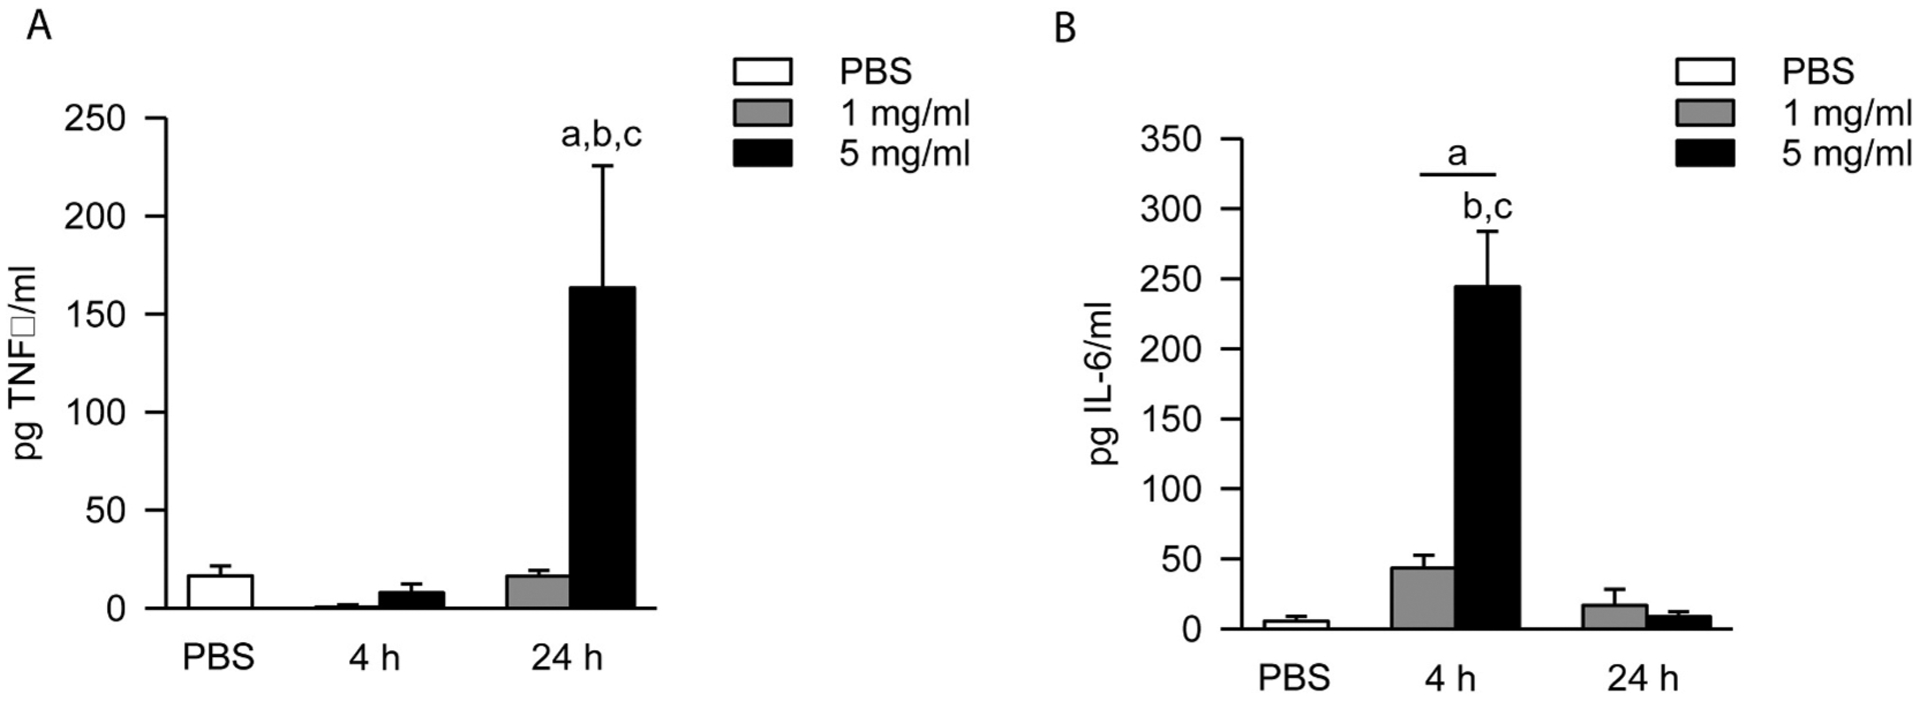
Time- and dose-dependent production of TNFα and IL-6 in response to FSD 8 treatment. (A) At 24 h, RAW 264.7 cells treated with 5 mg/ml FSD 8 produced significantly greater amounts of TNFα when compared to PBS controls, and also when compared to treatment with 1 mg/ml FSD 8. TNFα was not up-regulated at the 4 h time point by treatment with either dose. aFSD 8 vs. PBS; b4 h vs. 24 h (within dose); c 1 mg/ml vs. 5 mg/ml (within time point). (B) Peak IL-6 production occurred at 4 h. At 4 h, both the 1 mg/ml and 5 mg/ml treatment groups caused significant production of IL-6 when compared to controls. By 24 h, the IL-6 returned to near-baseline levels. aFSD 8 vs. PBS; bmg/ml vs. 5 mg/ml (within time point); c 4 h vs. 24 h (within dose).
3.8. ET-1 increased in response to FSD
ET-1 is a highly regulated pro-inflammatory mediator. After incubation with 5 mg/ml, FSD 8 caused a significant increase in ET-1 production at 24 h when compared to controls. No significant differences were detected between the 1 and 5 mg/ml and FSD 8groups (Fig. 7).
Fig. 7.
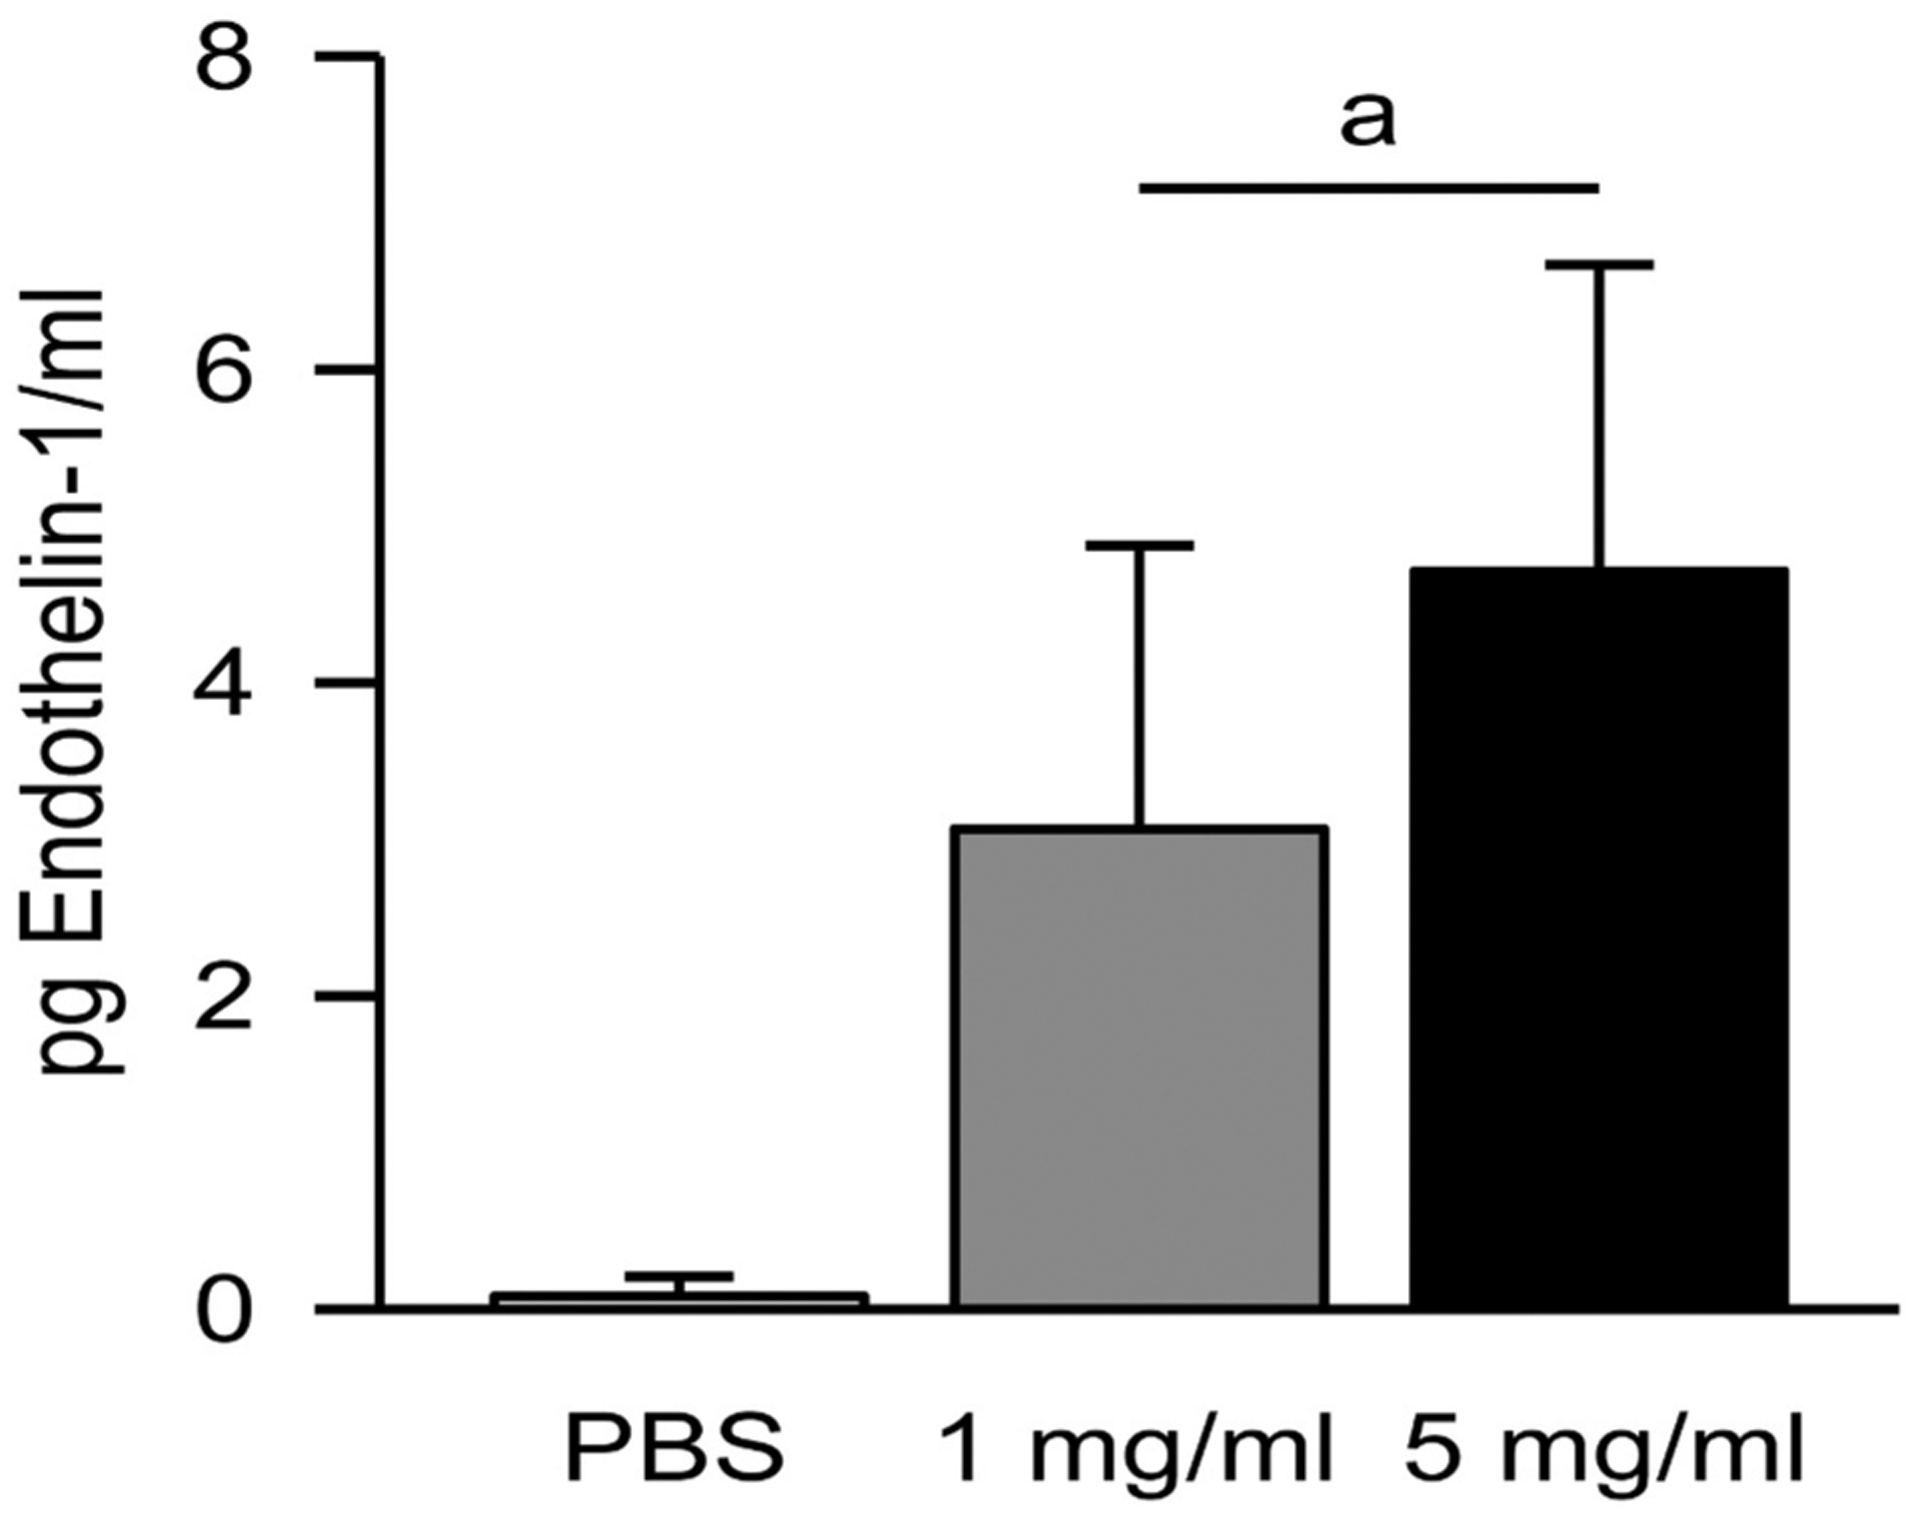
Increase of ET-1 levels following incubation with FSD 8. Both doses of FSD 8 caused a significant increase in ET-1 production by cells at 24 h when compared to PBS. aFSD 8 vs. PBS.
3.9. Immunofluorescent staining for TNFα reveals abnormal cellular morphology
RAW 264.7 cells exposed to PBS for 24 h appeared normal in size and morphology after staining for TNFα (Fig. 8A). After cells were treated for 24 h with FSD 8, irregular morphology and cellular blebbing was observed around the membrane of the cells (red arrows), with the blebs having increased intensity of TNFα staining (Fig. 8B). Upon observation with 40× magnification, the cell nuclei also appeared granulated (Fig. 8C).
Fig. 8.
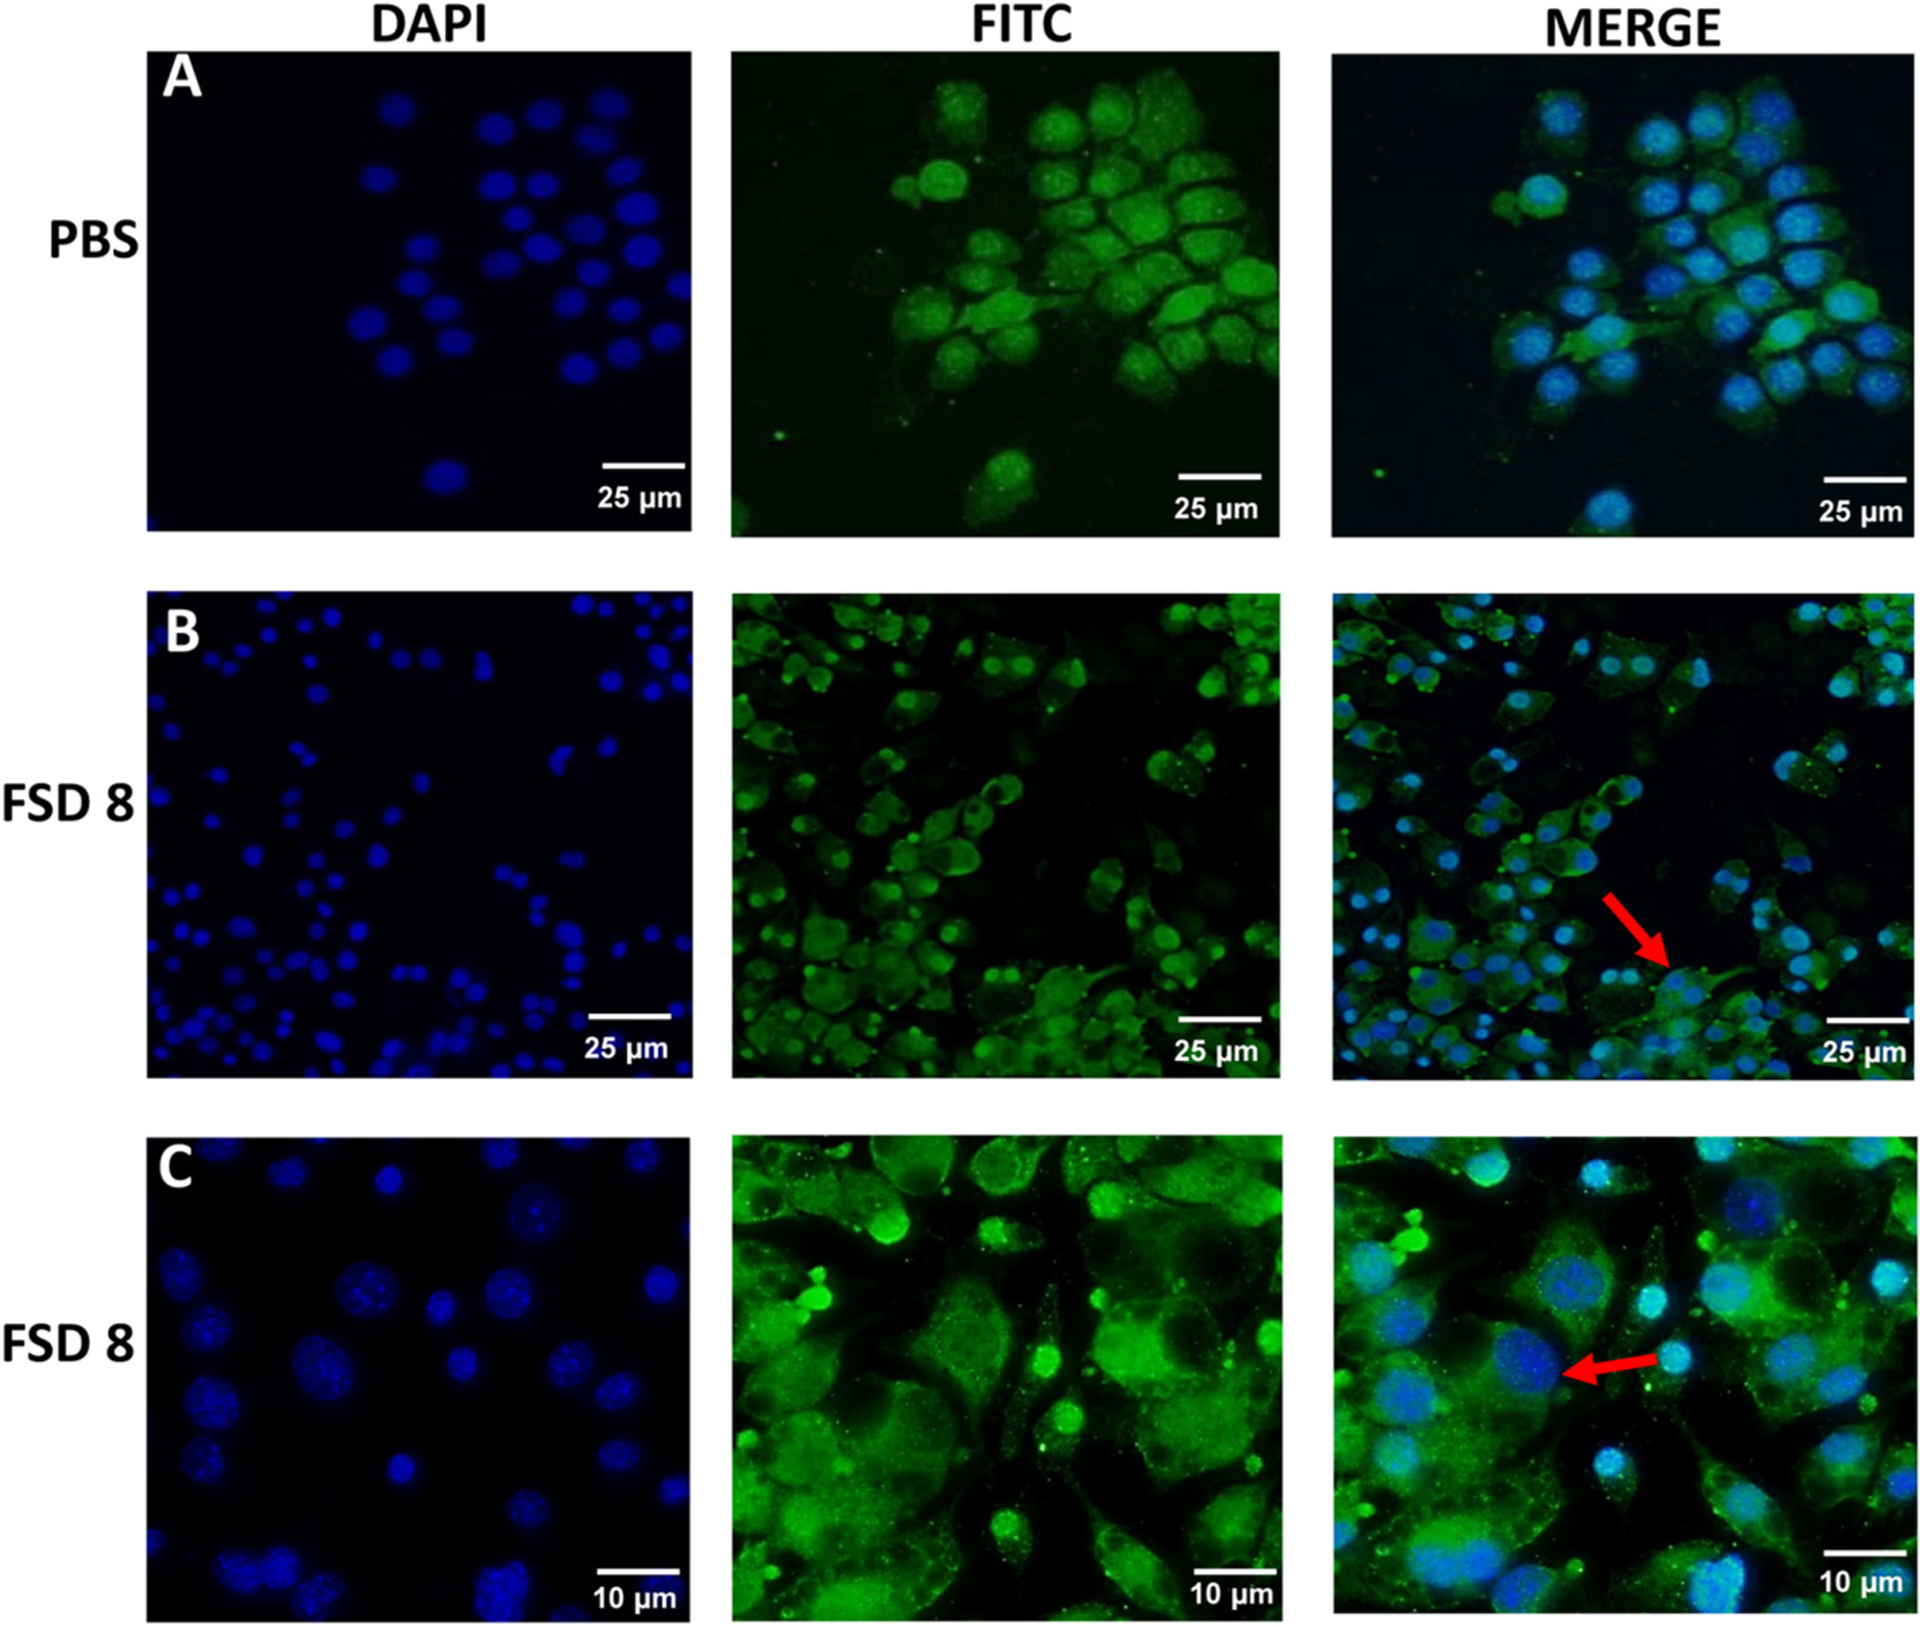
Cellular blebbing and stress in response to treatment with FSD 8. All images were taken at 20× magnification unless noted otherwise. Row A, RAW 264.7 cells exposed to PBS for 24 h. Row B, Cells treated with FSD 8 display irregular morphology, granulated nuclei, and cellular blebbing (red arrow). Row A and B, bar = 25 μ. Row C, bar = 10 μ.
3.10. Electron dark field microscopy shows FSD engulfment by macrophages
In macrophage cells exposed to FSD for 24 h, there was nearly complete phagocytosis of particles. In addition, anuclear cell fragments and nuclear cellular condensation was also observed (red arrows) along with plasma membrane blebbing (white arrow; Fig. 9).
Fig. 9.
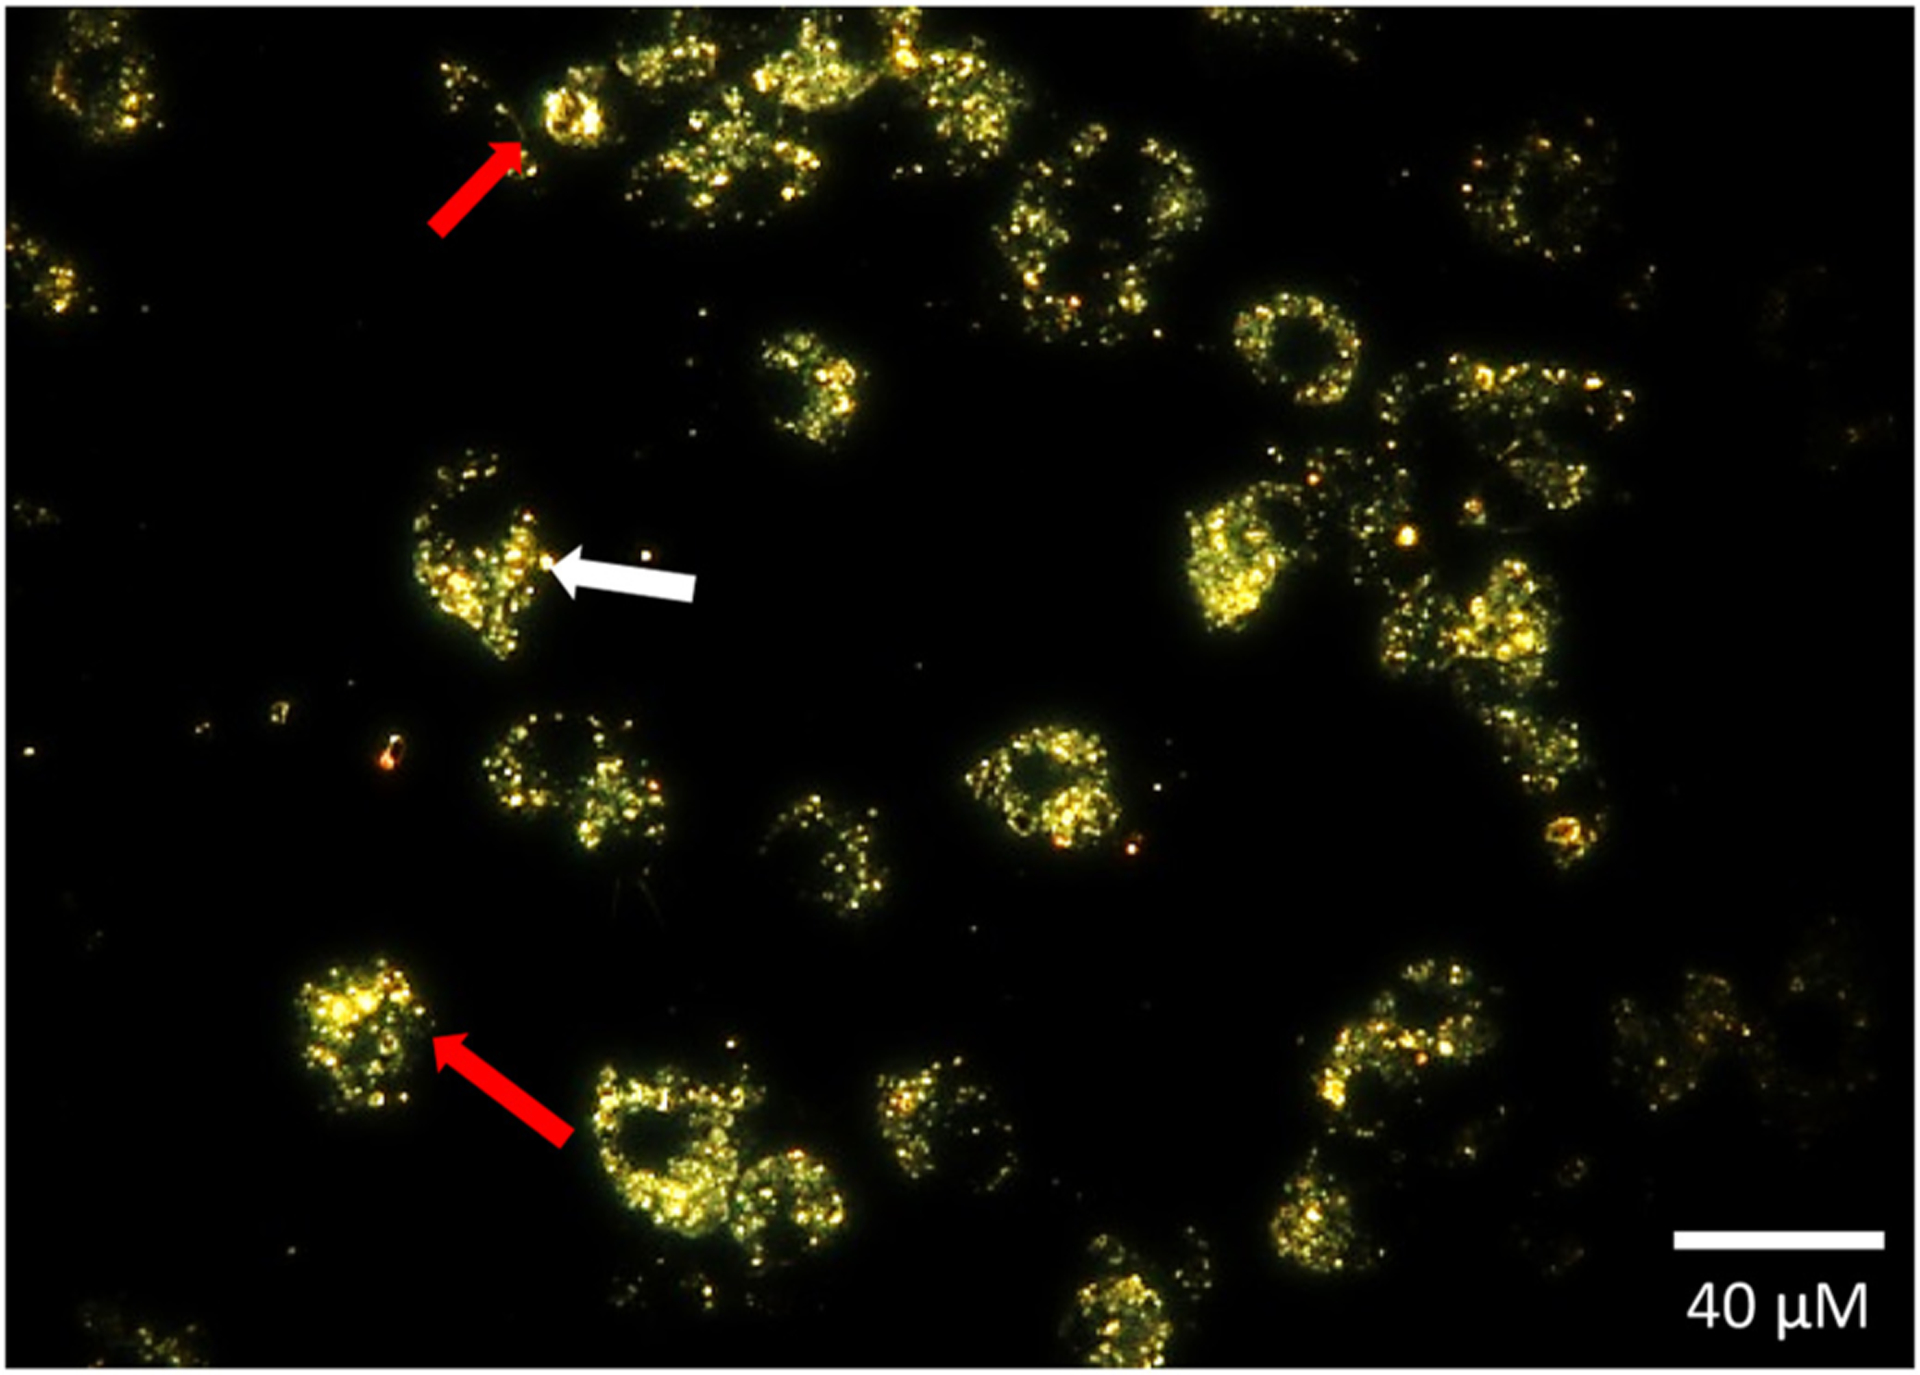
RAW 264.7 cells phagocytize FSD 8. Anuclear cell fragments and nuclear condensation were observed (red arrow), along with plasma membrane blebbing (white arrow) in cells exposed to FSD 8 for 24 h. Bar = 20 μ.
4. Discussion
This investigation brings to light, the ability of FSD 8 to induce a pro-inflammatory and pro-oxidant state in murine macrophage cells, over the course of 24 h. We observed decreased cellular viability, increased intracellular ROS production, increased nuclear damage, and increased production of TNFα, IL-6, and ET-1 in supernatants. The observed effects of FSD 8 on the macrophages can most likely be attributed to the dust particles, though particle size, the presence of other elements, and the potential presence of a not-yet-identified activity extracted from FSD 8 may also play a role.
It is known that macrophages internalize silica particles and cause cell death, acting as an underlying pathway in the eventual development of silicosis (Gilberti et al., 2008; Hamilton Jr. et al., 2008; Sandberg et al., 2012). Costantini et al. (2011) has shown previously that epithelial cells (HeLa, MDCK, and NIH-3T3) and carcinoma cells (B16F1 and MtLN3) do not exhibit cell death after a 24 h exposure to crystalline silica particles, but mouse macrophage cell lines do, highlighting the extreme sensitivity of macrophage cells to silica particles, when compared to epithelial and carcinoma cells(Costantini et al., 2011).
In the current study, a decrease in macrophage viability was observed after exposure to FSD 8 for 24 h in the 5 mg/ml treatment group. Aside from the aforementioned sensitivity of macrophages to silica, other investigators have also found that the size of amorphous and crystalline particles also play a role in macrophage cytotoxicity and inflammatory responses (Sandberg et al., 2012; Kusaka et al., 2014; Kim et al., 2015). The size of FSD particles used in our study ranged from 12 nm to 471 nm as determined with Nanosight; these sizes place these particles in the respirable range. In the literature, the relationship between silica particle size and cellular viability in other cell lines remains controversial, as some investigators have found that increased particle size leads to decreased cellular viability, while others have found the opposite to be true (Chang et al., 2007; Gonzalez et al., 2010; Lu et al., 2011; Kim et al., 2015). Since FSD 8 is comprised of silica and other elements, understanding how the respirable particle sizes inhaled at the workplace affects the viability and function of pulmonary cells is necessary.
In 1997, the International Agency for Research on Cancer (IARC) classified crystalline silica as a Group 1 carcinogen, as there was sufficient evidence for carcinogenicity in experimental animals and humans (IARC, 1997). This classification was sustained in 2012, and the IARC concluded that the tumor response in rat lungs exposed to crystalline silica was likely due to an impairment of “alveolar-macrophage-mediated particle clearance, thereby increasing persistence of silica in the lungs, which results in macrophage activation, and the sustained release of chemokines and cytokines” (IARC, 2012).
Though not directly, we did investigate the ability the cells to generate ROS (both intracellular ROS and ˙OH) and initiate DNA damage in response to FSD 8; both are mechanisms through which silica particles can initiate genotoxicity (Schins and Knaapen, 2007; Azad et al., 2008; Borm et al., 2011). A review by Borm et al. confirms that, in macrophages, RCS can induce weak genotoxic effects. However, factors such as cell type, pre-treatment, and addition of the sample to cell culture medium, must all be considered before a direct comparison between RCS and in vitro genotoxicity can be made (Borm et al., 2018). The FSD used in these experiments, though comprised mainly of crystalline silica, also contained many other elements (Fedan et al., 2020). Using ESR, silica, as well as the transition metals iron and manganese, have all been shown to generate ˙OH in RAW 264.7 cells (Shi et al., 1998; Leonard et al., 2004; Badding et al., 2014). With an abundance of evidence pointing to the fact that ˙OH should have been generated in our system, we were unable to detect it. It is possible that, in the presence of cells, the particle surface or the other elements that mask the ESR signal quench the expected reaction. Near-completion phagocytosis of free FSD 8 particles, along with nuclear fragmentation and condensation, were observed using EDM. It is also possible that the engulfment of these particles somehow affected the ability of RAW 264.7 cells to release detectable levels of H2O2 during phagocytosis. Alternately, the lack of ˙OH detection in cells could also have been because the FSD 8 was not freshly fractured, but aged. ESR signal intensity has been shown in cells to be inversely related to silica age (Dalal et al., 1990; Castranova et al., 1996). Cell type has also been shown to play a role in whether ESR peaks can be detected in a cellular system. Both freshly fractured and aged silica have been shown to induce ESR peaks in human lung cancer cells that were p53-defective, but not in BEAS-IIB cells that were p53-efficient (Gwinn et al., 2009). We were only able to detect the presence of ˙OH in an acellular system, generated through a series of Fenton-like conditions.
The COMET assay is used to detect low levels of DNA damage in various cell types. In our system, both concentrations of FSD 8 caused significantly more damage to DNA when compared to the negative control, in a dose-dependent matter. Intracellular ROS production was also time and dose-dependent. Taken together with the COMET assay results, this suggests that the ˙OH radical was not the major source of the observed toxicities.
Lastly, we also measured the levels of cytokine production in the supernatants from cells exposed to FSD 8. The production of TNFα requires activation of the transcription factor NF-κβ, and, in macrophages, NF-κβ expression has been shown to increase upon silica exposure (Chen et al., 1995; Harijith et al., 2014; Kawasaki, 2015). During silica-induced inflammation, TNFα has been shown to increase the expression and production of IL-6, another pro-inflammatory cytokine that is involved in the first, inflammatory stage of silicosis progression (Lopes-Pacheco et al., 2016; Zelko et al., 2016). Upon exposure to FSD 8, peak IL-6 production was observed at 4 h in both the 1 and 5 mg/ml treatment groups, reaching levels of up to 240 times greater than baseline. In contrast to IL-6, peak TNFα production was observed at 24 h, but only the 5 mg/ml treatment was able to elicit a response from RAW 264.7 cells. This increase in TNFα at 24 h is consistent with the observed immunofluorescent staining, which showed membrane blebbing and loss of cellular morphology at this time point, as well as nuclear condensation and anuclear cell fragments observed with EDM. Silica-induced inflammation in U937-differentiated macrophages has been shown to be mediated by the TLR4/MyD88/TIRAP signal pathway, which activates the NF-κβ p65 cascade, leading ultimately to the release of IL-1β, IL-6, and TNFα (Chan et al., 2018). Though our studies also show up-regulation of IL-6 and TNFα, further research would be necessary to understand the upstream signaling pathways specific to RAW 264.7 cells that lead to cytokine production.
We also studied the effects of FSD 8 on the production of ET-1. ET-1 is a potent pro-inflammatory mediator and vasoconstrictor, which is up-regulated in the setting of inflammation, and implicated in several disease states, such as pulmonary arterial hypertension, prostate, ovarian, and breast cancer, and pre-term birth in rodents (Smollich and Wulfing, 2007; Olgun et al., 2010, 2015; Chester and Yacoub, 2014; Niechi et al., 2015). During the recurring cycle of cell death and re-uptake of silica particles by alveolar macrophages, secreted inflammatory mediators can enter the pulmonary and systemic circulatory systems, leading to vascular injury. This recurring injury to the pulmonary vasculature can lead to pulmonary hypertension and the increase of ET-1 levels (Nemmar et al., 2001; Zelko et al., 2016). At 24 h, both doses of FSD 8 caused a significant increase in ET-1 levels when compared to PBS-exposed cells.
The results of this study shed light on the fact that the dust generated by manipulation of hydraulic fracturing sand is cytotoxic to RAW 264.7 cells. Unlike crystalline silica, the FSD used did not generate production of ˙OH in cells, but there was a strong cytokine response observed with IL-6, TNFα, and ET-1. Our investigation has shown that the complexity in the composition of FSD 8, composed of silica and other elements, gives rise to a cellular response that produces ROS, damages DNA, decreases viability, and increases inflammatory cytokine production. While much work has been done to understand silica toxicity and the progression of silicosis because of crystalline silica exposure in the workplace, a better understanding of FSD 8-induced cellular responses is also needed.
Supplementary Material
Acknowledgements
The authors would like to thank Dr. Brett Green (NIOSH, Morgantown, WV) and Ms. Angela S. Lemons (NIOSH, Morgantown, WV) for their assistance with 16s rDNA sequencing. Funding was provided by the National Institute for Occupational Safety and Health, Project Number 7927ZLDC.
Footnotes
Declaration of competing interest
The authors of this paper have no conflicts of interest to disclose.
Publisher's Disclaimer: Disclaimer
Publisher's Disclaimer: The findings and conclusions in this report are those of the authors and do not necessarily represent the official position of the National Institute for Occupational Safety and Health, Centers for Disease Control and Prevention. Mention of brand name does not constitute product endorsement.
References
- Anderson SE, Shane H, Long C, Marrocco A, Lukomska E, Roberts JR, Marshall N, Fedan JS, 2020. Biological effects of inhaled hydraulic fracturing sand dust. VIII. Immunotoxicity. Toxicol. Appl. Pharmacol (Manuscript submitted to this journal as a tandem paper to accompany this manuscript.). [DOI] [PMC free article] [PubMed] [Google Scholar]
- Azad N, Rojanasakul Y, Vallyathan V, 2008. Inflammation and lung cancer: roles of reactive oxygen/nitrogen species. J. Toxicol. Environ. Health B Crit. Rev 11, 1–15. [DOI] [PubMed] [Google Scholar]
- Badding MA, Fix NR, Antonini JM, Leonard SS, 2014. A comparison of cytotoxicity and oxidative stress from welding fumes generated with a new nickel-, copper-based consumable versus mild and stainless steel-based welding in RAW 264.7 mouse macrophages. PLoS One 9, e101310. [DOI] [PMC free article] [PubMed] [Google Scholar]
- Benson ME, Wilson AB, 2015. Frac Sand in the United States - A Geological and Industry Overview. U.S. Geological Survey Open-File Report 2015–1107, 78 p. 10.3133/ofr20151107. [DOI] [Google Scholar]
- Borm PJ, Tran L, Donaldson K, 2011. The carcinogenic action of crystalline silica: a review of the evidence supporting secondary inflammation-driven genotoxicity as a principal mechanism. Crit. Rev. Toxicol 41, 756–770. [DOI] [PubMed] [Google Scholar]
- Borm PJA, Fowler P, Kirkland D, 2018. An updated review of the genotoxicity of respirable crystalline silica. Part Fibre Toxicol 15, 23. [DOI] [PMC free article] [PubMed] [Google Scholar]
- Castranova V, Vallyathan V, Wallace WE (Eds.), 1996. Silica and Silica-Induced Lung Diseases CRC Press, Boca Raton, FL. [Google Scholar]
- Chan JYW, Tsui JCC, Law PTW, So WKW, Leung DYP, Sham MMK, Tsui SKW, Chan CWH, 2018. Regulation of TLR4 in silica-induced inflammation: an underlying mechanism of silicosis. Int. J. Med. Sci 15, 986–991. [DOI] [PMC free article] [PubMed] [Google Scholar]
- Chang JS, Chang KL, Hwang DF, Kong ZL, 2007. In vitro cytotoxicitiy of silica nanoparticles at high concentrations strongly depends on the metabolic activity type of the cell line. Environ. Sci. Technol 41, 2064–2068. [DOI] [PubMed] [Google Scholar]
- Chen F, Sun SC, Kuh DC, Gaydos LJ, Demers LM, 1995. Essential role of NF-kappa B activation in silica-induced inflammatory mediator production in macrophages. Biochem. Biophys. Res. Commun 214, 985–992. [DOI] [PubMed] [Google Scholar]
- Chester AH, Yacoub MH, 2014. The role of endothelin-1 in pulmonary arterial hypertension. Glob. Cardiol. Sci. Pract 2014, 62–78. [DOI] [PMC free article] [PubMed] [Google Scholar]
- Costantini LM, Gilberti RM, Knecht DA, 2011. The phagocytosis and toxicity of amorphous silica. PLoS One 6, e14647. [DOI] [PMC free article] [PubMed] [Google Scholar]
- Dalal NS, Shi X, Vallyathan V, 1990. Proceedings of the VIIth International Pneumoconioses Conference, August 23–26, 1988, Pittsburgh, Pennsylvania, USA. U. S. Department of Health and Human Services, Public Health Service, Centers for Disease Control, National Institute for Occupational Safety and Health, pp. 250–253. DHHS (NIOSH) Publication No. 90–108, 1990 Sep; (Part I). [Google Scholar]
- Esswein EJ, Breitenstein M, Snawder J, Kiefer M, Silber WK, 2012. Worker exposure to crystalline silica during hydraulic fracturing. J. Occup. Environ. Hyg 10, 347–356. [DOI] [PubMed] [Google Scholar]
- Fedan JS, 2020. Biological effects of inhaled hydraulic fracturing sand dust. I. Scope of the investigation. Toxicol. Appl. Pharmacol (Manuscript submitted to this journal as a tandem paper to accompany this manuscript.). [DOI] [PMC free article] [PubMed] [Google Scholar]
- Fedan JS, Hubbs AF, Barger M, Schwegler-Berry D, Friend S, Leonard SS, Thompson JA, Jackson MC, Snawder JE, C M, Dozier AK, Coyle J, Kashon ML, Park J-H, McKinney W, Roberts JR, 2020. Biological effects of inhaled hydraulic fracturing sand dust. II. Inhalation exposure system, particle characterization, and effects following intratracheal instillation. Toxicol. Appl. Pharmacol (Manuscript submitted to this journal as a tandem paper to accompany this manuscript.). [DOI] [PMC free article] [PubMed] [Google Scholar]
- Fubini B, Hubbard A, 2003. Reactive oxygen species (ROS) and reactive nitrogen species (RNS) generation by silica in inflammation and fibrosis. Free Radic. Biol. Med 34, 1507–1516. [DOI] [PubMed] [Google Scholar]
- Gilberti RM, Joshi GN, Knecht DA, 2008. The phagocytosis of crystalline silica particles by macrophages. Am. J. Respir. Cell Mol. Biol 39, 619–627. [DOI] [PMC free article] [PubMed] [Google Scholar]
- Gonzalez L, Thomassen LC, Plas G, Rabolli V, Napierska D, Decordier I, Roelants M, Hoet PH, Kirschhock CE, Martens JA, Lison D, Kirsch-Volders M, 2010. Exploring the aneugenic and clastogenic potential in the nanosize range: A549 human lung carcinoma cells and amorphous monodisperse silica nanoparticles as models. Nanotoxicology 4, 382–395. [DOI] [PubMed] [Google Scholar]
- Gwinn MR, Leonard SS, Sargent LM, Lowry DT, McKinstry K, Meighan T, Reynolds SH, Kashon M, Castranova V, Vallyathan V, 2009. The role of p53 in silica-induced cellular and molecular responses associated with carcinogenesis. J Toxicol Environ Health A 72, 1509–1519. [DOI] [PubMed] [Google Scholar]
- Hamilton RF Jr., Thakur SA, Holian A, 2008. Silica binding and toxicity in alveolar macrophages. Free Radic. Biol. Med 44, 1246–1258. [DOI] [PMC free article] [PubMed] [Google Scholar]
- Harijith A, Ebenezer DL, Natarajan V, 2014. Reactive oxygen species at the crossroads of inflammasome and inflammation. Front. Physiol 5, 352. [DOI] [PMC free article] [PubMed] [Google Scholar]
- Hornung V, Bauernfeind F, Halle A, Samstad EO, Kono H, Rock KL, Fitzgerald KA, Latz E, 2008. Silica crystals and aluminum salts activate the NALP3 inflammasome through phagosomal destabilization. Nat. Immunol 9, 847–856. [DOI] [PMC free article] [PubMed] [Google Scholar]
- Huaux F, 2007. New developments in the understanding of immunology in silicosis. Curr. Opin. Allergy Clin. Immunol 7, 168–173. [DOI] [PubMed] [Google Scholar]
- IARC, 1997. IARC Monographs on the Evaulation of Carcinogenic Risks to Humans: Silica, some Silicates, Coal Dust and Para-Aramid Fibrils, Vol. 68. Lyon, France. [PMC free article] [PubMed] [Google Scholar]
- IARC, 2012. Silica dust, crystalline, in the form of quartz or cristobalite. IARC Monogr. Eval. Carcinog. Risks Hum 100C, 355–405. [Google Scholar]
- Team Investigative, 2020. Biological effects of inhaled hydraulic fracturing sand dust. IX. Summary and significance. Toxicol. Appl. Pharmacol (Manuscript submitted to this journal as a tandem paper to accompany this manuscript.). [DOI] [PMC free article] [PubMed] [Google Scholar]
- Kawasaki H, 2015. A mechanistic review of silica-induced inhalation toxicity. Inhal. Toxicol 27, 363–377. [DOI] [PubMed] [Google Scholar]
- Kim IY, Joachim E, Choi H, Kim K, 2015. Toxicity of silica nanoparticles depends on size, dose, and cell type. Nanomedicine 11, 1407–1416. [DOI] [PubMed] [Google Scholar]
- Krajnak K, Russ KA, McKinney W, Waugh S, Zheng W, Kan H, Kashon ML, Johnson C, Cumpston J, Fedan JS, 2020. Biological effects of inhaled hydraulic fracturing sand dust. IV. Exposure to fracking sand dust results in changes in factors associated with cardiovascular dysfunction. Toxicol. Appl. Pharmacol (Manuscript submitted to this journal as a tandem paper to accompany this manuscript.). [DOI] [PMC free article] [PubMed] [Google Scholar]
- Kusaka T, Nakayama M, Nakamura K, Ishimiya M, Furusawa E, Ogasawara K, 2014. Effect of silica particle size on macrophage inflammatory responses. PLoS One 9, e92634. [DOI] [PMC free article] [PubMed] [Google Scholar]
- Lemons AR, Hogan MB, Gault RA, Holland K, Sobek E, Olsen-Wilson KA, Park Y, Park JH, Gu JK, Kashon ML, Green BJ, 2017. Microbial rRNA sequencing analysis of evaporative cooler indoor environments located in the Great Basin Desert region of the United States. Environ. Sci. Process. Impacts 19, 101–110. [DOI] [PMC free article] [PubMed] [Google Scholar]
- Leonard SS, Harris GK, Shi X, 2004. Metal-induced oxidative stress and signal transduction. Free Radic. Biol. Med 37, 1921–1942. [DOI] [PubMed] [Google Scholar]
- Liang F, Sayed M, Al-Muntasheri GA, Chang FF, Leiming L, 2016. A comprehensive review on proppant technologies. Petroleum 2, 26–39. [Google Scholar]
- Lopes-Pacheco M, Bandeira E, Morales MM, 2016. Cell-based therapy for silicosis. Stem Cells Int 2016, 5091838. [DOI] [PMC free article] [PubMed] [Google Scholar]
- Lu X, Qian J, Zhou H, Gan Q, Tang W, Lu J, Yuan Y, Liu C, 2011. In vitro cytotoxicity and induction of apoptosis by silica nanoparticles in human HepG2 hepatoma cells. Int. J. Nanomedicine 6, 1889–1901. [DOI] [PMC free article] [PubMed] [Google Scholar]
- McCabe KM, Khan G, Zhang YH, Mason EO, McCabe ER, 1995. Amplification of bacterial DNA using highly conserved sequences: automated analysis and potential for molecular triage of sepsis. Pediatrics 95, 165–169. [PubMed] [Google Scholar]
- Nemmar A, Vanbilloen H, Hoylaerts MF, Hoet PH, Verbruggen A, Nemery B, 2001. Passage of intratracheally instilled ultrafine particles from the lung into the systemic circulation in hamster. Am. J. Respir. Crit. Care Med 164, 1665–1668. [DOI] [PubMed] [Google Scholar]
- Niechi I, Silva E, Cabello P, Huerta H, Carrasco V, Villar P, Cataldo LR, Marcelain K, Armisen R, Varas-Godoy M, Fernandez C, Tapia JC, 2015. Colon cancer cell invasion is promoted by protein kinase CK2 through increase of endothelin-converting enzyme-1c protein stability. Oncotarget 6, 42749–42760. [DOI] [PMC free article] [PubMed] [Google Scholar]
- Olgun NS, Patel HJ, Stephani R, Lengyel I, Reznik SE, 2010. Blockade of endothelin-1 with a novel series of 1,3,6-trisubstituted-2-carboxy-quinol-4-ones controls infection-associated preterm birth. Am. J. Pathol 177, 1929–1935. [DOI] [PMC free article] [PubMed] [Google Scholar]
- Olgun NS, Hanna N, Reznik SE, 2015. BQ-123 prevents LPS-induced preterm birth in mice via the induction of uterine and placental IL-10. Toxicol. Appl. Pharmacol 282, 275–284. [DOI] [PubMed] [Google Scholar]
- Pitkaranta M, Meklin T, Hyvarinen A, Paulin L, Auvinen P, Nevalainen A, Rintala H, 2008. Analysis of fungal flora in indoor dust by ribosomal DNA sequence analysis, quantitative PCR, and culture. Appl. Environ. Microbiol 74, 233–244. [DOI] [PMC free article] [PubMed] [Google Scholar]
- Rittenour WR, Ciaccio CE, Barnes CS, Kashon ML, Lemons AR, Beezhold DH, Green BJ, 2014. Internal transcribed spacer rRNA gene sequencing analysis of fungal diversity in Kansas City indoor environments. Environ. Sci. Process. Impacts 16, 33–43. [DOI] [PMC free article] [PubMed] [Google Scholar]
- Russ KA, Thompson JA, Reynolds JS, Roberts JR, Mercer RR, Porter DW, McKinney W, Dey RD, Barger M, Cumpston J, Batchelor TP, Kashon ML, Kodali V, Sriram K, Fedan JS, 2020. Biological effects of inhaled hydraulic fracturing sand dust. IV. Pulmonary effects. Toxicol. Appl. Pharmacol (Manuscript submitted to this journal as a tandem paper to accompany this manuscript.). [DOI] [PMC free article] [PubMed] [Google Scholar]
- Sager TM, Roberts JR, Umbright CM, Barger M, Kashon ML, Fedan JS, Joseph P, 2020. Biological effects of inhaled hydraulic fracturing sand dust. V. Pulmonary inflammatory, cytotoxic and oxidant effects. Toxicol. Appl. Pharmacol (Manuscript submitted to this journal as a tandem paper to accompany this manuscript.). [DOI] [PMC free article] [PubMed] [Google Scholar]
- Sandberg WJ, Lag M, Holme JA, Friede B, Gualtieri M, Kruszewski M, Schwarze PE, Skuland T, Refsnes M, 2012. Comparison of non-crystalline silica nanoparticles in IL-1β release from macrophages. Part. Fibre Toxicol 9, 32. [DOI] [PMC free article] [PubMed] [Google Scholar]
- Schins RP, Knaapen AM, 2007. Genotoxicity of poorly soluble particles. Inhal. Toxicol 19 (Suppl. 1), 189–198. [DOI] [PubMed] [Google Scholar]
- Shi X, Castranova V, Halliwell B, Vallyathan V, 1998. Reactive oxygen species and silica-induced carcinogenesis. J. Toxicol. Environ. Health B Crit. Rev 1, 181–197. [DOI] [PubMed] [Google Scholar]
- Smollich M, Wulfing P, 2007. The endothelin axis: a novel target for pharmacotherapy of female malignancies. Curr. Vasc. Pharmacol 5, 239–248. [DOI] [PubMed] [Google Scholar]
- Sriram K, Lin GX, Jefferson AM, McKinney W, Jackson MC, Cumpston A, Cumpston JL, Cumpston JB, Leonard HD, Kashon ML, Fedan JS, 2020. Biological effects of inhaled hydraulic fracturing sand dust. VII. Neuroinflammation and altered synaptic protein expression. Toxicol. Appl. Pharmacol (Manuscript submitted to this journal as a tandem paper to accompany this manuscript.). [DOI] [PMC free article] [PubMed] [Google Scholar]
- Vallyathan V, Shi X, Castranova V, 1998. Reactive oxygen species: their relation to pneumoconiosis and carcinogenesis. Environ. Health Perspect 106 (Suppl. 5), 1151–1155. [DOI] [PMC free article] [PubMed] [Google Scholar]
- Zelko IN, Zhu J, Ritzenthaler JD, Roman J, 2016. Pulmonary hypertension and vascular remodeling in mice exposed to crystalline silica. Respir. Res 17, 160. [DOI] [PMC free article] [PubMed] [Google Scholar]
Associated Data
This section collects any data citations, data availability statements, or supplementary materials included in this article.


