

Abstract
Background
The HEART Pathway is an accelerated diagnostic protocol for Emergency Department patients with possible acute coronary syndrome. The objective was to compare the safety and effectiveness of the HEART Pathway among women vs men and whites vs non-whites.
Methods
A subgroup analysis of the HEART Pathway Implementation Study was conducted. Adults with chest pain were accrued from November 2013 to January 2016 from 3 Emergency Departments in North Carolina. The primary outcomes were death and myocardial infarction (MI) and hospitalization rates at 30 days. Logistic regression evaluated for interactions of accelerated diagnostic protocol implementation with sex or race and changes in outcomes within subgroups.
Results
A total of 8,474 patients were accrued, of which 53.6% were female and 34.0% were non-white. The HEART Pathway identified 32.6% of females as low-risk vs 28.5% of males (P = 002) and 35.6% of non-whites as low-risk vs 28.0% of whites (P < .0001). Among low-risk patients, death or MI at 30 days occurred in 0.4% of females vs 0.5% of males (P = .70) and 0.5% of non-whites vs 0.3% of whites (P = .69). Hospitalization at 30 days was reduced by 6.6% in females (aOR: 0.74, 95% CI: 0.64–0.85), 5.1% in males (aOR: 0.87, 95% CI: 0.75–1.02), 8.6% in non-whites (aOR: 0.72, 95% CI: 0.60–0.86), and 4.5% in whites (aOR: 0.83, 95% CI: 0.73–0.94). Interactions were not significant.
Conclusion
Women and non-whites are more likely to be classified as low-risk by the HEART Pathway. HEART Pathway implementation is associated with decreased hospitalizations and a very low death and MI rate among low-risk patients regardless of sex or race.
Emergency Departments (ED) in the US care for 6–9 million patients with acute chest pain annually.1,2 To avoid missing acute coronary syndrome (ACS), providers liberally hospitalize patients with chest pain for comprehensive evaluations (serial cardiac biomarkers and stress testing or angiography), which costs $10–13 billion annually.3,4 However, < 10% of ED patients with chest pain are ultimately diagnosed with an ACS.3,5–11
There are known differences in acute cardiovascular care in the ED by sex and race. For example, women and non-white patients are more likely to present to the ED with atypical symptoms (eg, nausea).12–14 In addition, women and racial minorities are less likely to have cardiac testing, or there may be a delay if testing is completed.14–17
The HEART Pathway is a validated and widely used accelerated diagnostic protocol (ADP), used for ED chest pain risk stratification. It provides test ordering and disposition decision support to practitioners and risk-based care planning for patients with acute chest pain.18 In prior studies, the HEART Pathway safely increased early discharges from the ED and decreased objective cardiac testing (OCT; stress testing and angiography), hospital length of stay, and cost.18–22 However, there is a lack of data evaluating whether the performance of the HEART Pathway differs by sex and race. Given the known differences in the care of chest pain patients by sex and race, understanding any differences in the performance of the HEART Pathway within these subgroups is critical. Therefore, our objective was to compare the safety and effectiveness of the HEART Pathway among women versus men and white versus non-white patients presenting to the ED with acute chest pain.
Methods
Study design and oversight
A pre-planned subgroup analysis of the HEART Pathway Implementation Study was conducted. Participants were prospectively accrued under a waiver of informed consent from November 2013 to January 2016. This study was Institutional Review Board approved and registered with clinicaltrials.gov (NCT02056964). Methods of the HEART Pathway Implementation Study, a prospective pre-post interrupted time series, have been previously published.19,23
Study setting and population
The study was conducted at 3 hospitals in North Carolina: Wake Forest Baptist Medical Center (WFBMC), a large urban academic medical center with approximately 114,000 ED visits annually; Davie Medical Center, a freestanding ED in a rural county with approximately 12,000 annual ED visits; and Lexington Medical Center, a small community hospital with approximately 37,000 annual ED visits. The target population was adult ED patients (≥21 years old) investigated for possible ACS, but without evidence of ST-segment elevation myocardial infarction (STEMI) on electrocardiography (ECG). During both the pre- and postimplementation periods, patients with a chief complaint of chest pain and at least one troponin ordered were accrued as long as there was no evidence of a STEMI on ECG as determined by the treating ED physician. Patients with other complaints that were concerning for ACS were also included during both the pre- and post-implementation periods if the provider used a study specific EHR flowsheet for possible ACS.
At Wake Forest Baptist Medical Center and Davie Medical Center, participants were accrued into the pre-implementation (November 2013 to October 2014) or the postimplementation (February 2015 to January 2016) cohorts. Lexington Medical Center accrued patients into the pre-implementation and postimplementation cohorts from January 2015 to July 2015 and August 2015 to January 2016, respectively. Patients entered into each cohort based on the date of their initial ED visit; any subsequent visits for chest pain were considered recurrent care. To prevent accruing more ED repeat users/high utilizers (who often have more comorbid conditions) into the pre-implementation cohort, patients with an ED visit for possible ACS at each site in the year before the study began (N = 523) were excluded. Patients transferred within network or visiting multiple sites were classified based on their original ED visit. For transfers, care at the receiving hospital was considered part of their index encounter.
Data collection
Index encounter data were extracted from the electronic health record (EHR; Clarity-Epic Systems Corporation, Verona, WI). Prevalidated structured EHR variables or diagnoses and procedure codes (CPT, ICD9, and ICD10) were used to obtain patient demographics, comorbidities, troponin results, HEART Pathway assessments, dispositions, diagnoses, and vital status.24–28 To determine 30-day outcomes, we used the EHR for within-network return visits, insurers’ claims data, and state death index data. Claims data were available on patients insured by Blue Cross Blue Shield of North Carolina (the dominant insurer in NC), MedCost, and North Carolina Medicaid. We also used North Carolina State Center for Health Statistics death index data. No independent adjudication was utilized in outcome determination.
HEART pathway implementation
After the pre-implementation period concluded, the HEART Pathway ADP was fully integrated into EPIC as an interactive clinical decision support (CDS) tool. Thus, for all adult patients with chest pain and at least 1 troponin ordered in the postimplementation period, ED providers saw an interruptive pop-up alert for the HEART Pathway tool in the EHR. In addition, the HEART Pathway tool was integrated into the study specific EHR flowsheet, which allowed providers to manually access the HEART Pathway in patients presenting with other symptoms concerning for ACS (ie, dyspnea, left arm pain, etc.).
The HEART Pathway CDS tool prompted providers to answer a series of questions to prospectively risk-stratify patients in real-time. Patients with known coronary artery disease (prior MI, prior coronary revascularization, or known coronary stenosis ≥70%), or acute ischemic ECG changes (eg, new T-wave inversions or ST-segment depression in contiguous leads) were immediately classified as non-low-risk. Among patients without STEMI, known coronary disease (CAD), or acute ischemic ECG changes, providers answered additional flow sheet questions to determine a History, ECG, Age, and Risk factor score (HEAR score); calculated based on the HEART Pathway trial algorithm (Impathiq Inc., Raleigh, NC).22,23 Troponin measurements were incorporated through a direct link to laboratory results. The HEART Pathway risk assessment was automatically calculated based on the HEAR score and 0- and 3-hour troponin measures.21,29 Patients with HEAR scores ≤3 and without elevated troponin measures were classified as low-risk and recommended for discharge without OCT. Patients with a HEAR score ≥ 4, an elevated troponin, known CAD, or ischemic ECG changes were classified as non-low-risk and designated for further testing (Figure 1). During the pre-implementation period, The HEART Pathway CDS tool was not available to providers and HEAR scores were not recorded. Serum troponin was measured throughout the study period using the ADVIA Centaur platform TnI-Ultra assay (Siemens, Munich, Germany) or the Access AccuTnI+3 assay (Beckman Coulter, Brea, CA). The published 99th percentile upper reference limit for each assay was used to determine a positive result at 0- and 3-hour.
Figure 1.
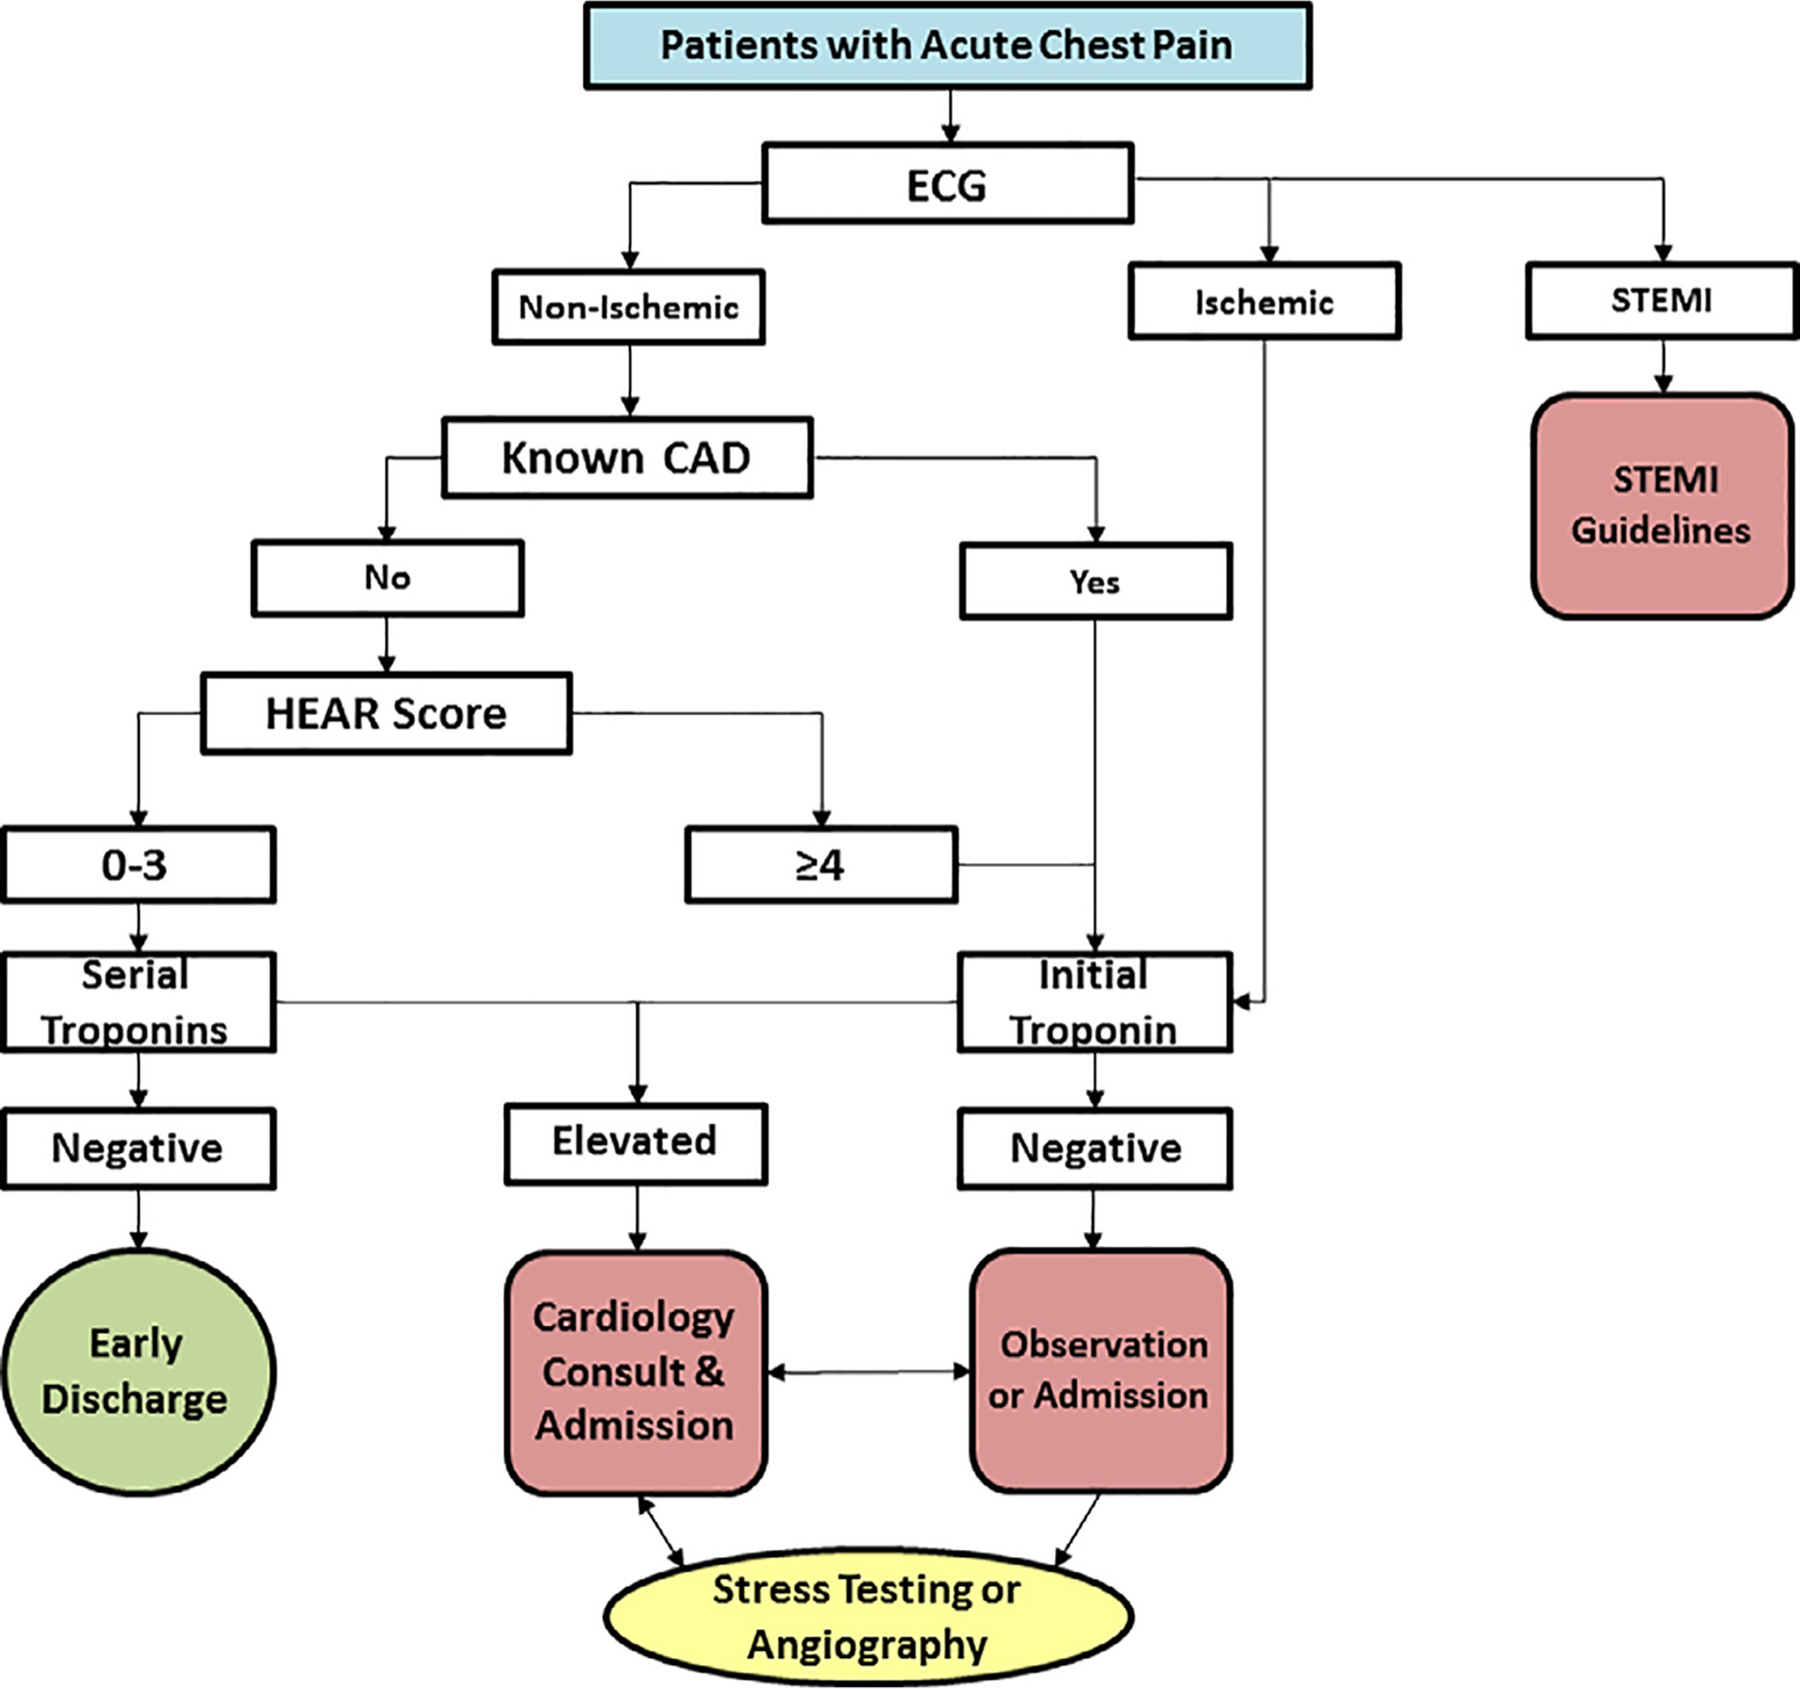
The HEART Pathway algorithm.
Outcomes
The primary effectiveness outcome was hospitalization at 30 days (from index visit through 30 days follow-up). Hospitalization was defined as an inpatient admission, transfer, or observation stay (including index observation unit care). Secondary outcomes included: (1) OCT rates, defined as proportion of patients receiving stress testing, coronary CT angiography, or invasive coronary angiography; and (2) early discharge rate, defined as proportion of patients discharged from the ED without OCT. In the post-implementation period, nonadherence to the HEART Pathway was also determined, where nonadherence was defined as low-risk patients receiving stress testing or hospitalization or non-low-risk patients receiving early discharge from the ED.
The primary safety outcome was the composite of death or MI at 30-days (inclusive of index visit). Coronary revascularization, a secondary endpoint, was defined as coronary artery bypass grafting or percutaneous coronary intervention. MI and coronary revascularization were determined using diagnosis and procedure codes validated by prior cardiovascular trials.24–28 Major adverse cardiac events, a composite of death, MI, and revascularization, were also evaluated.
Statistical analysis
Statistical design for the overall study was described previously.22,23 For these preplanned subgroup analyses, sex (male and female) and race (white and non-white) were determined based on patient self-identification recorded in the EHR. The 6 patients with unknown race information were included in the non-white group. Patient characteristics were described by pre- and postimplementation cohorts within each subgroup.
Unadjusted logistic regression was used to model the relationship between pre- and post-implementation periods and study outcomes within each subgroup separately. These models were then adjusted for potential confounders, which were selected a priori : age, sex (race subgroups only), race (sex subgroups only), ethnicity, insurance status, enrollment site, prior known coronary artery disease, diabetes, hypertension, hyperlipidemia, smoking, body mass index, and presence of chest pain vs other symptoms concerning for ACS (EHR flowsheet use). To test for significant differences in implementation between sex and race, logistic regression models were fit using the overall population including sex by implementation cohort (pre vs post) or race by implementation cohort interaction terms. The same potential confounders were included in these models.
Post-implementation, the percentage of patients identified as low-risk and nonlow risk were calculated to determine the sensitivity, specificity, and positive and negative predictive values of the HEART Pathway for death and MI. Corresponding 95% exact binomial confidence intervals (CI) were computed. For positive and negative likelihood ratios, 95% CIs were calculated using the method of Simel et al.30 Patients were grouped as white males, white females, non-white males and non-white females to further explore the relationship between sex and race and being identified as low-risk by the HEART Pathway. Logistic regression was used for this analysis, adjusted for age. The proportion of safety events and effectiveness outcomes in the low-risk post-implementation cohort were compared between sexes and races using Fisher’s exact and Chi-square tests.
Consistent with prior studies, patients without 30-day data from the EHR, insurers, or death index were considered free of 30-day safety events.20–22, 29 Sensitivity analyses assessed the impact of missing follow-up data on safety events using multiple imputation based on several assumptions such as: excluding patients lost to follow-up, assuming patients with incomplete follow-up had the same event rate as patients with complete follow-up from the pre- and post-cohorts, or the same event rate as the pre-implementation cohort (Supplemental Tables 1 and 2). In addition, individual components of the HEART Pathway were compared between subgroups using Chi-square tests for those patients with a complete HEART Pathway assessment (Supplemental Tables 3 and 4). Patients were considered to have a complete HEART Pathway assessment as long as there was sufficient data available to make a risk determination based on the HEART Pathway. Therefore, a complete HEART Pathway assessment does not require having data on each component. All component data available for those patients with a complete HEART Pathway assessment were included in the analyses in Supplemental Tables 3 and 4. All analyses were performed using R (www.R-project.org) or SAS 9.4 (Cary, NC).
Funding
This project was funded by the Donaghue Foundation and the Association of American Medical Colleges (AAMC). The algorithm used for the HEART Pathway was developed by Dr. Mahler at Wake Forest and was licensed to Impathiq Inc. Impathiq did not provide financial support for this study or have any role in the development of this manuscript. The authors are solely responsible for the design and conduct of this study, all study analyses, the drafting and editing of the paper,=- and its final contents.
Results
Patients
Over 24 months, 8,474 patients were accrued (Supplemental Figure 1). The cohort was 53.6% (4,541/8,474) female and 34.0% (2,884/8,474) non-white with a median age of 54. The pre-implementation cohort was 52.9% female (1,965/3,713) and 33.1% (1,229/3,713) non-white, while the postimplementation cohort included 54.1% (2,576/4,761) women and 34.8% (1,655/4,761) non-white patients. Cohort characteristics by sex and race are summarized in Table 1 and race is further described in Supplemental Table 5. There was no statistical difference in pre- and post-implementation proportions of female (P = .28) or non-white (P = .11) patients. The 30-day death and MI rate of the cohort was 7.2% and revascularization occurred in 39% of patients.
Table 1.
Characteristics of patients in the pre- and post-implementation cohorts by sex and race
| Pre-Implementation (N = 3,713) | Post-Implementation (N = 4,761) | Total (N = 8,474) | ||||
|---|---|---|---|---|---|---|
| Female | Male | Female | Male | Female | Male | |
| Patient Characteristics | N = 1,965 (%) | N = 1,748 (%) | N = 2,576 (%) | N = 2,185 (%) | N = 4,541 (%) | N = 3,933 (%) |
| Age -median (IQR) | 54 (44,66) | 55 (45,64) | 54 (44,67) | 54 (44,65) | 54 (44,66) | 54 (45,65) |
| Race | ||||||
| White | 1,252 (63.7) | 1,232 (70.5) | 1,633 (63.4) | 1,473 67.4) | 2,885 (63.5) | 2,705 (68.8) |
| Non-White | 713 (36.3) | 516 (29.5) | 943 (36.6) | 712 (32.6) | 1,656 (36.5) | 1,228 (31.2) |
| Ethnicity | ||||||
| Hispanic or Latino | 78 (4.0) | 56 (3.2) | 117 (4.5) | 113 (5.2) | 195 (4.3) | 169 (4.3) |
| Site | ||||||
| WFBMC | 1,386 (70.5) | 1,334 (76.3) | 1,993 (77.4) | 1,692 (77.4) | 3,379 (74.4) | 3,026 (76.9) |
| DMC | 241 (12.3) | 155 (8.9) | 282 (10.9) | 230 (10.5) | 523 (11.5) | 385 (9.8) |
| LMC | 338 (17.2) | 259 (14.8) | 301 (11.7) | 263 (12.0) | 639 (14.1) | 522 (13.3) |
| Insurance Status | ||||||
| Blue Cross | 416 (21.2) | 374 (21.4) | 519 (20.1) | 451 (20.6) | 935 (20.6) | 825 (21.0) |
| MedCost | 126 (6.4) | 83 (4.7) | 184 (7.1) | 102 (4.7) | 310 (6.8) | 185 (4.7) |
| Medicaid | 295 (15.0) | 210 (12.0) | 418 (16.2) | 269 (12.3) | 713 (15.7) | 479 (12.2) |
| Medicare | 649 (33.0) | 540 (30.9) | 926 (35.9) | 691 (31.6) | 1575 (34.7) | 1,231 (31.3) |
| Other insurance | 161 (8.2) | 160 (9.2) | 180 (7.0) | 233 (10.7) | 341 (7.5) | 393 (10.0) |
| Self-pay | 318 (16.2) | 381 (21.8) | 349 (13.5) | 439 (20.1) | 667 (14.7) | 820 (20.8) |
| Risk Factors | ||||||
| Prior CAD | 434 (22.1) | 602 (34.4) | 567 (22.0) | 713 (32.6) | 1,001 (22.0) | 1,315 (33.4) |
| Diabetes | 545 (27.7) | 486 (27.8) | 695 (27.0) | 595 (27.2) | 1,240 (27.3) | 1,081 (27.5) |
| Hyperlipidemia | 779 (39.6) | 749 (42.8) | 1,038 (40.3) | 955 (43.7) | 1,817 (40.0) | 1,704 (43.3) |
| Hypertension | 1,265 (64.4) | 1,141 (65.3) | 1,610 (62.5) | 1,376 (63.0) | 2,875 (63.3) | 2,517 (64.0) |
| Smoking | 1,103 (56.1) | 1,253 (71.7) | 1,366 (53.0) | 1,512 (69.2) | 2,469 (54.4) | 2,765 (70.3) |
| BMI ≥30 | 992 (50.5) | 702 (40.2) | 1,291 (50.1) | 904 (41.4) | 2,283 (50.3) | 1,606 (40.8) |
| Peripheral Vascular Disease | 201 (10.2) | 249 (14.2) | 314 (12.2) | 321 (14.7) | 515 (11.3) | 570 (14.5) |
| Cerebrovascular Disease | 250 (12.7) | 206 (11.8) | 327 (12.7) | 267 (12.2) | 577 (12.7) | 473 (12.0) |
| Comorbidities | ||||||
| COPD | 693 (35.3) | 480 (27.5) | 940 (36.5) | 603 (27.6) | 1,633 (36.0) | 1,083 (27.5) |
| Cancer | 303 (15.4) | 267 (15.3) | 406 (15.8) | 340 (15.6) | 709 (15.6) | 607 (15.4) |
| Chronic Kidney Disease | 196 (10.0) | 220 (12.6) | 285 (11.1) | 291 (13.3) | 481 (10.6) | 511 (13.0) |
| Pre-Implementation (N = 3,713) | Post-Implementation (N = 4,761) | Total (N = 8,474) | ||||
| Patient Characteristics | Non-White | White | Non-White | White | Non-White | White |
| N = 1,229 (%) | N = 2,484 (%) | N = 1,655 (%) | N = 3,106 (%) | N = 2,884 (%) | N = 5,590 (%) | |
| Age -median (IQR) | 52 (43,60) | 56 (46,68) | 51 (42,61) | 56 (46,68) | 51 (42,60) | 56 (46,68) |
| Female | 713 (58.0) | 1,252 (50.4) | 943 (57.0) | 1,633 (52.6) | 1,656 (57.4) | 2,885 (51.6) |
| Ethnicity | ||||||
| Hispanic or Latino | 128 (10.4) | 6 (0.2) | 215 (13) | 15 (0.5) | 343 (11.9) | 21 (0.4) |
| Site | ||||||
| WFBMC | 1,073 (87.3) | 1,647 (66.3) | 1,473 (89.0) | 2,212 (71.2) | 2,546 (88.3) | 3,859 (69.0) |
| DMC | 51 (4.1) | 345 (13.9) | 61 (3.7) | 451 (14.5) | 112 (3.9) | 796 (14.2) |
| LMC | 105 (8.5) | 492 (19.8) | 121 (7.3) | 443 (14.3) | 226 (7.8) | 935 (16.7) |
| Insurance Status | ||||||
| Blue Cross | 175 (14.2) | 615 (24.8) | 238 (14.4) | 732 (23.6) | 413 (14.3) | 1,347 (24.1) |
| MedCost | 64 (5.2) | 145 (5.8) | 77 (4.7) | 209 (6.7) | 141 (4.9) | 354 (6.3) |
| Medicaid | 229 (18.6) | 276 (11.1) | 329 (19.9) | 358 (11.5) | 558 (19.3) | 634 (11.3) |
| Medicare | 325 (26.4) | 864 (34.8) | 468 (28.3) | 1,149 (37.0) | 793 (27.5) | 2,013 (36.0) |
| Other insurance | 116 (9.4) | 205 (8.3) | 148 (8.9) | 265 (8.5) | 264 (9.2) | 470 (8.4) |
| Self-pay | 320 (26.0) | 379 (15.3) | 395 (23.9) | 393 (12.7) | 715 (24.8) | 772 (13.8) |
| Risk Factors | ||||||
| Prior CAD | 249 (20.3) | 787 (31.7) | 311 (18.8) | 969 (31.2) | 560 (19.4) | 1,756 (31.4) |
| Diabetes | 367 (29.9) | 664 (26.7) | 516 (31.2) | 774 (24.9) | 883 (30.6) | 1,438 (25.7) |
| Hyperlipidemia | 448 (36.5) | 1,080 (43.5) | 598 (36.1) | 1,395 (44.9) | 1,046 (36.3) | 2,475 (44.3) |
| Hypertension | 845 (68.8) | 1,561 (62.8) | 1,073 (64.8) | 1,913 (61.6) | 1,918 (66.5) | 3,474 (62.1) |
| Smoking | 753 (61.3) | 1,603 (64.5) | 970 (58.6) | 1,908 (61.4) | 1,723 (59.7) | 3,511 (62.8) |
| BMI ≥30 | 614 (50.0) | 1,080 (43.5) | 827 (50.0) | 1,368 (44.0) | 1,441 (50.0) | 2,448 (43.8) |
| Peripheral Vascular Disease | 122 (9.9) | 328 (13.2) | 182 (11.0) | 453 (14.6) | 304 (10.5) | 781 (14.0) |
| Cerebrovascular Disease | 145 (11.8) | 311 (12.5) | 184 (11.1) | 410 (13.2) | 329 (11.4) | 721 (12.9) |
| Comorbidities | ||||||
| COPD | 354 (28.8) | 819 (33) | 510 (30.8) | 1,033 (33.3) | 864 (30.0) | 1,852 (33.1) |
| Cancer | 133 (10.8) | 437 (17.6) | 160 (9.7) | 586 (18.9) | 293 (10.2) | 1,023 (18.3) |
| Chronic Kidney Disease | 166 (13.5) | 250 (10.1) | 225 (13.6) | 351 (11.3) | 391 (13.6) | 601 (10.8) |
BMI = Body Mass I ndex, CAD = Coronary Artery Disease, COPD = Chronic Obstructive Pulmonary Disease, DMC = Davie Medical Center, I QR = I nterquartile range, LMC = Lexington Medical Center, WFBMC = Wake Forest Baptist Medical
Risk assessments and safety
In the post-implementation period, use of the HEART Pathway identified 32.6% (839/2,576) of women as low-risk and 51.4% (1,324/2,576) as nonlow-risk. Another 6.9% (177/2,576) had low-risk HEAR scores but lacked serial troponin measurements, and 9.2% (236/2,576) had an incomplete HEAR score. Among men, 28.5% (622/2,185) were low-risk, 55.2% (1,207/2,185) non-low-risk, 7.1% (156/2,185) had low-risk HEAR scores without serial troponin measurements, and 9.2% (200/2,185) had an incomplete HEAR score. The proportion of women classified as low-risk was 4.1% (95% CI: 1.4–6.8%) greater than men (P = .002). Among low-risk patients, 30-day death or MI occurred in 0.4% (95% CI:0.1–1.0%) of females vs 0.5% (95% CI:0.1–1.4%) of males (P = .70). The interaction between the HEART Pathway implementation and sex was not significant for 30-day death and MI (P = .07).
Among non-white patients, the HEART Pathway identified 35.6% (590/1,655) as low-risk, 46.7% (773/1,655) as non-low-risk, 8.2% (135/1,655) had low-risk HEAR scores without serial troponin measurements, and 95% (157/1,655) had an incomplete HEAR score. In white patients, 28.0% (871/3,106) were low-risk, 56.6% (1,758/3,106) were non-low-risk, 6.4% (198/3,106) had low-risk HEAR scores but no serial troponin measurements, and 9.0% (279/3,106) had an incomplete HEAR score. The proportion of non-white patients classified as low-risk was 7.6% (95% CI: 4.8–10.5%) greater than whites (P < .0001). Death or MI at 30 days occurred in 0.5% of low risk non-white patients compared to 0.3% (95%CI:0.1–1.0%) of whites (P = .69). The interaction between the HEART Pathway implementation and race was not significant for 30-day death and MI (P = .59). After adjusting for age, white females (aOR: 1.50; 95% CI: 1.24–1.80), non-white females (Odds Ratio: 1.48; 95% CI: 1.20–1.82), and non-white males (Odds Ratio: 1.34; 95% CI: 1.06–1.68) all are significantly more likely to be classified as low-risk by the HEART Pathway as compared to white males.
Test characteristics of the HEART Pathway by sex and race for patients with a complete HEART Pathway assessment are summarized in Table 2. Individual components of the HEART Pathway are compared in Supplemental Tables 3 and 4.
Table 2.
Test characteristics of the HEART Pathway for detection of death and MI from at 30 days based on sex and race
| HEART Pathway | Sensitivity | Specificity | PPV | NPV | +LR | −LR |
|---|---|---|---|---|---|---|
| (95% CI) | (95% CI) | (95% CI) | (95% CI) | (95% CI) | (95% CI) | |
| Male | 98.6% | 38.4% | 17.7% | 99.5% | 1.60 | 0.04 |
| (96.0–99.7%) | (36.0–40.8%) | (15.5–19.9%) | (98.6–99.9%) | (1.53–1.67) | (0.01–0.11) | |
| Female | 97.7% | 41.1% | 9.7% | 99.6% | 1.66 | 0.06 |
| (93.5–99.5%) | (39.0–43.3%) | (8.1–11.4%) | (99.0–99.9%) | (1.59–1.74) | (0.02–0.17) | |
| Whites | 98.9% | 36.8% | 15.1% | 99.7% | 1.56 | 0.03 |
| (96.8–99.8%) | (34.8–38.8%) | (13.4–16.8%) | (99.0–99.9%) | (1.51–1.62) | (0.01–0.09) | |
| Non-Whites | 96.2% | 45.7% | 9.8% | 99.5% | 1.77 | 0.08 |
| (89.3–99.2%) | (43.0–48.5%) | (7.8–12.2%) | (98.5–99.9%) | (1.66–1.89) | (0.03–0.25) |
At 30-days, death and MI occurred in 5.2% (134/2,576) of women in the postimplementation cohort compared to 39% (77/1,965) in the pre-implementation cohort; aOR: 1.65 (95% CI: 1.21–2.24). However, this difference is accounted for by increased detection of index-encounter MI among women (4.7%, 120/2,576) following HEART Pathway implementation vs pre-implementation (33%, 65/1,965); aOR: 1.71 (95% CI 1.24–2.38). In men, death and MI occurred in 10.0% (219/2,185) postimplementation vs 10.4% (181/1,748) pre-implementation; aOR: 1.07 (95% CI: 0.86–1.34). Among non-white patients, 30-day death and MI occurred in 4.8% (80/1,655) postimplementation vs 5.0% (61/1229) pre-implementation; aOR: 1.19 (95%CI: 0.82–1.72). In white patients, 30-day death and MI occurred in 8.8% (273/3,106) vs 7.9% (197/2,484) in post- and pre-implementation cohorts respectively; aOR: 1.28 (95% CI: 1.04–1.57). Again, this difference is accounted for by increased detection of index encounter MI in the post- (7.8%, 243/3,106) vs pre-implementation (6.3%, 156/2,484) among whites; aOR: 1.46 (95% CI 1.17–1.82). Sensitivity analyses for patients with incomplete follow-up data did not substantively change aORs for safety outcomes (Supplemental Tables 1 and 2). A comparison of proportions of study outcomes by sex and race are summarized in Table 3.
Table 3.
Proportion of female vs male and non-white vs white patients with events in the Pre- and Post-implementation cohorts
| Outcomes | Female | Male | Interaction | ||||
|---|---|---|---|---|---|---|---|
| Pre | Post | Adjusted* | Pre | Post | Adjusted* | Sex × Implementation Cohort | |
| N = 1,965 | N = 2,576 | Odds Ratio | N = 1,748 | N = 2,185 | Odds Ratio | P value | |
| (%) | (%) | (95% CI) | (%) | (%) | (95% CI) | ||
| Safety | |||||||
| Index | |||||||
| Death† | 1 (0.1) | 7 (0.3) | 5.35 (0.66–43.53) | 6 (0.3) | 8 (0.4) | 1.07 (0.37–3.08) | NA |
| MI | 65 (3.3) | 120 (4.7) | 1.71 (1.24–2.38) | 146 (8.4) | 194 (8.9) | 1.20 (0.95–1.53) | 0.15 |
| Revascularization | 39 (2.0) | 47 (1.8) | 1.04 (0.65–1.64) | 80 (4.6) | 107 (4.9) | 1.25 (0.91–1.72) | 0.46 |
| Death + MI | 66 (3.4) | 125 (4.9) | 1.77 (1.29–2.45) | 151 (8.6) | 200 (9.2) | 1.20 (0.94–1.52) | 0.11 |
| Death + MI + Revasc | 66 (3.4) | 125 (4.9) | 1.43 (1.06–1.93) | 174 (10.0) | 222 (10.2) | 1.16 (0.92–1.46) | 0.35 |
| 30 day (Index ± follow up) | |||||||
| Death† | 13 (0.7) | 16 (0.6) | 0.94 (0.45–2.02) | 31 (1.8) | 23 (1.1) | 0.61 (0.35–1.05) | 0.36 |
| MI | 66 (3.4) | 123 (4.8) | 1.75 (1.26–2.41) | 157 (9.0) | 201 (9.2) | 1.17 (0.92–1.48) | 0.08 |
| Revascularization | 44 (2.2) | 54 (2.1) | 1.07 (0.69–1.64) | 99 (5.7) | 136 (6.2) | 1.31 (0.98–1.75) | 0.41 |
| Death + MI | 77 (3.9) | 134 (5.2) | 1.65 (1.21–2.24) | 181 (10.4) | 219 (10.0) | 1.07 (0.86–1.34) | 0.07 |
| Death + MI + Revasc | 95 (4.8) | 143 (5.6) | 1.36 (1.02–1.81) | 208 (11.9) | 252 (11.5) | 1.09 (0.88–1.35) | 0.30 |
| Effectiveness | |||||||
| Index | |||||||
| Hospitalization | 1125 (57.3) | 1309 (50.8) | 0.75 (0.65–0.86) | 1106 (63.3) | 1273 (58.3) | 0.88 (0.75–1.02) | 0.27 |
| Objective Cardiac Testing | 570 (29.0) | 652 (25.3) | 0.84 (0.73–0.97) | 575 (32.9) | 655 (30.0) | 0.96 (0.82–1.11) | 0.54 |
| Early discharge | 806 (41.0) | 1206 (46.8) | 1.28 (1.12–1.48) | 584 (33.4) | 840 (38.4) | 1.16 (0.99–1.35) | 0.50 |
| 30 day (Index ± follow up) | |||||||
| Hospitalization | 1153 (58.7) | 1342 (52.1) | 0.74 (0.64–0.85) | 1135 (64.9) | 1307 (59.8) | 0.87 (0.75–1.02) | 0.24 |
| Objective Cardiac Testing | 643 (32.7) | 735 (28.5) | 0.84 (0.73–0.97) | 638 (36.5) | 727 (33.3) | 0.94 (0.82–1.09) | 0.53 |
| Outcomes | Non-White | White | Interaction | ||||
| Pre | Post | Adjusted* | Pre | Post | Adjusted* | Race × Implementation Cohort | |
| N = 1,229 | N = 1,655 | Odds Ratio | N = 2,484 | N = 3,106 | Odds Ratio | P value | |
| (%) | (%) | (95% CI) | (%) | (%) | (95% CI) | ||
| Safety | |||||||
| Index | |||||||
| Death† | 0 (0) | 6 (0.4) | NA | 7 (0.3) | 9 (0.3) | 1.03 (0.38–2.77) | NA |
| MI | 55 (4.5) | 71 (4.3) | 1.15 (0.78–1.70) | 156 (6.3) | 243 (7.8) | 1.46 (1.17–1.82) | 0.28 |
| Revascularization‡ | 20 (1.6) | 23 (1.4) | 1.06 (0.57–1.97) | 99 (4.0) | 131 (4.2) | 1.22 (0.93–1.61) | 0.57 |
| Death + MI | 55 (4.5) | 74 (4.5) | 1.22 (0.83–1.79) | 162 (6.5) | 251 (8.1) | 1.45 (1.16–1.81) | 0.39 |
| Death + MI + Revasc | 61 (5.0) | 80 (4.8) | 1.18 (0.81–1.71) | 196 (7.9) | 275 (8.9) | 1.29 (1.05–1.58) | 0.66 |
| 30 day (Index ± follow up) | |||||||
| Death† | 6 (0.5) | 10 (0.6) | 1.19 (0.44–3.53) | 38 (1.5) | 29 (0.9) | 0.62 (0.38–1.004) | 0.24 |
| MI | 58 (4.7) | 74 (4.5) | 1.15 (0.79–1.68) | 165 (6.6) | 250 (8.0) | 1.42 (1.14–1.77) | 0.31 |
| Revascularization‡ | 25 (2.0) | 31 (1.9) | 1.13 (0.66–1.94) | 118 (4.8) | 159 (5.1) | 1.25 (0.97–1.60) | 0.61 |
| Death + MI | 61 (5.0) | 80 (4.8) | 1.19 (0.82–1.72) | 197 (7.9) | 273 (8.8) | 1.28 (1.04–1.57) | 0.59 |
| Death + MI + Revasc | 66 (5.4) | 91 (5.5) | 1.26 (0.88–1.80) | 237 (9.5) | 304 (9.8) | 1.16 (0.96–1.42) | 0.80 |
| Effectiveness | |||||||
| Index | |||||||
| Hospitalization | 709 (57.7) | 808 (48.8) | 0.71 (0.59–0.84) | 1522 (61.3) | 1774 (57.1) | 0.85 (0.75–0.96) | 0.14 |
| Objective Cardiac Testing | 369 (30.0) | 397 (24.0) | 0.80 (0.67–0.96) | 776 (31.2) | 910 (29.3) | 0.94 (0.83–1.06) | 0.29 |
| Early discharge | 492 (40.0) | 816 (49.3) | 1.47 (1.23–1.74) | 898 (36.2) | 1230 (39.6) | 1.13 (0.99–1.28) | 0.04 |
| 30 day (Index ± follow up) | |||||||
| Hospitalization | 723 (58.8) | 831 (50.2) | 0.72 (0.60–0.86) | 1565 (63.0) | 1818 (58.5) | 0.83 (0.73–0.94) | 0.23 |
| Objective Cardiac Testing | 402 (32.7) | 425 (25.7) | 0.78 (0.65–0.93) | 879 (35.4) | 1037 (33.4) | 0.94 (0.83–1.06) | 0.13 |
Models adjusted for the following variables: age, sex (race subgroups only), race (sex subgroups only), ethnicity, body mass index (BMI), emergency department l ocation, insurance status, smoking, history of coronary artery disease, diabetes, hyperlipidemia, hypertension, and presence of chest pain versus other symptoms concerning for acute coronary syndrome.
Index death is unadjusted and 30-day death is only adjusted for age given small number of events.
Only adjusted for age, sex, emergency department location, and presence of chest pain versus other symptoms concerning for acute coronary syndrome given small number of events.
Hospitalizations
Following implementation, 52.1% (1,342/2,576) of women were hospitalized between the index visit and 30-day follow-up, compared to 58.7% (1,153/1965) pre-implementation, a reduction of 6.6%; aOR of 0.74 (95% CI: 0.64–0.85). In men, 59.8% (1,307/2,185) were hospitalized postimplementation versus 64.9% (1,135/1,748) pre-implementation, a reduction of 5.1%; aOR of 0.87 (95% CI: 0.75–1.02). After implementation, 7.7% (95% CI: 4.9–10.6%) fewer women than men were hospitalized (P < .001).
Among non-white patients, 50.2% (831/1,655) were hospitalized post-implementation compared to 58.8% (723/1,229) pre-implementation; a difference of 8.6%; aOR: 0.72 (95% CI: 0.60–0.86). White patients had a reduction in hospitalizations of 4.5%; aOR of 0.83 (95% CI: 0.73–0.94), with 58.5% (1,818/3,106) occurring postimplementation and 63.0% (1,564/2,484) pre-implementation. Following implementation, 8.3% (95% CI: 53–11.1%) fewer non-white patients were hospitalized versus white patients (P < .001). Interactions between implementation and sex or race were not significant for 30-day hospitalizations.
In the post-implementation period, 17.6% (148/839) of females identified as low-risk, 193% (120/622) of males identified as low-risk, 80.4% (1,064/1,324) of females identified as nonlow risk, and 88.2% (1,064/1,207) of males identified as nonlow risk were hospitalized within 30-days. Hospitalizations occurred in 16.6% (98/590) of non-white patients identified as low-risk, 19.5% (170/871) of white patients identified as low-risk, 84.0% (649/773) of non-white patients identified as non-low-risk, and 84.1% (1,479/1,758) of white patients identified as non-low-risk.
Secondary endpoints
Among women, early discharge occurred in 46.8% (1,206/2,576) postimplementation vs 41.0% (806/1,965) pre-implementation; an increase of 5.8%; aOR of 1.28 (95% CI 1.12–1.48). In men, there was an increase in early discharges of 5.0%; aOR of 1.16 (95% CI 0.99–1.35), with early discharge occurring in 38.4% (840/2,185) postimplementation and 33.4% (584/1,748) pre-implementation. Following implementation, early discharge occurred more often in women compared to men; an absolute difference of 8.4% (95% CI: 5.5–11.2%; P < .001). In non-white patients, early discharge occurred in 49.3% (816/1,655) postimplementation vs 40.0% (492/1,229) pre-implementation; an increase of 9.3%; aOR of 1.47 (95% CI 1.23–1.74). In white patients, there was an increase in early discharges of 3.4%; aOR of 0.83 (95% CI 0.73–0.94), with early discharge occurring in 39.6% (1,230/3,106) postimplementation vs 36.2% (898/2,484) pre-implementation. Following implementation, early discharge occurred more frequently in non-white patients compared to white patients; a difference of 9.7% (95% CI: 6.7–12.7%) in non-white patients compared to white patients (P < .001). Interactions between implementation and sex were not significant (P = 0.50), but there was a suggestion of an interaction between implementation and race (P = .04).
In the postimplementation period, 83.4% (700/839) of females identified as low-risk, 80.9% (503/622) of males identified as low-risk, 17.8% (236/1,324) of females identified as nonlow risk, and 10.3% (124/1,207) of males identified as nonlow risk were discharged early. Early discharge occurred in 84.2% (497/590) of non-white patients identified as low-risk, 81.1% (706/871) of white patients identified as low-risk, 15.5% (120/773) of non-white patients identified as non-low-risk, and 13.7% (240/1,758) of white patients identified as non-low-risk.
OCT at 30-days occurred in 28.5% (735/2,576) of women postimplementation compared to 32.7% (643/1,965) pre-implementation; a decrease of 4.2%; aOR of 0.84 (95% CI 0.73–0.97). In men, OCT was 3.2% lower; aOR of 0.96 (95% CI 0.82–1.11), with 33.3% (727/2,185) occurring post- vs 36.5% (638/1,748) pre-implementation. After implementation, OCT occurred in 4.8% (95% CI: 2.1–7.4%) fewer women compared to men (P < .001). Among non-white patients, OCT at 30-days was completed in 25.7% (425/1,655) postimplementation compared to 32.7% (402/1,229) pre-implementation; a decrease of 7.0% and aOR of 0.78 (95% CI 0.65–0.93). In white patients, OCT was 2.0% lower; aOR of 0.94 (95% CI 0.83–1.06), with 33.4% (1,037/3,106) occurring in the post- vs 35.4% (879/2,484) pre-implementation cohorts. Postimplementation OCT occurred in 7.7% (95% CI: 5.0–10.4%) fewer non-white compared to white patients (P < 001). Interactions between implementation and sex or race were not significant (P = .53 and P = .13 respectively).
In the post-implementation cohort, non-adherence to the HEART Pathway occurred in 17.3% (375/2,163) of female patients, but only 13.3% (243/1,829) of male patients, a significant difference of 4.0% (95% CI: 1.8–6.3%). Nonadherence rates were similar in non-white and white patients, 15.6% (213/1,363) vs 15.4% (405/2,629), respectively.
Adjusted models for safety and effectiveness endpoints are listed in Table 3 and outcomes among low-risk patients in the Post-implementation cohort are compared between sexes and races in Table 4. A comparison of postimplementation utilization outcomes between sexes and races are summarized in Supplemental Table 6 and absolute differences in pre- vs post-implementation proportions of 30-day utilization outcomes are summarized in Supplemental Table 7.
Table 4.
30-day safety and effectiveness outcomes among low-risk patients in the Post-implementation cohort
| Outcomes | Female | Male | p-value | Non-White | White | P-value |
|---|---|---|---|---|---|---|
| N = 839 (%) | N = 622 (%) | N = 590 (%) | N = 871 (%) | |||
| (95% CI) | (95% CI) | (95% CI) | (95% CI) | |||
| Death | 2 (0.2) | 2 (0.3) | 1.0 | 2 (0.3) | 2 (0.2) | 1.0 |
| (0.03–0.9%) | (0.04–1.2%) | (0.04–1.2%) | (0.03–0.8%) | |||
| MI | 1 (0.1) | 1 (0.2) | 1.0 | 1 (0.3) | 1 (0.2) | 1.0 |
| (0.003–0.6%) | (0.004–0.9%) | (0.004–0.9%) | (0.003–0.6%) | |||
| Revascularization | 2 (0.2) | 0 (0) | 0.51 | 0 (0) | 2 (0.2) | 0.52 |
| (0.03–0.9%) | (0–0.6%) | (0–0.6%) | (0.03–0.8%) | |||
| Death + MI | 3 (0.4) | 3 (0.5) | 0.70 | 3 (0.5) | 3 (0.3) | 0.69 |
| (0.07–1.0%) | (0.1–1.4%) | (0.1–1.5%) | (0.07–1.0%) | |||
| Death + MI + Revasc | 4 (0.5) | 3 (0.5) | 1.0 | 3 (0.5) | 4 (0.5) | 1.0 |
| (0.1–1.2%) | (0.1–1.4%) | (0.1–1.5%) | (0.1–1.2%) | |||
| Hospitalization | 148 (17.6) | 120 (19.3) | 0.45 | 98 (16.6) | 170 (19.5) | 0.17 |
| (15.1–20.4%) | (16.3–22.6%) | (13.7–19.9%) | (16.9–22.3%) | |||
| Early discharge | 700 (83.4) | 503 (80.9) | 0.21 | 497 (84.2) | 706 (81.1) | 0.12 |
| (80.7–85.9%) | (77.6–83.9) | (81.0–87.1%) | (78.3–83.6%) | |||
| Objective Cardiac Testing | 85 (10.1) | 71 (11.4) | 0.44 | 46 (7.8) | 110 (12.6) | 0.003 |
| (8.2–12.4%) | (9.0–14.2%) | (5.8–10.3%) | (10.5–15.0%) |
Discussion
The primary finding of this analysis is that the HEART Pathway is safe and effective among male, female, white, and non-white patients. Use of the HEART Pathway was associated with a very low 30-day death and MI rate among low-risk patients regardless of sex or race. In addition, implementation decreased hospitalizations and OCT and increased early discharges in all sex and race subgroups. Further, nonsignificant interactions terms in our models suggest that the effect of the HEART Pathway implementation on the primary safety and effectiveness outcomes did not significantly differ based on sex or race.
The low 30-day death and MI rate among low-risk patients and decreased hospitalizations and OCT among sex and race subgroups in this analysis is consistent with our prior aggregate findings.20–22 Thus, our data suggest that clinicians can safely use the HEART Pathway for risk stratification of ED patients with chest pain regardless of sex or race. However, providers should be aware that the HEART Pathway is more likely to yield a low-risk assessment among women and non-whites, and that white females, non-white females, and non-white males are all more likely to be low-risk than white males, even after adjusting for age.
Prior studies evaluating the efficacy, effectiveness, and safety of the HEART Pathway and other chest pain ADPs have not evaluated sex and racial differences. However, prior disparities studies suggests that significant differences in clinical testing and outcomes exist on the basis of sex and race during medical evaluations.12,14,17,31 Our findings that, women and non-whites were more likely to be classified as low-risk by the HEART Pathway, are consistent with prior chest pain studies demonstrating that physicians tend to have higher risk estimates for men and whites.15,16,32–34 The infrequency of 30-day adverse events among low-risk women and non-whites suggests that the HEART Pathway did not underestimate risk in these subgroups. Therefore, the higher rate of low-risk assessments does not seem to imply misclassification by the HEART Pathway, but rather an accurate evaluation of low-risk that differs by subgroup.
Studies have found that implicit biases exist among health care providers, which may drive clinical decision making. This may help explain why the nonadherence rate to the HEART Pathway was higher in women. In addition, studies suggest that women and racial minorities are more likely to present with “atypical” chest pain characteristics compared to white men.13,35,36 Thus, provider scoring of the History section of the HEAR score may be a key driver of lower risk determinations in addition to factors such as prior CAD that differ between men and women and white and non-white patients. Future studies are needed to examine whether sex and race differences in risk classification using the HEART Pathway and adherence to the HEART Pathway occur as a result of implicit bias, increased frequency of atypical symptoms, a combination of both, or another reason entirely.
Limitations
This study has limitations. Secular trends and provider maturation effects are potential threats to the validity of our results. However, event rates were fairly consistent over time. In addition, our design had advantages of feasibility, cost-effectiveness, and generalizability compared to a traditional randomized trial. Using our EHR to collect events may have decreased event detection compared to traditional methods of follow-up. However, supplementing the EHR data with death index and claims data identified only 16 additional 30-day safety events. In addition, although our 3 sites were diverse in size and location (urban and suburban), results may not be generalizable to all US health systems. Furthermore, this study did not use high sensitivity troponin assays when evaluating the performance of the HEART Pathway. This could limit the generalizability of the results to health systems who are using high-sensitivity assays, which has become much more common in the US over time. It is unclear what impact high sensitivity assays may have on performance of the HEART Pathways within sex and race subgroups, and therefore needs further study. Finally, while these subgroup analyses were preplanned, this study was not designed to explain why differences in risk classification by subgroup occurred.
Conclusions
Among adult ED patients with symptoms concerning for ACS, women and non-whites are more likely to be classified as low-risk by the HEART Pathway. Use of the HEART Pathway had a 30-day death and MI rate ≤0.5% among low-risk patients regardless of sex or race. Hospitalizations and OCT were significantly reduced, and early discharge rate increased in each subgroup. Our data suggest that clinicians can safely use the HEART Pathway for the risk stratification of ED patients with acute chest pain regardless of sex or race, but should be cognizant that women and non-white patients are more likely to be classified as low-risk.
Supplementary Material
Funding:
This project was funded by the Donaghue Foundation and the Association of American Medical Colleges (AAMC). Dr. Snavely also receives funding from NHLBI (R01 HL118263-01). Dr. Mahler also receives research funding from Abbott Laboratories, Roche Diagnostics, Siemens, Ortho Clinical Diagnostics, Creavo Medical Technologies, PCORI, AHRQ, and NHLBI (1 R01 HL118263-01, L30 HL120008). Dr. Miller also receives research funding / support from Siemens, Abbott Point of Care, and 1 R01 HL118263-01. Dr. Mahler is the Chief Medical Officer for Impathiq Inc.
Footnotes
Supplementary materials
Supplementary material associated with this article can be found, in the online version, at doi:10.1016/j.ahj.2020.11.005.
References
- 1.Virani SS, Alonso A, Benjamin EJ, et al. Heart Disease and Stroke Statistics-2020 Update: a Report From the American Heart Association. Circulation 2020;141:e139–596. [DOI] [PubMed] [Google Scholar]
- 2.Survey NHAMC. Emergency Department Summary Tables. CDC; 2015. http://www.cdc.gov/nchs/data/ahcd/nhamcs_emergency/2010_ed_web_tables.pdf.2015. [Google Scholar]
- 3.Roger VL, Go AS, Lloyd-Jones DM, et al. Heart disease and stroke statistics-2011 update: a report from the American Heart Association. Circulation 2011;123:e18–e209. [DOI] [PMC free article] [PubMed] [Google Scholar]
- 4.Amsterdam EA, Kirk JD, Bluemke DA, et al. Testing of low-risk patients presenting to the emergency department with chest pain: a scientific statement from the American Heart Association. Circulation 2010;122:1756–76. [DOI] [PMC free article] [PubMed] [Google Scholar]
- 5.Pope JH, Aufderheide TP, Ruthazer R, et al. Missed diagnoses of acute cardiac ischemia in the emergency department. N Engl J Med 2000;342:1163–70. [DOI] [PubMed] [Google Scholar]
- 6.Pines JM, Isserman JA, Szyld D, et al. The effect of physician risk tolerance and the presence of an observation unit on decision making for ED patients with chest pain. Am J Emerg Med 2010;28:771–9. [DOI] [PubMed] [Google Scholar]
- 7.Fleischmann KE, Goldman L, Johnson PA, et al. Critical pathways for patients with acute chest pain at low risk. J Thromb Thrombolysis 2002;13:89–96. [DOI] [PubMed] [Google Scholar]
- 8.Gomez MA, Anderson JL, Karagounis LA, Muhlestein JB, Mooers FB. An emergency department-based protocol for rapidly ruling out myocardial ischemia reduces hospital time and expense: results of a randomized study (ROMIO). J Am Coll Cardiol 1996;28:25–33. [DOI] [PubMed] [Google Scholar]
- 9.Mark DG, Huang J, Chettipally U, et al. Performance of Coronary Risk Scores Among Patients With Chest Pain in the Emergency Department. J Am Coll Cardiol 2018;71:606–16. [DOI] [PubMed] [Google Scholar]
- 10.Kline JA, Shapiro NI, Jones AE, et al. Outcomes and radiation exposure of emergency department patients with chest pain and shortness of breath and ultralow pretest probability: a multicenter study. Ann Emerg Med 2014;63:281–8. [DOI] [PubMed] [Google Scholar]
- 11.Hyams JM, Streitz MJ, Oliver JJ, et al. Impact of the HEART pathway on admission rates for emergency department patients with chest pain: an external clinical validation study. J Emerg Med 2018;54:549–57. [DOI] [PubMed] [Google Scholar]
- 12.Dey S, Flather MD, Devlin G, et al. Sex-related differences in the presentation, treatment and outcomes among patients with acute coronary syndromes: the Global Registry of Acute Coronary Events. Heart 2009;95:20–6. [DOI] [PubMed] [Google Scholar]
- 13.Allabban A, Hollander JE, Pines JM, Gender, race and the presentation of acute coronary syndrome and serious cardiopulmonary diagnoses in ED patients with chest pain. Emerg Med J 2017;34:653–8. [DOI] [PubMed] [Google Scholar]
- 14.Hess EP, Perry JJ, Calder LA, et al. Sex differences in clinical presentation, management and outcome in emergency department patients with chest pain. CJEM 2010;12:405–13. [DOI] [PubMed] [Google Scholar]
- 15.Venkat A, Hoekstra J. Lindsell C, et al. The impact of race on the acute management of chest pain. Acad Emerg Med 2003;10:1199–208. [DOI] [PubMed] [Google Scholar]
- 16.López L, Wilper AP, Cervantes MC. et al. Racial and sex differences in emergency department triage assessment and test ordering for chest pain, 1997–2006. Acad Emerg Med 2010;17:801–8. [DOI] [PubMed] [Google Scholar]
- 17.Takakuwa KM, Shofer FS, Hollander JE. The influence of race and gender on time to initial electrocardiogram for patients with chest pain. Acad Emerg Med 2006;13:867–72. [DOI] [PubMed] [Google Scholar]
- 18.Riley RF, Miller CD, Russell GB. et al. Cost analysis of the History, ECG, Age, Risk factors, and initial Troponin (HEART) Pathway randomized control trial. Am J Emerg Med 2016;35:77–81. [DOI] [PMC free article] [PubMed] [Google Scholar]
- 19.Mahler SA, Hiestand BC, Goff DC Jr. et al. Can the HEART score safely reduce stress testing and cardiac imaging in patients at low risk for major adverse cardiac events. Crit Pathw Cardiol 2011;10:128–33. [DOI] [PMC free article] [PubMed] [Google Scholar]
- 20.Mahler SA, Miller CD, Hollander JE, et al. Identifying patients for early discharge: performance of decision rules among patients with acute chest pain. Int J Cardiol 2013;168:795–802. [DOI] [PMC free article] [PubMed] [Google Scholar]
- 21.Mahler SA, Riley RF, Hiestand BC, et al. The HEART Pathway randomized trial: identifying emergency department patients with acute chest pain for early discharge. Circ Cardiovasc Qual Outcomes 2015;8:195–203. [DOI] [PMC free article] [PubMed] [Google Scholar]
- 22.Mahler SA, Lenoir KM, Wells BJ. et al. Safely identifying emergency department patients with acute chest pain for early discharge. Circulation 2018;138:2456–68. [DOI] [PMC free article] [PubMed] [Google Scholar]
- 23.Mahler SA, Burke GL, Duncan PW, et al. HEART Pathway accelerated diagnostic protocol implementation: prospective pre-post interrupted time series design and methods. JMIR Res Protoc 2016;5:e10. [DOI] [PMC free article] [PubMed] [Google Scholar]
- 24.Quan H, Sundararajan V, Halfon P, et al. Coding algorithms for defining comorbidities in ICD-9-CM and ICD-10 administrative data. Med Care 2005;43:1130–9. [DOI] [PubMed] [Google Scholar]
- 25.Tonelli M, Wiebe N, Fortin M, et al. Methods for identifying 30 chronic conditions: application to administrative data. BMC Med Inform Decis Mak 2015;15:31. [DOI] [PMC free article] [PubMed] [Google Scholar]
- 26.So L, Evans D, Quan H. ICD-10 coding algorithms for defining comorbidities of acute myocardial infarction. BMC Health Serv Res 2006;6:161. [DOI] [PMC free article] [PubMed] [Google Scholar]
- 27.Riley RF, Don CW, Powell W, et al. Trends in coronary revascularization in the United States from 2001 to 2009: recent declines in percutaneous coronary intervention volumes. Circ Cardiovasc Qual Outcomes. 2011;4:193–7. [DOI] [PMC free article] [PubMed] [Google Scholar]
- 28.Culler SD, Kugelmass AD, Brown PP, et al. Trends in coronary revascularization procedures among Medicare beneficiaries between 2008 and 2012. Circulation 2015;131:362–70 discussion 370. [DOI] [PubMed] [Google Scholar]
- 29.Mahler SA, Stopyra JP, Apple FS, et al. Use of the HEART Pathway with high sensitivity cardiac troponins: a secondary analysis. Clin Biochem 2017;50(7–8):401–7. [DOI] [PMC free article] [PubMed] [Google Scholar]
- 30.Simel DL, Samsa GP, Matchar DB. Likelihood ratios with confidence: sample size estimation for diagnostic test studies. J Clin Epidemiol 1991;44:763–70. [DOI] [PubMed] [Google Scholar]
- 31.Spertus J, Safley D, Garg M, et al. The influence of race on health status outcomes one year after an acute coronary syndrome. J Am Coll Cardiol 2005;46:1838–44. [DOI] [PubMed] [Google Scholar]
- 32.Bradley EH, Herrin J, Wang Y, et al. Racial and ethnic differences in time to acute reperfusion therapy for patients hospitalized with myocardial infarction. JAMA 2004;292:1563–72. [DOI] [PubMed] [Google Scholar]
- 33.Lichtman JH, Leifheit EC, Safdar B, et al. , Sex differences in the presentation and perception of symptoms among young patients with myocardial infarction. Circulation 2018;137:781–90, [DOI] [PMC free article] [PubMed] [Google Scholar]
- 34.Vaccarino V, Parsons L, Every NR, et al. , Sex-Based Differences in early mortality after myocardial infarction. N Engl J Med. 1999;341:217–25. [DOI] [PubMed] [Google Scholar]
- 35.Canto JG, Rogers WJ, Goldberg RJ, et al. Association of age and sex with myocardial infarction symptom presentation and in-hospital mortality. JAMA 2012;307:813–22. [DOI] [PMC free article] [PubMed] [Google Scholar]
- 36.Khan NA, Daskalopoulou SS, Karp I, et al. Sex differences in acute coronary syndrome symptom presentation in young patients acute coronary syndrome symptoms in young patientsacute coronary syndrome symptoms in young patients. JAMA Intern Med 2013;173:1863–71, [DOI] [PubMed] [Google Scholar]
Associated Data
This section collects any data citations, data availability statements, or supplementary materials included in this article.