Abstract
Purpose:
Although there is no lymphatic system in the central nervous system (CNS), there seems to be a mechanism to remove macro molecules from the brain. Cerebrospinal fluid (CSF) and interstitial fluid (ISF) are thought to be parts of this pathway, but the details are not known. In this study, MR signal of the extracellular water was decomposed into components with distinct T2’s, to obtain some information about distribution of waste material in the brain.
Methods:
Images were acquired using a Curr, Purcell, Meiboom, Gill (CPMG) imaging sequence. In order to reduce T1 contamination and the signal oscillation, hard pulses were used as refocusing pulses. The signal was then decomposed into many T2 components using non-negative least squares (NNLS) in pixel-by-pixel basis. Finally, a color map was generated by assigning different color for each T2 component, then adding them together.
Results:
From the multi-echo images, it was possible to decompose the decaying signal into separate T2 components. By adjusting the color table to create the color map, it is possible to visualize the extracellular water distribution, as well as their T2 values. Several observation points include: (1) CSF inside ventricles has very long T2 (∼2 s), and seems to be relatively homogeneous, (2) subarachnoid CSF also have long T2, but there are short T2 component at the brain surface, at the surface of dura, at the blood vessels in the subarachnoid space, etc., (3) in the brain parenchyma, short T2 components (longer than intracellular component but shorter than CSF) exists along the white matter, in the choroid plexus, etc. These can be considered as distribution of macromolecules (waste materials) in the brain.
Conclusion:
From T2 component analysis it is possible to obtain some insight into pathways for the transport of large molecules in the CNS, where no lymphatic system is present.
Keywords: cerebrospinal fluid, interstitial fluid, lymphatic, glymphatic, neurofluid
Introduction
Cerebrospinal fluid (CSF) and interstitial fluid (ISF) is thought to help large molecules to move out of the brain, but exactly how it is done is largely unknown. In the tissue other than the brain, this function is carried out by the lymphatic system. For example, drainage of labeled albumin injected in the brain into deep cervical nodes has been shown for rabbits.1 However, the lymphatic system itself is not present in the central nervous system (CNS), and some other pathway must be present to function in place of the lymphatic system. The information about this pathway may be obtained indirectly by analyzing T2 values of the brain tissue and CSF, assuming that T2 reflects the protein content of CSF/ISF.
According to Daoust et al.,2 T2 of CSF (∼2 s), reduced from that of saline (∼3 s), can be explained by about 3 mM of glucose. This amount is about half of plasma glucose concentration (∼6 mM). Therefore, much shorter T2 of extracellular water (<1 s) must be caused by other factors, and protein is most likely, which has about 100 times stronger relaxivity as glucose (∼7.6 mM/s).
Since subarachnoid space has a complex shape, measuring T2 value for each pixel is not accurate due to partial volume effects. Also, in the brain parenchyma each pixel has different water compartments, each with different T2 values. In order to address this problem, the signal decay curve has to be decomposed into components with different T2 values. So-called bi-exponential analysis is decomposition into only two components, using non-linear curve fitting. While this approach is fairly popular, it has fundamental flaws. The number of components is limited to two, and also the reliability of estimated parameters (time constants and fractions of each component) is low, due to local minima in the non-linear minimization process.
Another approach, which is generally called inverse Laplace transform, has also been used for this purpose. In this approach, time constants of each component is assumed to be known. In other words, fractions of components with fixed time constants are calculated. Although there are several variations in this approach, we used a simple method called non-negative least squares (NNLS).
By decomposing tissue components with different T2’s, it is possible to estimate amount of extracellular water and its T2 value for each pixel. By looking at spatial distribution of water component with similar T2 value, it is possible to have some insight into large molecule transportation pathway in the CSF, as well as in the brain parenchyma. In the previous works, similar approach has been used to estimate myelin water.3 The difference is that myelin water has much shorter T2 than the brain parenchyma (10–50 ms), while our study is more focused on CSF/ISF with longer T2 (100–2000 ms).
Theory
The MRI signal from each pixel can be modeled as sum of T2 component, i.e.
where Si is the signal of the i-th echo, TEi is the echo time of the i-th echo, T2j is the T2 of j-th component, and mj is the magnitude of j-th component. When T2j are unknown, this equation becomes non-linear, and practically impossible to solve. However, if T2j are fixed to some known values, this equation becomes linear, and can be solved just by solving a set of linear equations,
where
and
The equation is ill-posed, but can be regularized reasonably well by assuming mj are all positive. The problem can be solved as constraint least squares as
where mj are elements of x.
Materials and Methods
MR imaging
Total of four volunteers were enrolled with informed consent, after our IRB approval. Multi-echo images were acquired using a Curr, Purcell, Meiboom, Gill (CPMG) imaging sequence on a 3T clinical scanner (Canon Medical Systems, Otawara, Japan). In order to reduce T1 contamination and signal oscillations, hard pulses were used as refocusing pulses. Therefore, only a single slice can be acquired at a time. Imaging parameters were as follows: TR = 5000 ms, the effective echo interval was 40 ms, slice thickness = 4 mm, number of echoes was 25, TE = 40, 80, 120, ..., 1000 ms. Actual echo interval and echo train length was 10 ms and 101 respectively. Five views were acquired for each effective echo time, with view sharing. A 16 channel head and neck coil was used, and parallel imaging was used with factor of 2 acceleration. Imaging time was 2 min 16 s.
NNLS
The decaying signal was decomposed into 25 T2 components, using NNLS, for each pixel. T2 values of 60–2000 ms, divided into 25 numbers with constant ratio interval were used. Standard Lawson and Hanson algorithm was used.4 Also, a numerical simulation was carried out to test the performance of the processing.
Color map
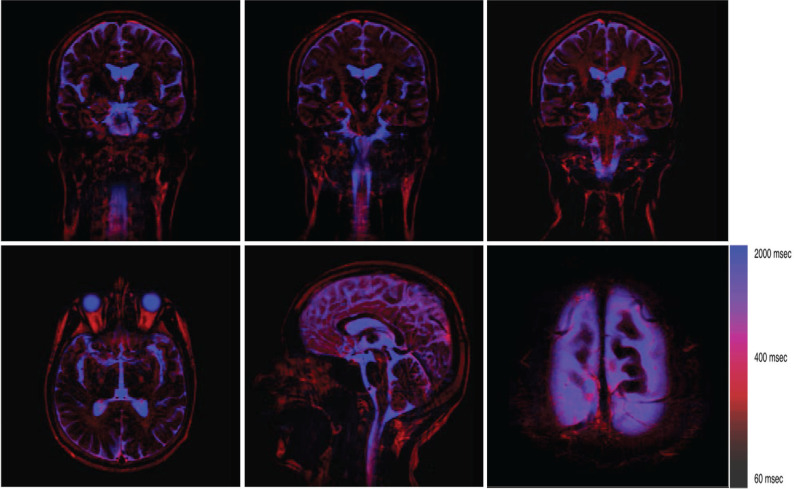
After NNLS, each pixel has multiple T2 values. In order to display this information in understandable way for human eyes, a color map image was generated from the set of images for different T2 values. First, different color was assigned to each T2 component. Then, the RGB value for each point was added for all T2 components. By doing this it is possible to grasp overlapping T2 values, although it is not exactly quantitative. Currently used color map has colors gradually changing from black (intracellular water) to red (extracellular water) to blue (CSF) (see Fig. 1, color scale).
Fig. 1.
Typical color maps. Pixels are roughly divided into three groups: intracellular (black), extracellular (red), and the CSF (blue). The extracellular water is distributed in the white matter, the brain surface, dural side of subarachnoid space or possibly in the subdural space, choroid plexus, etc. The T2 of the fat tissue is close to that of extracellular water, and it is sometimes difficult to distinguish these. This ambiguity can be eliminated by applying fat saturation pulse. The lower right image is an axial slice at the top of the head (magnified). In this image, fat saturation was turned on.
Results
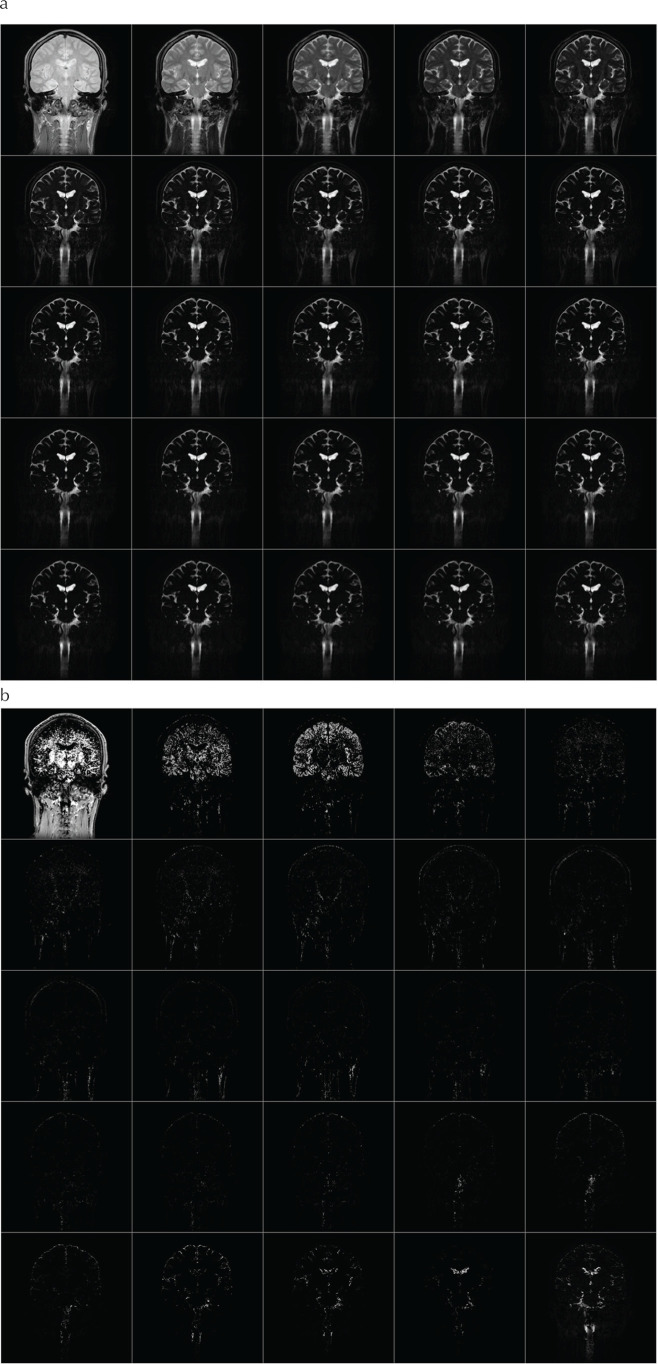
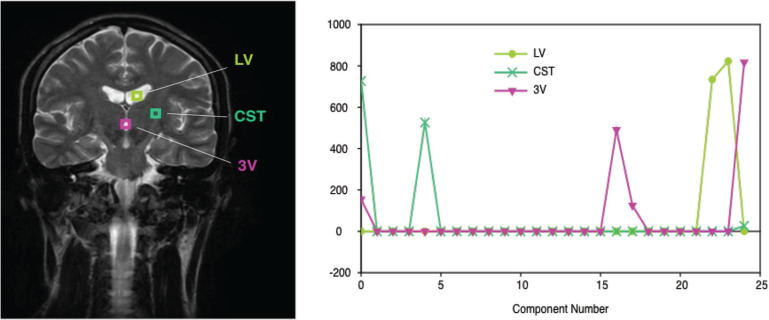
Acquired multi-echo images are shown in Fig. 2a. Using the NNLS, these echoes were decomposed into 25 components (Fig. 2b). T2 components of several selected pixels are shown in Fig. 3. Color map images were created for each slice from the T2 map (Fig. 1). As it can be seen in Fig. 2b, signal from intracellular component is dominant over extracellular water signal. In order to visualize the extracellular component more clearly, intracellular components, with T2 of around 60 ms, were assigned lower intensity colors. The components with longer T2 (>80 ms) were assigned colors ranging from red to blue.
Fig. 2.
This shows the acquired multi-TE images (a) and result of T2 decomposition (b). Images were acquired by a CPMG imaging sequence with echo interval of 40 ms, echo train length of 25. These images were decomposed into 25 T2 components, ranging from 60 to 2000 ms. On the figure, TE or T2 increases from left to right, then top to bottom. CPMG, Curr, Purcell, Meiboom, Gill.
Fig. 3.
Example of the result of decomposition with brain images. Three pixels were selected as the example. In many pixels, T2 values are clustered into two or three groups.
In general, the CSF has longest T2 of around 1800 ms (blue), and the interstitial fluid has shorter T2, distributed around 400 ms (red). Local distribution of ISF roughly coincides with the white matter fibers. Other places in which ISF is seen include surface of the cortical gray matter, surface of the ventricles, choroid plexus, and around the blood vessels within the sub-arachnoid space. T2 value of 400 ms of the extracellular water roughly corresponds to 0.25 mM of protein, assuming the relaxivity of protein is about 7.6 mM/s.2
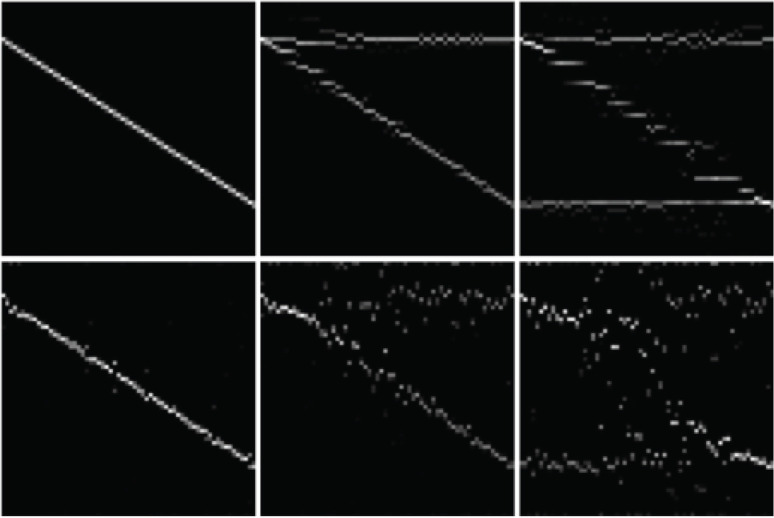
Results of a numerical simulation are shown in Fig. 4. Phantoms consist of either one, two, or three T2 components, with or without added noise. T2 decay signals for 64 pixels with different T2 combinations were generated, and processed using NNLS. The results are shown as 2D images, with the horizontal axis represents the pixels, and the vertical axis represents the T2 components. In this example, the signal was decomposed into 64 components.
Fig. 4.
This shows the results of numerical simulation of NNLS decomposition. Top row: without noise. Bottom row: Gaussian noise with SD of 1% of peak signal. From left to right: one, two, and three T2 components. Within each image, horizontal axis corresponds to pixel position, longitudinal axis corresponds to T2 value. Actual T2 values for each index are: 0 → 60.0, 5 → 124.6, 10 → 258.6, 15 → 537.0, 20 → 1114.9, 24 → 2000.0 (ms). NNLS, non-negative least squares.
Discussion
In the classical view, the CSF is formed at the choroid plexus, flows through the ventricles and the subarachnoid space, and is finally absorbed at the arachnoid villi into the venous sinus. However, many contradictory data have been shown in the past literature,5,6 although alternative theory has not been established yet. Currently dominant view is presented in the review by Klarica et al.,7 where CSF flow is summarized as below: (1) There is no unidirectional bulk flow in the CSF; (2) CSF moves as systolic–diastolic pulsation in all directions; (3) the water in the CSF comes from the capillaries, and absorbed into the capillaries; (4) CSF and ISF can exchange freely.
However, even this view does not explain removal process of large molecules from the CNS very well. In other tissues, this process is carried out by the lymphatic system. Small molecules, along with interstitial fluid, are absorbed into capillaries, and large molecules and some water remain outside of the blood vessels, and removed from there into the lymphatic system. Since there is no lymphatic system per se in the CNS, there must be some mechanism/pathway for removal of large molecules from the CNS. Recently, existence of lymphatic system in the dura mater, and clearance of tracers from the CNS into this dural lymphatic vessels was shown in mice8,9 and in humans.10
From our results, assuming the T2 values are related to protein or large molecule content of the CSF/ISF, it is possible to obtain some insight into this removal pathway, by following a principle that extracellular water (ISF and CSF) exist continuously along the pathway, and the T2 value of the water is continuous, or changes slowly along the pathway. Based on this principle, we can identify some pathways as candidate for the “lymphatic” flow within the CNS. One of which starts at the surface of the cortical gray matter, goes through subarachnoid space along the surface of large blood vessels, reaches the dural side of the subarachnoid space, then into the dural lymphatic vessel. It is known that the interstitial fluid is continuous with subpial space, but is separated from the subarachnoid space by the pia mater. There are also some fluid space in the arachnoid trabeculae, perivascular space around the blood vessels in the subarachnoid space. All of these spaces are directly continuous with the interstitial space, but not directly with the subarachnoid space, although there exists small pores on the arachnoid surface. For the sake of discussion, let us tentatively call these spaces “intra-arachnoid space” as a whole.
In our results, T2 values of the CSF in this “intra-arachnoid space” differs significantly with those of the CSF in the subarachnoid space and in the ventricles, indicating communication between intra- and sub-arachnoid space is limited. Water component with relatively short T2 seems to be continuous, forming possible pathways both within and outside of the brain parenchyma. Roughly speaking, there seems to be at least three distinct pathways: one goes from cortical surface to sub-dural space along the perivenous space and finally into dural lymphatic vessel, the second one in the deeper area of the brain, goes through perivascular space of the basal and internal cerebral veins then along the straight sinus, and the third one runs roughly along the corticospinal tract. Between the intra- and sub-arachnoid space, the CSF in the subarachnoid space and in the ventricles have much longer T2 values. It seems to be natural to assume that larger molecules moves within the intra-arachnoid space, where no rapid bulk flow exists, and the CSF moves freely within the subarachnoid space, outside of the intra-arachnoid space.
It is interesting to consider previous results in the literature applying this hypothesis. Naganawa et al.11 suggested that intravenously administered Gd contrast agent “leaks” slowly from the large veins at the brain surface. Using our hypothesis, this can be explained simply as contrast agent passing through the intra-arachnoid space from brain surface toward dural lymphatic vessels. Another example is the reports about diffusion changes along the corticospinal tract in the idiopathic normal pressure hydrocephalus (iNPH) patients.12,13 If it is assumed that there is ISF flow pathway, this diffusion change can be interpreted as changes in very slow flow along this pathway.
As an immediate clinical application, the proposed method might be useful to investigate pathophysiology of iNPH. The cause of enlarging of the CSF space is said to be related to increased osmotic pressure in the CSF, and T2 is considered to be correlated with osmotic pressure.
Conclusion
A novel method to estimate T2 components of CSF and ISF without partial volume effect was developed. By separating T2 decaying curves into different T2 components, different kinds of water compartments can be visualized without partial volume effects. Based on the color map indicating the distribution of extracellular water and its T2, it is possible to obtain some insight into pathway to transport large molecules in the central nervous system, where no lymphatic system is present.
Footnotes
Conflicts of Interest
Koichi Oshio and Shinya Yamada have no conflicts of interest; Masao Yui and Seiko Shimuzu are employees of Canon Medical Systems.
References
- 1.Yamada S, DePasquale M, Patlak CS, Cserr HF. Albumin outflow into deep cervical lymph from different regions of rabbit brain. Am J Physiol 1991; 261:H1197–H1204. [DOI] [PubMed] [Google Scholar]
- 2.Daoust A, Dodd S, Nair G, et al. Transverse relaxation of cerebrospinal fluid depends on glucose concentration. Magn Reson Imaging 2017; 44:72–81. [DOI] [PMC free article] [PubMed] [Google Scholar]
- 3.MacKay A, Laule C, Vavasour I, Bjarnason T, Kolind S, Mädler B. Insights into brain microstructure from the T2 distribution. Magn Reson Imaging 2006; 24:515–525. [DOI] [PubMed] [Google Scholar]
- 4.Bro R, de Jong S. A fast non-negativity-constrained least squares algorithm. J Chemometrics 1997; 11:393–401. [Google Scholar]
- 5.Hassin GB, Oldberg E, Tinsley M. Changes in the brain in plexectomized dogs with comments on the cerebrospinal fluid. Arch Neurol Psychiatry 1937; 38:1224–1239. [Google Scholar]
- 6.Kudo K, Harada T, Kameda H, et al. Indirect proton MR imaging and kinetic analysis of 17O-labeled water tracer in the brain. Magn Reson Med Sci 2018; 17:223–230. [DOI] [PMC free article] [PubMed] [Google Scholar]
- 7.Klarica M, Radoš M, Orešković D. The movement of cerebrospinal fluid and its relationship with substances behavior in cerebrospinal and interstitial fluid. Neuroscience 2019; 414:28–48. [DOI] [PubMed] [Google Scholar]
- 8.Louveau A, Smirnov I, Keyes TJ, et al. Structural and functional features of central nervous system lymphatic vessels. Nature 2015; 523:337–341. [DOI] [PMC free article] [PubMed] [Google Scholar]
- 9.Aspelund A, Antila S, Proulx ST, et al. A dural lymphatic vascular system that drains brain interstitial fluid and macromolecules. J Exp Med 2015; 212:991–999. [DOI] [PMC free article] [PubMed] [Google Scholar]
- 10.Absinta M, Ha SK, Nair G, et al. Human and nonhuman primate meninges harbor lymphatic vessels that can be visualized noninvasively by MRI. Elife 2017; 6:pii: e29738. [DOI] [PMC free article] [PubMed] [Google Scholar]
- 11.Naganawa S, Nakane T, Kawai H, Taoka T. Age dependence of gadolinium leakage from the cortical veins into the cerebrospinal fluid assessed with whole brain 3D-real inversion recovery MR imaging. Magn Reson Med Sci 2019; 18:163–169. [DOI] [PMC free article] [PubMed] [Google Scholar]
- 12.Hattori T, Yuasa T, Aoki S, et al. Altered microstructure in corticospinal tract in idiopathic normal pressure hydrocephalus: comparison with Alzheimer disease and Parkinson disease with dementia. AJNR Am J Neuroradiol 2011; 32:1681–1687. [DOI] [PMC free article] [PubMed] [Google Scholar]
- 13.Kamiya K, Hori M, Irie R, et al. Diffusion imaging of reversible and irreversible microstructural changes within the corticospinal tract in idiopathic normal pressure hydrocephalus. Neuroimage Clin 2017; 14:663–671. [DOI] [PMC free article] [PubMed] [Google Scholar]


