Abstract
Research on cell migration and interactions with the extracellular matrix (ECM) was mostly focused on 2D surfaces in the past. Many recent studies have highlighted differences in migratory behaviour of cells on 2D surfaces compared to complex cell migration modes in 3D environments. When embedded in 3D matrices, cells constantly sense the physicochemical, topological and mechanical properties of the ECM and adjust their behaviour accordingly. Changes in the stiffness of the ECM can have effects on cell morphology, differentiation and behaviour and cells can follow stiffness gradients in a process called durotaxis. Here we introduce a detailed protocol for the assembly of 3D matrices consisting of collagen I/fibronectin and embedding cells for live cell imaging. Further, we will show how the matrix can be stiffened via non-enzymatic glycation and how collagen staining with fluorescent dyes allows simultaneous imaging of both matrix and cells. This approach can be used to image cell migration in 3D microenvironments with varying stiffness, define cell-matrix interactions and the cellular response to changing ECM, and visualize matrix deformation by the cells.
Keywords: 3D collagen matrix, 3D imaging, Cell-matrix interaction, Cancer cell migration, Filopodia, Live cell imaging
Background
Cells and the surrounding extracellular matrix (ECM) build functional entities that rely on dynamic adjustments of both, the matrix and the cells, to prevent disease. For years it was thought that the ECM solely provides structural support for embedded cells. However, recent research has highlighted the pivotal functions of the ECM beyond its scaffold function. Modifications of the ECM have been linked to disease progression, and particularly in the context of cancer, in metastasis initiation and subsequent links to clinical prognosis and patient survival.
On one hand, the ECM can create a barrier that impedes cell migration. Spatial confinement in the matrix provokes cell adaptations, such as cell body deformation, nuclear deformation and active ECM remodelling by matrix metalloproteinases ( Bonnans et al., 2014 ; Jayo et al., 2016 ; Yamada and Sixt, 2019). Conversely, fibrous structures built by a network of collagen and matrix-associated proteins can support cell migration by providing a three-dimensional fibrillary physical scaffold to guide directed motility. ECM components, such as fibronectin provide anchor points for cell adhesion, which is important for mesenchymal migration modes. Cell migration in 2D has been extensively studied and the basic principles include repeated cycles of membrane protrusion at the leading edge, adhesion, F-actin retrograde flow, and actomyosin-driven cell retraction (Abercrombie, 1980, Yamada and Sixt, 2019). Cell migration in 3D is emerging to be a more complex process and cells have been reported to use mesenchymal, amoeboid, lobopodial and collective cell migration and can also interconvert between these forms depending on the mechanical properties of the microenvironment (van Helvert et al., 2018 , Yamada and Sixt, 2019). Invasive cancer cells align along and attach to ECM tension fibres during migration and often leave behind tunnels due to MMP degradation at the front (Yamada and Sixt, 2019). Before the onset of locomotion, many migratory cells explore the ECM with actin-rich membrane protrusions, such as filopodia or lamellipodia, a prerequisite for successful navigation through 3D environments. This allows sensing of dynamic changes in the microenvironment and direct adaptation to the topography, stiffness and anchor points within the matrix ( Leithner et al., 2016 , Pfisterer et al., 2020 ).
Recent development of novel imaging tools and advanced microscopes with high resolution and frame rates allow the visualization of these processes in real-time with limited photo-toxicity. Various models have been used, including organotypic, cell-derived or 3D matrices, to investigate cell behaviour in a more physiological 3D environment. However, a detailed general 3D matrix protocol for broad applicability of cancer cell-ECM interaction studies has not been published, to our knowledge. We recently developed a 3D system with variable mechanical properties to monitor the phenotype of cancer cells and the role of the filopodia stabilizing protein fascin within this by live cell imaging ( Pfisterer et al., 2020 ). Our system allows analysis of any protein of interest in living cells embedded into a collagen-fibronectin matrix. Further, we show how the matrix can be stiffened via non-enzymatic glycation to investigate the impact of matrix stiffening on cell or molecule behaviour. Finally, we provide a simple method for collagen staining with fluorescent dyes for simultaneous imaging of the matrix and the cells that allows to draw conclusions on reciprocal forces between the ECM and interacting cells and to predict correlations between cell morphology and behaviour and matrix deformation.
Materials and Reagents
Imaging chambers 8-well, glass bottom (Nunc, Lab-Tek, catalog number: 155411PK)
Coverslips, glass d = 5 mm, 0.13-0.16 mm thickness (Fisher Scientific, catalog number: 11888372)
10 cm Petri dishes (Fisher Scientific, Nunc, catalog number: 150350)
Culture flasks T25 (Greiner Bio One, catalog number: 690160)
Glass beaker for dialysis
Dialysis tubes for small volume dialysis; dialysis membrane with MWCO 8,000 Da (GE Healthcare, catalog number: 11520694)
DMEM – high glucose, 4500 mg/L glucose (Sigma-Aldrich, catalog number: D5796)
Fetal calf serum, FCS (Fisher Scientific, Gibco, catalog number: 26140079)
L-Glutamine (Sigma, catalog number: G7513)
Penicillin-Streptomycin (Sigma, catalog number: P4333)
Trypsin-EDTA (Sigma, catalog number: 59427C)
Rat tail collagen I, in 0.02N acetic acid, conc. approx. 10 mg/ml (Corning, catalog number: 354249), stored at 4 °C
HEPES solution (Sigma, catalog number: H3662)
Fibronectin (Merck Millipore, catalog number: FC010)
Sodium Bicarbonate (NaHCO3), powder (Sigma, catalog number: S5761)
Sodium Bicarbonate 7.5% solution for cell culture (Fisher Scientific, Gibco, catalog number: 25080094
1 M Sodium hydroxide (NaOH) solution (Sigma, catalogue number: S2770)
Acetic acid, glacial (Sigma, catalogue number: A6283)
1x PBS; deficient of CaCl2 and MgCl2 (Gibco, catalog number: 14190-094)
D(-)-Ribose (AppliChem, Biochemica, catalog number: A2219.0050)
Cy5 monoreactive dye (Amersham, GE Healthcare, catalog number: PA25001)
Full Medium (see Recipes)
0.5 M ribose stock solution (see Recipes)
0.1 M Sodium bicarbonate (see Recipes)
0.1% acetic acid (see Recipes)
Cy5-labeled collagen (see Recipes)
Soft and stiff collagen matrices (see Recipes)
Equipment
Overhead tube rotator (Fisher Scientific, catalog number: 11496548)
Magnetic mixer (Fisher Scientific, catalog number: 11936558)
Centrifuge (Starlab, catalog number: SLN2631-0007)
Ice bucket
Inverted confocal microscope (e.g., Nikon A1R on Ti Eclipse) with appropriate wavelength lasers (488 nm, 561 nm)
Water immersion objective (e.g., 40x Nikon Apochromat LWD WI, 1.15 NA)
Lattice Light Sheet microscope (we used the instrument within the AIC, Advanced Imaging Center, Janelia Research Campus)
Software
Nikon NIS Elements Software to operate Nikon A1R on Ti Eclipse
LabView to operate Lattice Light Sheet Microscope prototype at the AIC
Procedure
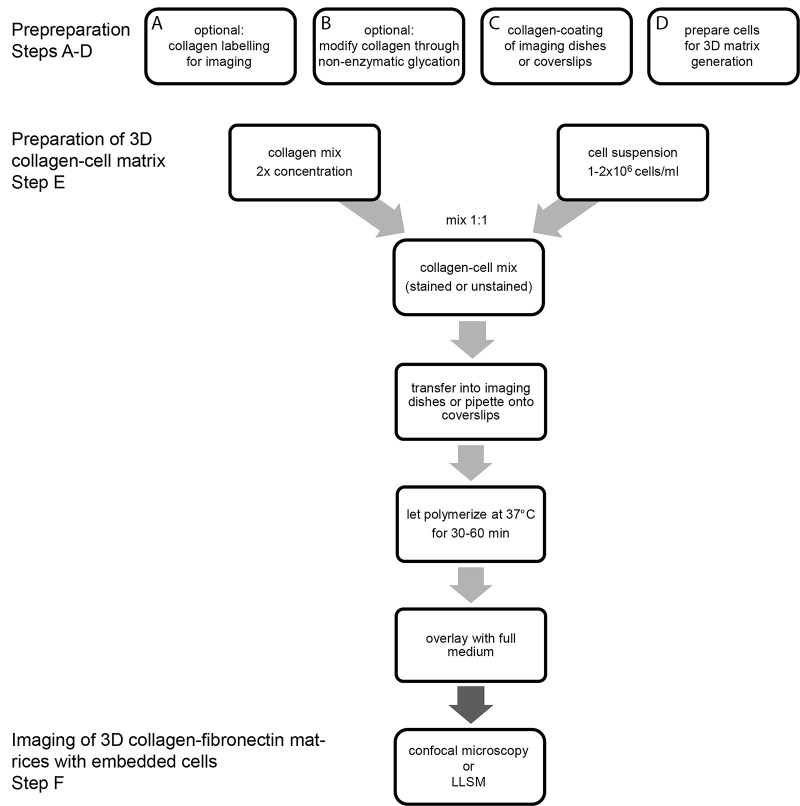
Please see also Figure 1 for a timeline of Steps A to F.
Figure 1. Timeline of the main protocol steps.
This timeline summarizes the main steps of the protocol. Optional steps are highlighted. LLSM, lattice light sheet microscopy.
Timeline
The main steps of the procedure are summarized in the timeline shown in Figure 1 below.
-
Collagen labeling for imaging (Figure 2, see also Recipe section, Table 1)
Prepare 0.1 M sodium bicarbonate (pH = 9.3) and cool to 4 °C.
Add 900 µl of 0.1 M sodium bicarbonate to one Cy5 tube (contains sufficient dye to label 1 mg of protein) and add 100 µl of collagen stock solution.
Rotate for 30 min at 4 °C on an overhead rotator (cold room, 4 °C).
Transfer collagen-dye solution into precooled dialysis tubes and place the tube in a beaker filled with 500 ml precooled 0.1% acetic acid (prepared with ddH2O).
Dialyze labeled collagen for 24 h at 4 °C using a magnetic flea and a magnetic mixer at slow speed. Exchange acetic acid solution 4-5 times to fresh 0.1% acetic acid during the 24 h dialysis (minimum of 4 changes in 24 h). Keep in the dark.
Transfer labeled collagen into 1.5 ml Eppendorf tube and store in the dark at 4 °C. This solution can be stored for up to one week without affecting polymerization and labeling efficiency.
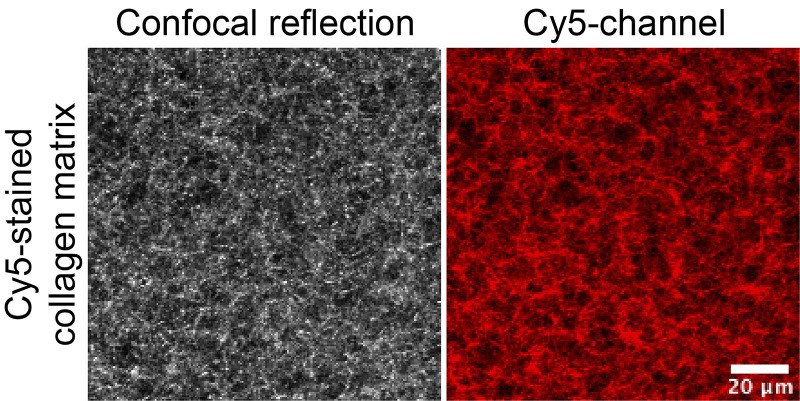
Before 3D matrix preparation, replace 2.5% of unstained collagen (dry weight, see calculation example in Table 1) with Cy5-stained collagen (1:10 dilution of stock) and calculate new concentration (Table 1). Figure 1 illustrates polymerized collagen imaged using a 40x Nikon Apochromat LWD WI objective (1.15 N.A) for confocal reflection microscopy (488 laser for excitation and a 482/35 filter for reflected light; left) and Cy5-labeled collagen (640nm laser for excitation and a Cy5 filter to measure emitted fluorescent light between 670-700; right).
-
Modification of collagen through non-enzymatic glycation
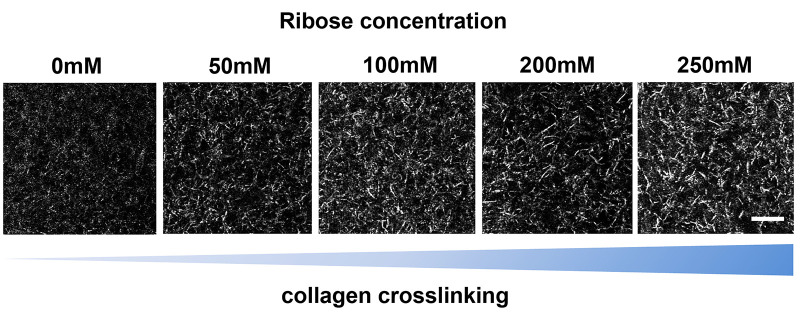
Here, the glucose metabolite ribose is used to create intermolecular crosslinks between collagen fibres via glycation to change matrix stiffness (Figure 3).
Prepare a 0.5 M ribose stock solution by dissolving ribose in PBS or serum-free phenol-red free DMEM and keep on ice.
Determine the change in stiffness you would like to obtain in your 3D matrix. As a guide, 200 mM ribose changes the stiffness from ~200 Pa in unmodified gels to ~800 Pa in ribose modified gels. Increasing concentrations of ribose have been shown to result in a linear increase in stiffness ( Roy et al., 2010 ; Mason et al., 2013 ).
Mix collagen stock solution with ribose solution to obtain a final ribose concentration of e.g., 200 mM and incubate on ice for a minimum of 30 min (recalculate the collagen concentration in the dilution).
Keep collagen stock solution on ice until progressing to matrix preparation.
-
Coating of glass-bottom chamber slides or glass coverslips to prevent detachment of 3D matrix
Use cleaned glass coverslips or glass-bottom chamber slides before coating with collagen.
Place the coverslips in a 10 cm Petri dish and incubate with a 1:100 dilution of collagen in acetic acid (0.1 mg/ml collagen in 0.1% acetic acid) at 4 °C overnight.
Remove collagen coating solution and wash 2-3 times with 1x PBS.
Store coverslips (in 10 cm Petri dish) or chamber slides covered with PBS at 4 °C (for up to one week), before using as base for 3D matrix preparation.
-
Cell culture and preparation for imaging
Quickly thaw an aliquot of cancer cells at 37 °C (we used fascin knock-down HeLa cells reconstituted with GFP-fascin, frozen in media plus 10% DMSO) and add 1 ml cells to 6 ml prewarmed phenol-red free high-glucose DMEM supplemented with 10% FCS, 1% Glutamine and 1% Pen/Strep.
Culture cells overnight under standard conditions (37 °C, 5% CO2 and 95% humidity) and change media next day.
Subculture cells every 2-3 days (at approximately 70-80% confluency) and maintain HeLa cells in a density range of 1 x 10⁶-3 x 10⁶ cells per T25 flask until they recovered from the freeze-thaw process.
To trypsinize cells, remove the media, wash them briefly with 1x PBS and incubate the cells with 1-2 ml of 0.05% Trypsin-EDTA solution at 37 °C (until roughly 80-90% of cells detached from the culture flask).
Add fresh fully supplemented DMEM (> 5 times the volume of Trypsin-EDTA solution), take an aliquot for imaging and subculture the other cells 1:4.
Spin cell aliquot for imaging at 2000 rpm (500 x g) for 4 min and resuspend cell pellet in full medium.
Count cells, adjust cell density to 1 x 10⁶-2 x 10⁶ cells/ml and put on ice until 3D matrix preparation.
-
Preparation of 3D collagen-fibronectin matrices with embedded cells (Figure 4, see also Recipe section, Table 2)
Choose the desired final volume and characteristics of the matrix/cell solution (stained, unstained, stiffness).
As a general rule, collagen working solutions are made in a twofold concentration and then mixed 1:1 with the cell suspension.
Prepare the 2x collagen working solution containing 40 mM HEPES (final conc. after mixing with cell suspension 20 mM), 40 µg/ml fibronectin (final conc. 20 µg/ml), 0.6% sodium bicarbonate for TC (final percentage 0.3%), serum-free phenol-red free DMEM, and NaOH to neutralize the pH of the solution. Use 20 mM NaOH to neutralize a collagen stock solution in 0.02 N acetic acid (calculated with the volume of collagen stock solution that will be added to prepare collagen working solution) and always calculate in respect to actual acetic acid volume. Please note that the final concentrations will be halved in the collagen-cell solutions (as indicated in brackets).
Mix well and carefully add unstained or stained collagen or ribose-modified collagen to the mix. Try to avoid bubbles! Bubbles can affect the homogeneity of the 3D collagen matrix structure and affect embedded cells. This can have adverse effects on image quality by changes of the refractive index.
Mix final collagen working solution 1:1 with prepared and cooled cell solution by carefully and slowly pipetting up and down.
Keep the final cell density between 5 x 10⁵-1 x 10⁶ cells/ml gel to image single cells in 3D matrix (Figure 3 shows a single cancer cell in polymerized collagen matrix).
Immediately transfer the collagen-cell mixture into pre-coated imaging dishes (150-200 µl per 8-well chamber), or pipette 10 µl onto pre-coated 5 mm glass coverslips placed into 12-well plates (one coverslip in each well). Due to the surface tension, the drop of collagen-cell mixture forms a dome on the 5 mm glass coverslip.
Incubate the mixture for 30-60 min at 37 °C in the incubator and allow the collagen to polymerize. Note that the collagen turns turbid when fully solidified. To avoid eventual drying of the collagen-cell mixture, 8-well imaging dishes can be placed into a humidified box, such as a 10 cm dish that contains a water soaked tissue (use sterile water). The incubation time for the coverslips with 10 µl collagen-cell mixture can be limited to 20-30 min.
Gently overlay the collagen-cell matrix with prewarmed full medium.
Incubate collagen-gel matrices at 37 °C for 12 h prior to imaging to allow efficient glycation reactions (only applicable to cells with low matrix degradation activity).
Alternatively, prepare ribose in 0.1% acetic acid and incubate with collagen 2-3 days at 4 °C before matrix preparation ( Roy et al., 2010 ). In this case, the amount of NaOH to neutralize acetic acid needs to be adjusted to the collagen-ribose solution volume.
-
Imaging
Prewarm imaging media and exchange media to full medium including 20 mM HEPES, if imaging without CO2.
Preheat imaging chambers and let matrix and cells equilibrate to new environment.
-
Imaging of 3D collagen-cell matrix using confocal microscopy:
Collagen-cell matrices polymerized in imaging chambers can be imaged at a conventional inverted confocal microscope with heating chamber (37 °C).
Use a 40x or 60x water immersion objective to allow greater imaging depth in z (imaging depth of ≤ 250 µm possible, see also section “Further comments on imaging”).
First, focus on the glass coverslip and then move up 50-100 µm in z (away from coverslip). This minimizes a potential impact of the stiff coverslip on cells.
Unstained collagen fibres can be visualized using confocal reflection, stained collagen fibres can be visualized using the respective laser and detection setting.
-
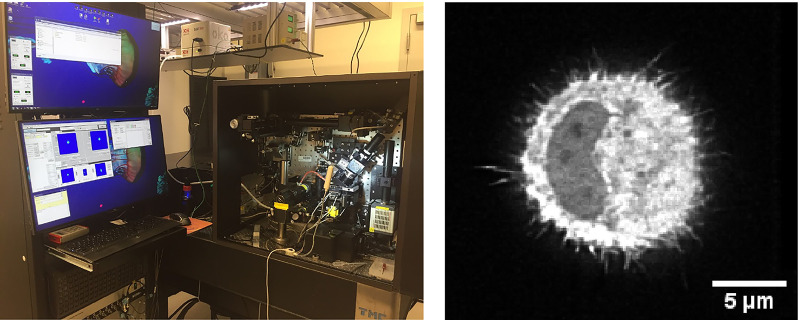
Imaging of 3D collagen-cell matrix using a Lattice Light Sheet microscope (LLSM, Figure 5):
Use collagen-cell matrices on 5 mm coverslips for imaging on the LLSM.
Coverslips with matrix have to be fixed on the holder before imaging in full medium at 37 °C and 5% CO2.
Figure 2. Example of images of 3D matrix containing Cy5-labeled collagen imaged on an inverted confocal microscope.
Cy5-labeled collagen was mixed with unlabeled collagen and 2 mg/ml 3D collagen matrix was prepared. Gels were cast in 8-well imaging chambers for imaging using an inverted microscope. Cy5 channel (red) is depicted on the right, and total collagen was visualized using confocal reflection microscopy (left).
Table 1. Mixing in stained collagen.
Shown is a calculation scheme example to prepare stained collagen to be used for 3D matrix preparation.
| Collagen staining calculation | Volume | Collagen dry weight in mg | Final concentration |
| Unlabeled collagen stock solution | 975 µl | 9.75 mg | 10 mg/ml |
| 2.5% Cy5 labeled collagen | 250 µl | 0.25 mg | 1 mg/ml |
| Cy5-collagen solution | 1225 µl | 10 mg | 8.16 mg/ml |
Figure 3. 3D collagen matrix visualized via confocal reflection microscopy.
Collagen fibres were crosslinked using ribose-induced glycation and imaged on a confocal microscope. Images highlight increasing matrix modification through glycation-induced crosslinking of collagen fibres. Scale bar = 10 µm.
Figure 4. Representative image of a cancer cell in unstained 3D collagen matrix.
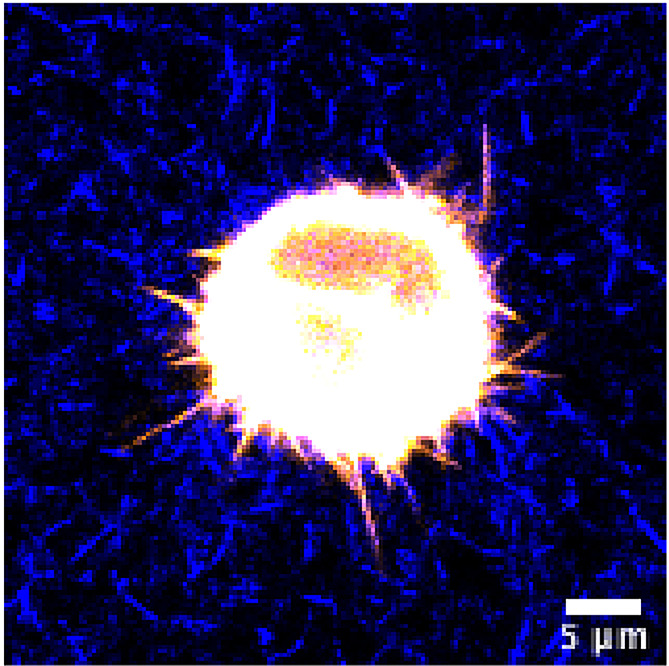
HeLa cell expressing GFP-fascin (pseudocolored using orange hot LUT) was embedded in 3D collagen-fibronectin matrix and imaged with a water immersion 40x objective on a Nikon Eclipse confocal microscope. Collagen fibres were visualized using confocal reflection microscopy and pseudocolored in blue. Scale bar = 5 µm.
Table 2. Preparation of 3D matrices with varying mechanical properties.
Shown is a pipetting scheme for the preparation of collagen-fibronectin matrices with embedded cells. Volumes are shown for the generation of 1 ml of soft and stiff matrix (200 mM).
| Collagen matrix calculation scheme | Soft | Stiff |
| Collagen stock solution | 200 µl | 200 µl |
| 0.5M ribose solution (in medium) | - | 133.3 µl |
| leave on ice for 30 min | ||
| HEPES (stock = 1 M) | 20 µl | 20 µl |
| Fibronectin (stock = 1mg/ml) | 20 µl | 20 µl |
| 1 M NaOH | 4 µl | 4 µl |
| Sodium bicarbonate (7.5% solution) | 40 µl | 40 µl |
| Phenol-red free medium (serum-free) | 216 µl | 82.7µl |
|
mix collagen working solution 1:1 with cell suspension |
||
| Cells in medium | 500 µl | 500 µl |
| Final volume of collagen-cell mix | 1000 µl | |
Figure 5. Lattice light sheet microscope imaging.
For our experiments we used the Lattice Light Sheet microscope based at the Advanced Imaging Center, Janelia Research campus. The microscope setup is shown on the left, a typical image of a cell in 3D is shown on the right.
Further comments on imaging
Several microscopes, such as confocal microscopy, structured illumination microscopy (SIM) and light sheet microscopy, can be used to image cells in 3D collagen matrices and all techniques have their own limitations and benefits. We have successfully used confocal microscopy for short time movies (up to 20 min) of cells expressing fluorescently labeled proteins in 3D. However, longer imaging was unsuccessful due to photo-bleaching and photo-toxicity. Also, low expression levels of fluorescently tagged protein and high framerate and laser power can further have an adverse effect on imaging length. Lattice light sheet microscopy overcomes some of those problems as the laser illumination is low and the light more focused. This allows long-term imaging of cells (up to several hours) with low photo-bleaching and photo-toxicity. Further, resolution can be increased when using LLSM instead of confocal microscopy. A major drawback of both imaging techniques is the speed at which 3D structures can be resolved, in particular when multiple fluorophores have to be detected in highly dynamic cells in 3D. As an alternative, 3D-SIM can be used as it allows fast 3D imaging and high resolution compared to the other two methods.
Special attention should be paid to the objective and immersion medium used for imaging cells in 3D matrices. To optimize resolution, which is limited by the diffraction of light, the refractive index of the sample (in our case an aqueous collagen-cell matrix) and the immersion medium should be matched. A mismatch results in spherical aberrations due to a change in the refractive index between the immersion medium and the aqueous 3D matrix and ultimately reduces resolution significantly. Several immersion media are available and all have a particular refractive index n, such as silicone oil (n = 1.4), glycerol (n = 1.47), oil (n = 1.52), water (n = 1.33) and air (n = 1). As 3D collagen matrices are aqueous, water immersion objectives offer an increased resolution in the z dimension (axial direction) and allow a high penetration depth with limited spherical aberrations compared to the others. This is in particular important when cells or collagen fibres that are further away from the coverslip shall be imaged as the distortion of light is increased with increasing imaging depth in z.
Data analysis
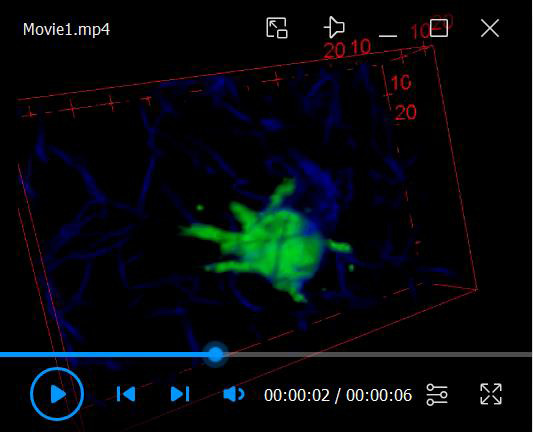
For visualization of time-lapse image sequences, movie generation (see Video 1 for example of 3D rendered cell in collagen), 3D rendering and tracking, we would suggest exploring the following software platforms that we found very useful in our own analysis:
Video 1. Video 1. Movie of 3D rendered cell in collagen gel.
Open-source software:
ImageJ/FiJi (https://imagej.net/Fiji) ( Schindelin et al., 2012 )
ICY (http://icy.bioimageanalysis.org/) ( de Chaumont et al., 2012 )
ZeroCostDL4Mic (https://github.com/HenriquesLab/ZeroCostDL4Mic/wiki) ( von Chamier et al., 2020 )
CellProfiler (Broad Institute, https://cellprofiler.org/)
u-shape3D (https://github.com/DanuserLab/u-shape3D) ( Driscoll et al., 2019 )
Commercial software:
Imaris Software (Oxford Instruments, https://imaris.oxinst.com)
Arivis Vision 4D (Arivis AG, https://www.arivis.com/de/imaging-science/arivis-vision4d)
Volocity Software (Quorum Technologies, https://quorumtechnologies.com/volocity)
-
Matlab (MathWorks, https://de.mathworks.com/products/matlab.html)
A comprehensive list of tools to analyse and quantify cell shape, high-dimensional morphometric data and deep learning tools has been summarized recently ( Bodor et al., 2020 ).
Notes
We used Telocollagen (acid extracted) for our studies. Using Atelocollagen (enzyme extracted) may prolong the time until collagen matrix is fully polymerized and could also alter the structure.
All work with collagen (especially when using Telocollagen) has to be performed on ice, with precooled solutions, tubes and plates. Handling time should be kept to a minimum.
Be very careful with pipetting collagen solutions to avoid bubbles!
Keep preparation time constant between experiments to guarantee reproducibility. Non-pepsin treated neutralized collagen solutions can already start to polymerize at 4 °C.
Be careful when transporting 3D collagen matrices to the microscopes, as they are very fragile!
Preheat media and imaging chambers to 37 °C and let cells adjust to new environment for 30 min before imaging.
For confocal reflection microscopy, reflected light from objects in the specimen is detected. In our protocol, collagen fibres are illuminated with a 488 nm laser and the reflected light is measured. The filter setting should be set up to filter reflected light in the range of 465-500 nm (we used a 515 LP filter followed by a 482/35 filter).
Recipes
-
Full Medium
500 ml DMEM
50 ml heat-inactivated FCS
5 ml L-Glutamine (100x)
5 ml Pen Strep (100x)
-
0.5 M ribose stock solution (MW = 150.13 g/mol)
10 ml PBS or DMEM (w/o FCS, w/o phenol-red)
0.75 g D-ribose
-
0.1 M Sodium bicarbonate (MW = 84.007 g/mol)
4.2 g sodium bicarbonate powder
Add to 500 ml ddH2O
Adjust pH to 9.3
-
0.1% acetic acid
999 ml ddH2O
1 ml acetic acid
-
Cy5-labeled collagen (Table 1):
Calculation example for preparing a spike-in mixture of Cy5-labeled collagen and unlabelled collagen. 2.5% (dry weight) of unlabeled collagen was exchanged with the same amount of labeled collagen.
Soft and stiff collagen matrices (Table 2):Calculation example for preparing a standard 2 mg/ml 3D collagen matrix with embedded cells. Calculations for soft and stiff matrix are shown. Recalculated new collagen concentration after dilution (for example for stiff collagen preparation or labeled collagen, not shown here).
Acknowledgments
Funding for this work was provided by the Medical Research Council (MR/K015664/1). K. Pfisterer was further funded by the Company of Biologists and the Biochemical Society for travel grants to visit the Janelia Research Campus and the FFG Austria. The LLSM imaging experiments were performed at the Advanced Imaging Center at Howard Hughes Medical Institute Janelia Research Campus. The Advanced Imaging Center is a jointly funded venture of the Gordon and Betty Moore Foundation and the Howard Hughes Medical Institute. We would like to acknowledge Henrietta Lacks for HeLa cells.
Competing interests
The authors declare no competing financial interests.
Citation
Readers should cite both the Bio-protocol article and the original research article where this protocol was used.
References
- 1. Abercrombie M.(1980). The Croonian Lecture, 1978-The crawling movement of metazoan cells. Pro Royal Soc B 207(1167): 129-147. [Google Scholar]
- 2. Bodor D. L., Ponisch W., Endres R. G. and Paluch E. K.(2020). Of Cell Shapes and Motion: The Physical Basis of Animal Cell Migration. Dev Cell 52(5): 550-562. [DOI] [PubMed] [Google Scholar]
- 3. Bonnans C., Chou J. and Werb Z.(2014). Remodelling the extracellular matrix in development and disease. Nat Rev Mol Cell Biol 15(12): 786-801. [DOI] [PMC free article] [PubMed] [Google Scholar]
- 4. de Chaumont F., Dallongeville S., Chenouard N., Herve N., Pop S., Provoost T., Meas-Yedid V., Pankajakshan P., Lecomte T., Le Montagner Y., Lagache T., Dufour A. and Olivo-Marin J. C.(2012). Icy: an open bioimage informatics platform for extended reproducible research. Nat Methods 9(7): 690-696. [DOI] [PubMed] [Google Scholar]
- 5. Driscoll M. K., Welf E. S., Jamieson A. R., Dean K. M., Isogai T., Fiolka R. and Danuser G.(2019). Robust and automated detection of subcellular morphological motifs in 3D microscopy images. Nat Methods 16(10): 1037-1044. [DOI] [PMC free article] [PubMed] [Google Scholar]
- 6. Jayo A., Malboubi M., Antoku S., Chang W., Ortiz-Zapater E., Groen C., Pfisterer K., Tootle T., Charras G., Gundersen G. G. and Parsons M.(2016). Fascin Regulates Nuclear Movement and Deformation in Migrating Cells. Dev Cell 38(4): 371-383. [DOI] [PMC free article] [PubMed] [Google Scholar]
- 7. Leithner A., Eichner A., Muller J., Reversat A., Brown M., Schwarz J., Merrin J., de Gorter D. J., Schur F., Bayerl J., de Vries I., Wieser S., Hauschild R., Lai F. P., Moser M., Kerjaschki D., Rottner K., Small J. V., Stradal T. E. and Sixt M.(2016). Diversified actin protrusions promote environmental exploration but are dispensable for locomotion of leukocytes. Nat Cell Biol 18(11): 1253-1259. [DOI] [PubMed] [Google Scholar]
- 8. Mason B. N., Starchenko A., Williams R. M., Bonassar L. J. and Reinhart-King C. A.(2013). Tuning three-dimensional collagen matrix stiffness independently of collagen concentration modulates endothelial cell behavior. Acta Biomater 9(1): 4635-4644. [DOI] [PMC free article] [PubMed] [Google Scholar]
- 9. Pfisterer K., Levitt J., Lawson C. D., Marsh R. J., Heddleston J. M., Wait E., Ameer-Beg S. M., Cox S. and Parsons M.(2020). FMNL2 regulates dynamics of fascin in filopodia. J Cell Biol 219(5). doi: 10.1083/jcb.201906111. [DOI] [PMC free article] [PubMed] [Google Scholar]
- 10. Roy R., Boskey A. and Bonassar L. J.(2010). Processing of type I collagen gels using nonenzymatic glycation. J Biomed Mater Res A 93(3): 843-851. [DOI] [PMC free article] [PubMed] [Google Scholar]
- 11. Schindelin J., Arganda-Carreras I., Frise E., Kaynig V., Longair M., Pietzsch T., Preibisch S., Rueden C., Saalfeld S., Schmid B., Tinevez J. Y., White D. J., Hartenstein V., Eliceiri K., Tomancak P. and Cardona A.(2012). Fiji: an open-source platform for biological-image analysis. Nat Methods 9(7): 676-682. [DOI] [PMC free article] [PubMed] [Google Scholar]
- 12. van Helvert S., Storm C. and Friedl P.(2018). Mechanoreciprocity in cell migration. Nat Cell Biol 20(1): 8-20. [DOI] [PMC free article] [PubMed] [Google Scholar]
- 13. von Chamier L., Jukkala J., Spahn C., Lerche M., Hernández-Pérez S., Mattila P. K., Karinou E., Holden S., Solak A. C., Krull A., Buchholz T.-O., Jug F., Royer L. A., Heilemann M., Laine R. F., Jacquemet G. and Henriques R.(2020). ZeroCostDL4Mic: an open platform to simplify access and use of Deep-Learning in Microscopy. bioRxiv: 2020.03.20.000133.
- 14. Yamada K. M. and Sixt M.(2019). Mechanisms of 3D cell migration. Nat Rev Mol Cell Biol 20(12): 738-752. [DOI] [PubMed] [Google Scholar]


