

This cohort study uses data from the Health and Retirement Study to assess for changes in racial disparities in Alzheimer dementia prevalence and incidence among non-Hispanic Black and White individuals in the US from 2000 to 2016.
Key Points
Question
Did relative racial disparities in dementia prevalence and incidence change in the US between 2000 and 2016?
Findings
In this cohort study examining multiple waves of the Health and Retirement Study, which is designed to recover nationally representative statistics, the prevalence and incidence of dementia in non-Hispanic Black individuals remained substantially higher relative to non-Hispanic White individuals. There was no evidence to suggest either narrowing or widening of relative racial disparities in dementia prevalence or incidence during the follow-up.
Meaning
Additional efforts to identify and address modifiable sources of persistent racial disparities in dementia prevalence in the US are warranted.
Abstract
Importance
In the US, dementia risk is higher in non-Hispanic Black individuals than in non-Hispanic White individuals. To evaluate progress toward reducing such disparities, tracking secular trends in racial disparities in dementia prevalence is essential.
Objective
To examine whether relative racial disparities in dementia prevalence or incidence have changed in the US from 2000 to 2016.
Design, Settings, and Participants
The Health and Retirement Study (HRS) is a nationally representative study of adults 50 years or older. New participants are recruited every 6 years, and study visits occur biennially. Approximately 17 000 to 22 000 respondents have been surveyed at each wave since 2000, achieving response rates of 81% to 89%. Data for this cohort study were obtained from non-Hispanic White and non-Hispanic Black participants aged 70 years and older from the 2000 to 2016 waves. For analyses of secular trends in racial disparities in dementia prevalence, each HRS wave was considered separately (range of participants meeting eligibility criteria in each wave, 6322-7579). For analyses of secular trends in racial disparities in dementia incidence, 7 subcohorts were created (range of participants meeting eligibility criteria in each subcohort, 5322-5961) following up people without dementia for 4 years from subcohort baseline visits in 2000, 2002, 2004, 2006, 2008, 2010, and 2012. Data were analyzed from October 2019 to August 2020.
Exposures
Race based on self-response to closed-ended survey questions.
Main Outcomes and Measures
Dementia status was determined using 3 algorithms with similar sensitivity and specificity across non-Hispanic White and Black participants. Disparities were characterized using ratio measures.
Results
In this study, the mean age and percentage of male participants eligible for inclusion in analyses of racial disparities in dementia prevalence increased over time among non-Hispanic White participants (from 78.2 years and 40% in 2000 to 78.7 years and 44% in 2016) but remained steady in non-Hispanic Black participants during the same period (from 78.0 years and 37% in 2000 to 77.9 years and 38% in 2016). Prevalence ratios comparing Black and White participants ranged from approximately 1.5 to 1.9 across algorithms and years, whereas hazard ratios ranged from approximately 1.4 to 1.8. Although results suggest stable or declining dementia risk overall, there was no evidence suggesting change in relative racial disparities in dementia prevalence or incidence during follow-up.
Conclusions and Relevance
This study did not find evidence to suggest that the ratio of dementia risk across Black and White individuals changed in the US between 2000 and 2016. Additional efforts to identify and mitigate the source of these disparities is warranted.
Introduction
In the US, multiple studies report that the risk of dementia is higher in non-Hispanic Black individuals than in non-Hispanic White individuals.1,2,3 These disparities mirror those in other health domains, which are broadly attributed to the cumulative effects of structural racism4; likewise, structural racism may affect brain health through material, behavioral, and biological mechanisms.5,6,7,8,9 To address this concern, the US National Alzheimer Project Act10 established the National Alzheimer Project to achieve several goals, including to “…decrease disparities in Alzheimer's [sic] disease for racial and ethnic minority populations that are at higher risk for Alzheimer's disease.”11
To evaluate our progress toward this goal, it is essential to examine and track secular trends in racial disparities. To our knowledge, no prior studies have evaluated US national trends in racial/ethnic disparities in dementia incidence. Prior reports on disparities in dementia prevalence suggested no or limited secular trends11,12,13 but relied on algorithms for dementia ascertainment available at the time. These algorithms were subsequently shown to perform inconsistently across racial/ethnic groups,14 which may have masked trends in disparities prevalence. Thus, our objective was to examine whether relative racial disparities in dementia prevalence in the US are widening, narrowing, or remaining stable from 2000 to 2016 using data from the nationally representative US Health and Retirement Study (HRS). To address the limitations of the prior literature, we ascertain dementia status using validated algorithms designed to have similar performance across racial/ethnic groups and examine secular trends in both the relative prevalence and relative incidence of dementia across racial groups.
Methods
Study Sample
This study used data from the HRS, a nationally representative, longitudinal study of US adults aged 50 years or older that began in 1992.15,16 To maintain a steady-state cohort, new participants are enrolled approximately every 6 years. Approximately 17 000 to 22 000 respondents have been surveyed at each wave since 2000, achieving response rates of 81% to 89%.17
From 1998 onward, participants are assessed every 2 years, including proxy interviews for those unable or unwilling to complete the assessment as a self-respondent. Relevant to this analysis, HRS interviews include collection of data on sociodemographic characteristics, cognitive and physical function, health status, and social engagement. Participant race/ethnicity was derived based on participant response to closed-ended survey questions. Here, we consider data from 9 HRS waves spanning 2000 through 2016. We used each wave as its own cross-sectional study to quantify racial disparities in the prevalence of dementia at 2-year intervals from 2000 through 2016 and then combined data from all 9 waves to estimate trends in racial disparities in dementia prevalence over time. We then created subcohorts with 4 years of follow-up (eg, 2000-2004), nested within the larger longitudinal HRS cohort study, to quantify racial disparities in the incidence of dementia over different calendar periods, with baseline years in 2000 to 2012. We then combined data from all subcohorts to examine trends in racial disparities in dementia over time.
Dementia Ascertainment
We determined dementia status for all HRS participants at each wave using 3 previously developed and validated algorithms (the Expert Model, LASSO, and Modified Hurd algorithms) designed for use in HRS-based studies of racial/ethnic disparities in dementia.18 These algorithms predict dementia status based on information about sociodemographic characteristics, physical health, and cognitive health collected at HRS interviews. A more detailed description of these algorithms, including predictors used in each algorithm, is provided in eMethods 1 and 2 in the Supplement. Additional details are published elsewhere.18 Unlike other published algorithms that have been shown to have substantial differences in measurement properties by racial/ethnic group,14 these models were designed to have similar out-of-sample sensitivity and specificity across non-Hispanic White and non-Hispanic Black subgroups.18 All 3 algorithms have been shown empirically to recover consistent estimates of Black-White racial/ethnic differences in dementia prevalence in the subset of HRS participants who also participated in the Aging, Demographics, and Memory Study (ADAMS), an HRS substudy with in-person, study-based dementia ascertainment.18
Statistical Analysis
Data were analyzed from October 2019 to August 2020. All analyses applied the HRS sampling weights to adjust for differential probability of inclusion in the sample, including nonresponse, allowing for the estimation of nationally representative estimates. All analyses account for geographic stratification and clustering when estimating SEs. We repeat all of the analyses using each of the 3 algorithms.
To estimate racial disparities in dementia prevalence across time, we considered data from non-Hispanic Black and non-Hispanic White HRS participants aged 70 years or older at each HRS wave for whom we could assign an algorithmic dementia diagnosis. We used weighted log-binomial regression to estimate crude dementia prevalence ratios across racial groups by HRS wave. Next, we combined all waves of data and ran 2 separate weighted log-binomial regression models. First, we considered a model including a term for year in the combined data to quantify the overall time trend in dementia prevalence estimates. Next, we quantified time trends in the prevalence ratio for the Black/White disparity using a model including terms for year, race, and the interaction between year and race in the combined data. Accounting for geographic stratification and clustering also addresses the issue of nonindependence across waves, resulting in appropriate SEs.19,20 To understand the influence of changing demographics over time, including changes in life expectancy, we repeated our analyses by standardizing all HRS waves to the race-specific distribution of age and sex in the year 2000.
To estimate racial disparities in dementia incidence across time, we created 7 overlapping subcohorts, with baseline at 2000, 2002, 2004, 2006, 2008, 2010, and 2012. Participants were eligible for inclusion in each subcohort if they were non-Hispanic Black or non-Hispanic White, were 70 years or older, and did not have an algorithmic dementia diagnosis in the baseline year. The event of interest was defined as first algorithmic dementia diagnosis, and we censored all participants without a diagnosis at the end of 2 waves of follow-up. We quantified the relative incidence across non-Hispanic Black and non-Hispanic White participants in each subcohort using weighted Cox proportional hazards regression models. We then combined data from all subcohorts to estimate the overall time trend and quantify time trends in the racial disparity in dementia incidence across the 6 subcohorts using models parallel to those described previously. Accounting for geographic stratification and clustering also addresses the issue of nonindependence of estimates induced by inclusion of participants in more than 1 subcohort.19,20 To understand the influence of changing demographics over time, including changes in life expectancy, we repeated these analyses standardizing to the race-specific distribution of age and sex in the year 2000 in order to examine trends in racial disparities of dementia incidence independent of changing demographics.
Informed consent was provided by HRS and ADAMS participants at data collection. This research was approved by the George Washington University Institutional Review Board. All analyses were completed using SAS, version 9.4 (SAS Institute Inc) or Stata, version 15.1 (StataCorp LLC). We report 2-sided P values and 95% CIs throughout. P < .05 was considered to be statistically significant.
Results
The number HRS participants eligible for inclusion in analyses examining dementia prevalence at each HRS wave ranged from 6322 to 7579. Table 1 provides weighted characteristics, by race, of HRS participants eligible for inclusion in analyses examining dementia prevalence. On average, non-Hispanic Black participants were younger, were less likely to be men, had lower educational attainment, and were more likely to report physician-diagnosed hypertension and diabetes than non-Hispanic White participants. The mean age and percentage of male participants increased over time in non-Hispanic White participants (from 78.2 years and 40% in 2000 to 78.7 years and 44% in 2016) but remained steady in non-Hispanic Black participants during the same period (from 78.0 years and 37% in 2000 to 77.9 years and 38% in 2016). Increases in education over time were especially marked among non-Hispanic Black participants, from 64% with less than a high school education in 2000 to only 33% with less than a high school education in 2016. The prevalence of self-reported, physician-diagnosed hypertension (from 55% in 2000 to 67% in 2016 among non-Hispanic White participants and from 71% in 2000 to 83% in 2016 among non-Hispanic Black participants) and diabetes (from 15% in 2000 to 24% in 2016 among non-Hispanic White participants and from 23% in 2000 to 42% in 2016 among non-Hispanic Black participants) increased over time in both groups. On average, across all years, 20% of participants were classified as having dementia by the Expert Model and LASSO algorithms, whereas 18% were classified has having dementia using the Modified Hurd algorithm.
Table 1. Weighted Characteristics of Eligible HRS Participants by HRS Interview Wave Used to Estimate Trends in Dementia Prevalencea.
| Characteristic | 2000 | 2002 | 2004 | 2006 | 2008 | 2010 | 2012 | 2014 | 2016 |
|---|---|---|---|---|---|---|---|---|---|
| Non-Hispanic White | |||||||||
| No. (unweighted) | 5994 | 6024 | 6068 | 6205 | 6334 | 6446 | 6435 | 6026 | 5309 |
| Age, y | 78.2 | 78.3 | 78.3 | 78.7 | 78.8 | 78.8 | 78.7 | 78.6 | 78.7 |
| Male, % | 40 | 40 | 41 | 41 | 41 | 42 | 43 | 43 | 44 |
| <High school, % | 28 | 25 | 23 | 21 | 19 | 17 | 16 | 14 | 12 |
| High school or GED, % | 53 | 54 | 56 | 56 | 57 | 58 | 57 | 57 | 56 |
| >High school, % | 19 | 21 | 21 | 23 | 24 | 26 | 27 | 29 | 32 |
| Diagnosed hypertension, % | 55 | 59 | 61 | 63 | 66 | 67 | 68 | 68 | 67 |
| Diagnosed diabetes, % | 15 | 16 | 17 | 19 | 20 | 23 | 23 | 24 | 24 |
| Proxy respondent, % | 12 | 12 | 10 | 8 | 8 | 9 | 7 | 7 | 8 |
| Non-Hispanic Black | |||||||||
| No. (unweighted) | 845 | 851 | 878 | 966 | 1045 | 1133 | 1132 | 1082 | 1013 |
| Age, y | 78.0 | 77.8 | 77.9 | 77.7 | 77.9 | 78.0 | 78.0 | 78.0 | 77.9 |
| Male, % | 37 | 37 | 37 | 37 | 36 | 37 | 38 | 38 | 38 |
| <High school, % | 64 | 59 | 56 | 52 | 48 | 43 | 40 | 36 | 33 |
| High school or GED, % | 29 | 32 | 35 | 38 | 41 | 45 | 46 | 48 | 49 |
| >High school, % | 7 | 9 | 9 | 10 | 12 | 12 | 14 | 15 | 17 |
| Diagnosed hypertension, % | 71 | 71 | 75 | 79 | 80 | 82 | 82 | 85 | 83 |
| Diagnosed diabetes, % | 23 | 26 | 29 | 33 | 33 | 34 | 36 | 38 | 42 |
| Proxy respondent, % | 21 | 19 | 18 | 13 | 12 | 13 | 13 | 11 | 11 |
Abbreviations: GED, General Education Development; HRS, Health and Retirement Study.
Eligible for inclusion in analyses using the Expert Model algorithm for dementia ascertainment. Data are presented as percentages unless otherwise indicated.
Across all algorithms, non-Hispanic Black participants had an approximately 1.5 to 1.9 times higher prevalence of dementia compared with non-Hispanic White participants in all waves from 2000 to 2016 in both crude and standardized estimates (Figure 1 and eTable 1 in the Supplement). Although overall dementia prevalence declined with time in both crude and standardized analyses (Table 2), relative dementia prevalence across non-Hispanic Black and non-Hispanic White participants did not change substantially over time (Figure 1 and eTable 1 in the Supplement). Although point estimates suggested a slight decline in the crude prevalence ratio comparing non-Hispanic Black with non-Hispanic White participants in later years, there was limited statistical support for changing relative dementia prevalence with time. After age and sex standardization, there was no evidence of a shrinking racial disparity over time (Figure 1 and eTable 1 in the Supplement).
Figure 1. Relative Prevalence of Dementia Across Non-Hispanic Black and White Individuals in the US by Year, 2000 to 2016.
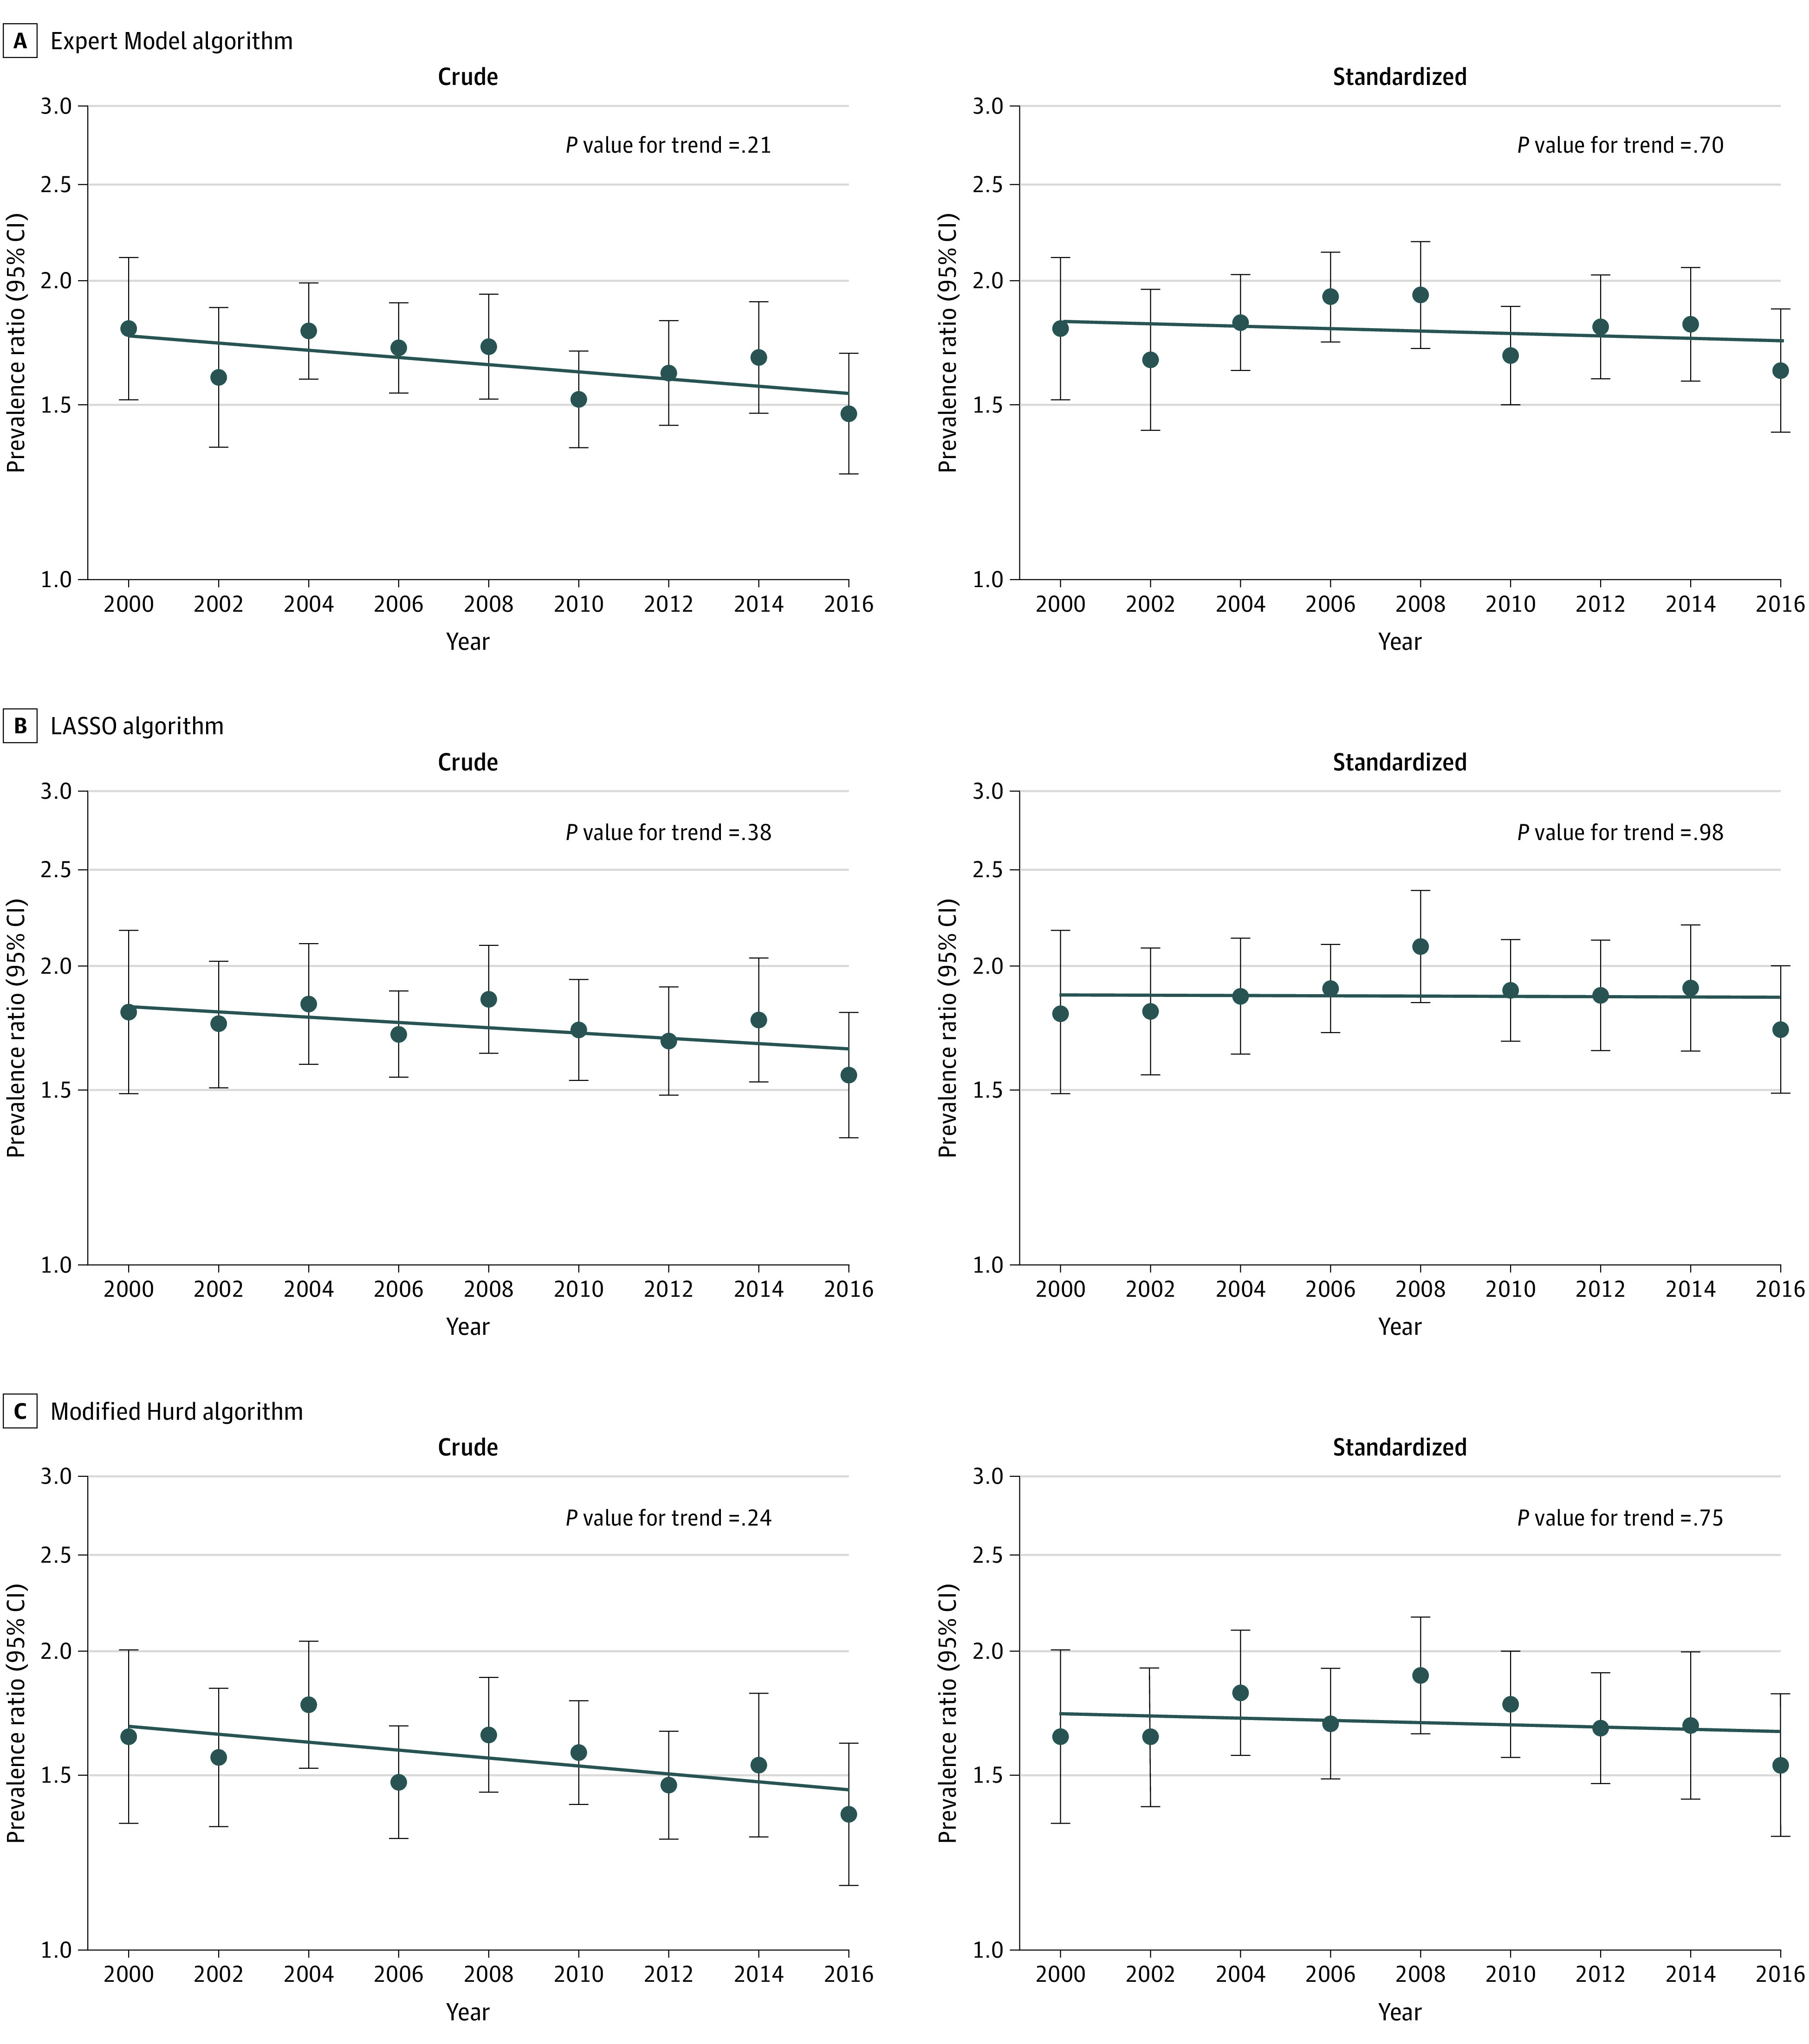
A, Expert Model algorithm; B, LASSO algorithm; and C, Modified Hurd algorithm. Each panel represents a set of analyses using a different algorithmic approach to ascertain dementia. Within each panel, the figure on the left represents crude analyses, and the figure on the right represents standardized analyses. Dots and error bars within each panel represent the prevalence ratio and associated 95% CI in each year comparing the prevalence of dementia in non-Hispanic Black participants to the prevalence of dementia in non-Hispanic White participants, where non-Hispanic White participants are the reference group (eg, in the top left panel, the first dot on the left represents the prevalence ratio in 2000). The line plotted across years represents the trend in relative differences in dementia prevalence across racial groups (ie, the trend over time in these prevalence ratios). The P value for trend tests whether the observed trend is significantly different from the null hypothesis of no trend. All analyses are weighted using Health and Retirement Study sampling weights and account for geographical stratification and clustering when estimating standard errors. Standardized analyses are standardized to the race-specific age and sex distribution in the year 2000.
Table 2. Time Trends in Dementia Prevalence and Incidence in the United States, 2000-2016a.
| Variable | PR per decade (95% CI)b | HR per decade (95% CI)c | ||
|---|---|---|---|---|
| Crude | Standardized | Crude | Standardized | |
| Expert Model algorithm | 0.96 (0.91-1.03) | 0.92 (0.87-0.99) | 1.01 (0.92-1.09) | 0.97 (0.89-1.05) |
| P value | .25 | .02 | .89 | .43 |
| LASSO algorithm | 0.94 (0.88-1.00) | 0.90 (0.84-0.96) | 0.92 (0.83-1.02) | 0.88 (0.79-0.97) |
| P value | .048 | .002 | .10 | .01 |
| Modified Hurd algorithm | 0.93 (0.87-0.99) | 0.88 (0.83-0.94) | 0.98 (0.89-1.07) | 0.93 (0.85-1.03) |
| P value | .03 | <.001 | .65 | .15 |
Abbreviations: HR, hazard ratio; LASSO, least absolute shrinkage and selection operator; PR, prevalence ratio.
All analyses are weighted using Health and Retirement Study sampling weights and account for geographical stratification and clustering when estimating standard errors. Standardized analyses are standardized to the race-specific age and sex distribution in the year 2000.
PR can be interpreted as the relative prevalence in dementia for 2 time points, 10 years apart, within the period of 2000 to 2016.
HR can be interpreted as the relative incidence in dementia across 2 subcohorts, 10 years apart, within the period of 2000 to 2012.
The number of eligible participants included in each subcohort used for analyses examining dementia incidence ranged from 5322 to 5961. Table 3 provides weighted characteristics of HRS participants by race and subcohort. Non-Hispanic Black participants were younger, more likely to be women, had lower educational attainment, and had higher prevalence of hypertension and diabetes than non-Hispanic White participants. On average, across all subcohorts, crude dementia incidence was approximately 6.3 cases per 100 person-years when using the Expert Model algorithm to classify dementia status, 5.5 cases per 100 person-years when using the LASSO algorithm, and 5.2 cases per 100 person-years when using the Modified Hurd algorithm.
Table 3. Weighted Baseline Characteristics of Eligible HRS Participants by HRS Subcohorts Used to Estimate Trends in Dementia Incidencea.
| Characteristic | 2000 | 2002 | 2004 | 2006 | 2008 | 2010 | 2012 |
|---|---|---|---|---|---|---|---|
| Non-Hispanic White | |||||||
| No. (unweighted) | 4806 | 4812 | 4861 | 5064 | 5192 | 5090 | 5150 |
| Age, y | 76.8 | 76.9 | 77.0 | 77.4 | 77.5 | 77.2 | 77.2 |
| Male sex, % | 42 | 42 | 43 | 43 | 42 | 44 | 44 |
| <High school, % | 24 | 22 | 20 | 18 | 16 | 14 | 13 |
| High school or GED, % | 56 | 55 | 57 | 57 | 58 | 58 | 58 |
| >High school, % | 21 | 23 | 24 | 25 | 26 | 28 | 29 |
| Hypertension, % | 55 | 59 | 60 | 63 | 66 | 67 | 67 |
| Diabetes, % | 14 | 16 | 16 | 19 | 20 | 22 | 22 |
| Proxy respondent, % | 4 | 4 | 3 | 2 | 2 | 3 | 2 |
| Follow-up time, y | 3.2 | 3.2 | 3.3 | 3.2 | 3.1 | 3.3 | 3.1 |
| Non-Hispanic Black | |||||||
| No. (unweighted) | 516 | 557 | 579 | 657 | 736 | 803 | 811 |
| Age, y | 76.0 | 75.8 | 75.9 | 75.8 | 76.0 | 75.8 | 75.8 |
| Male sex, % | 39 | 40 | 40 | 39 | 40 | 41 | 39 |
| <High school, % | 61 | 55 | 52 | 47 | 43 | 40 | 36 |
| High school or GED, % | 30 | 34 | 38 | 41 | 43 | 45 | 47 |
| >High school, % | 9 | 10 | 10 | 12 | 14 | 15 | 17 |
| Hypertension, % | 68 | 70 | 76 | 79 | 81 | 81 | 82 |
| Diabetes, % | 21 | 24 | 28 | 30 | 30 | 34 | 35 |
| Proxy respondent, % | 5 | 5 | 6 | 3 | 3 | 3 | 2 |
| Follow-up time, y | 3.0 | 3.1 | 3.2 | 3.2 | 3.0 | 3.1 | 3.1 |
Abbreviations: GED, General Education Development; HRS, Health and Retirement Study
Eligible for inclusion in analyses using the Expert Model algorithm for dementia ascertainment. Data are presented as weighted percentages unless otherwise indicated.
Across all algorithms, non-Hispanic Black participants had an approximately 1.4 to 1.8 times higher incidence of dementia in comparison with non-Hispanic White participants across all subcohorts (Figure 2 and eTable 2 in the Supplement). Analyses quantifying overall time trends in dementia incidence were mixed (Table 2). Analyses using the Expert Model or Modified Hurd algorithms to ascertain dementia status suggested no change over time, whereas analyses using the LASSO model suggested declining dementia incidence with time only in age- and sex-standardized analyses. However, regardless of algorithm used, there was no evidence of changing relative dementia incidence across racial groups over time in crude or age- and sex-standardized analyses (Figure 2 and eTable 2 in the Supplement).
Figure 2. Relative Incidence of Dementia Across Non-Hispanic Black and White Individuals in the US by Year, 2000 to 2016.
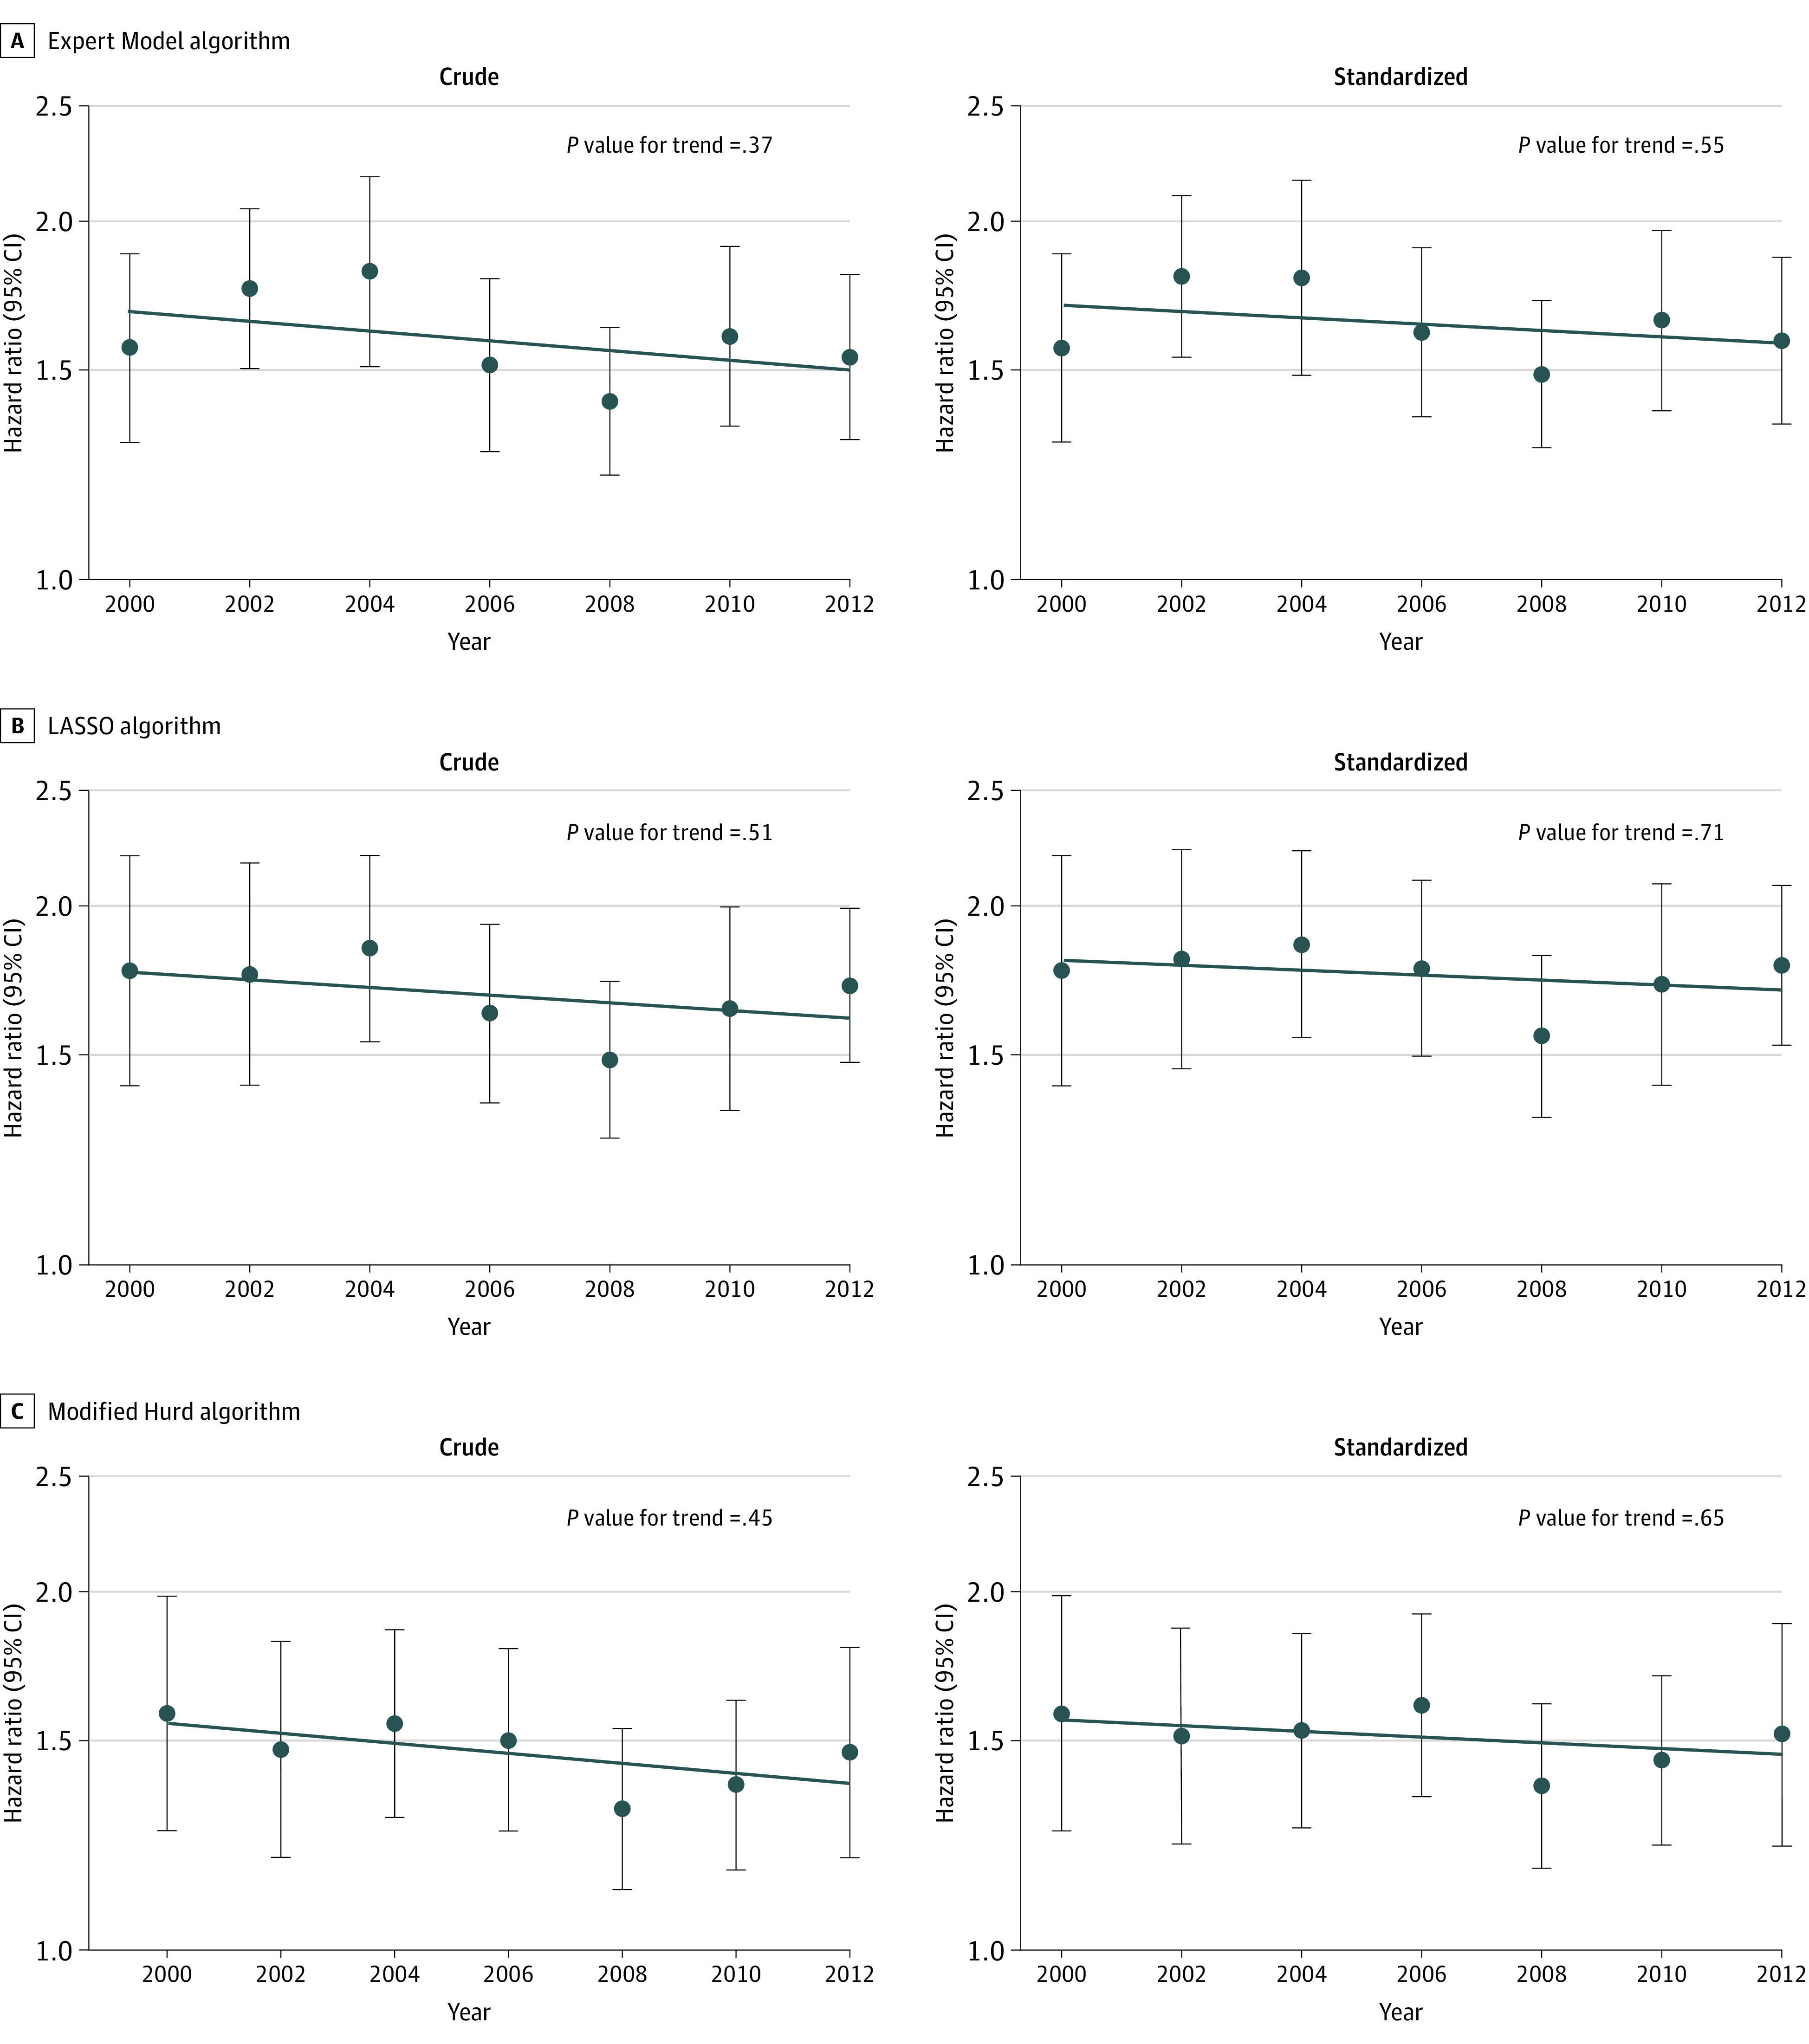
A, Expert Model algorithm; B, LASSO algorithm; and C, Modified Hurd algorithm. Each panel represents a set of analyses using a different algorithmic approach to ascertain dementia. Within each panel, the figure on the left represents crude analyses, and the figure on the right represents standardized analyses. Dots and error bars within each panel represent the hazard ratio (HR) and associated 95% CI in each subcohort (identified by its baseline year) comparing the incidence of dementia in non-Hispanic Black participants to the incidence of dementia in non-Hispanic White participants, where non-Hispanic White participants are the reference group (eg, in the top left panel, the first dot on the left represents the HR for the 2000-2006 subcohort). The line plotted across years represents the trend in relative differences in dementia incidence across racial groups (ie, the trend over time in these HRs). The P value for trend tests whether the observed trend is significantly different from the null hypothesis of no trend. All analyses are weighted using Health and Retirement Study sampling weights and account for geographical stratification and clustering when estimating standard errors. Standardized analyses are standardized to the race-specific age and sex distribution in the year 2000.
Discussion
This study found that the prevalence and incidence of dementia remained substantially higher in non-Hispanic Black individuals compared with non-Hispanic White individuals in the US from 2000 to 2016. Although we observed declining dementia prevalence and stable or declining dementia incidence overall, we found no evidence of shrinking relative racial disparities in dementia prevalence or incidence in adults 70 years or older in the US between 2000 and 2016.
These results are consistent with related reports in the HRS considering time trends in the prevalence of cognitive impairment across racial/ethnic groups using an alternate algorithm to identify cognitive impairment, the Langa-Kabeto-Weir algorithm,21 in either a younger sample or an earlier epoch. In community-dwelling, noninstitutionalized adults aged 55 to 69 years, there were substantial racial/ethnic disparities in the prevalence of Langa-Kabeto-Weir algorithm–defined cognitive limitation each year from 1998 to 2014, but there was no significant difference in time trends between non-Hispanic White, non-Hispanic Black, and Hispanic participants.11 Similarly, the relative prevalence of Langa-Kabeto-Weir algorithm–defined dementia across White, Black, and Hispanic persons 65 years and older remained unchanged when comparing data from 2000 and 2012 only12 and when using all available waves of HRS data from 2000 to 2012.13 Our work advances from previous findings by adding new waves of data, focusing on dementia incidence as well as prevalence in people 70 years and older, and, most importantly, applying recently developed algorithms validated to have similar sensitivity and specificity for non-Hispanic Black and White individuals.
These findings also expand our understanding of racial/ethnic disparities in dementia because, to our knowledge, previous studies reporting on the incidence of dementia by racial/ethnic groups rarely report on secular trends in the relative risk of dementia by race/ethnicity. For example, prior work in the National Health and Aging Trends Study reported declining prevalence and stable incidence from 2011 to 2015 in algorithmically defined dementia in both non-Hispanic Black and non-Hispanic White participants but did not directly quantify the trend in racial disparity over time.22 Similarly, in data from the Washington Heights Inwood Columbia Aging Project, incidence rates declined most in Black participants across the 1992 and 1999 cohorts, followed by non-Hispanic White and Hispanic participants; however, whether this decline substantially altered the relative disparity in dementia risk across racial/ethnic groups was not reported.23
Although the overall number of people affected by dementia is expected to increase dramatically in coming years due to the aging of the global population,24,25 studies have reported stable or declining age-specific incidence and prevalence of dementia in multiple countries, including the US.2,26,27,28,29,30 Our study corroborates these prior findings in a nationally representative sample of White and Black individuals in the US. We saw evidence of declining overall dementia prevalence regardless of algorithm choice and mixed evidence suggesting either stable or declining dementia incidence. As there are no disease-modifying treatments for the most common forms of dementia and accounting for demographic shifts (eg, changing life expectancy) does not affect these findings, overall declines in population-level dementia risk must be attributable to changing risk factor exposures. Others suggest that educational attainment and declining vascular risk factor burden may partially explain these trends.27,31 Further work to understand what is driving these trends is needed, as it may provide needed insight into how to effectively prevent or delay dementia.
Racial disparities in late-life cognition and, thus, time trends in racial disparities are most likely determined by a complex interrelationship and interaction of factors across the life course.5,6,7,8,9 For example, structural racism4—which manifests as interrelated factors as diverse as vascular risk factor burden,6 educational attainment and quality,32,33 and stressors such as personal experience of racism and discrimination8,34—may individually and collectively contribute to the observed racial disparities in dementia we observe here. Furthermore, the specific experience of Black people in the US has changed with time. Careful examination of how disparities in dementia risk arise and evolve is needed if we are to achieve the stated national goal of reducing or eliminating racial disparities in dementia prevalence.10 Such work will need to consider how both modifiable and nonmodifiable risk factors may interact to either amplify or offset outcomes regarding disparities in dementia risk while explicitly recognizing the social processes that influence disparities and how these have changed with time.
Several studies have focused on quantifying the degree to which various factors mediate racial disparities in cognitive health and provide some insight into factors that may contribute to the relative disparities and lack of trends in relative disparities over time observed here. For example, in a sample of non-Hispanic Black and White participants of the National Survey of Midlife Development in the US (MIDUS), education, income, chronic health conditions, and levels of external locus of control simultaneously mediated associations between race and cognition in younger, middle-aged, and older adults but did not fully account for racial differences in cognitive performance for any age group.35 Data from the Health, Aging, and Body Composition Study (Health ABC) suggest racial differences in dementia incidence can be largely attributed to differences in socioeconomic status, quantified using measures of education, literacy, family income, and financial inadequacy.36 Other analyses also implicate educational attainment, educational quality, and literacy,37 as well as health literacy38 and depression,39 as mechanisms that partially mediate racial disparities in cognitive health.
We focus on relative differences in incidence and prevalence. Within the context of stable or declining dementia risk, consideration of time trends in relative measures of disparities allows us to answer the crucial question of whether we are achieving the goal of reducing dementia risk faster in the group with the greatest risk, which here is non-Hispanic Black Americans.40 Our results suggest this is not the case. However, the combination of stable relative dementia prevalence across racial groups and declining overall dementia prevalence implies that the difference in absolute dementia prevalence across racial groups may be shrinking with time due to declining prevalence in all groups. Nevertheless, in the context of an overall decline in dementia risk, and assuming some baseline level of risk will remain regardless of future public health and medical interventions, we will never approach or achieve parity in the prevalence and incidence of dementia without shrinking relative disparities.
Strengths and Limitations
Our study has several strengths. First, we relied on 3 validated algorithms for ascertaining dementia specifically designed for the purpose of racial/ethnic disparities research. These algorithms have similar sensitivity and specificity across racial/ethnic groups,18 and we have previously demonstrated that estimates of racial/ethnic disparities in dementia prevalence using these algorithms are consistent with those obtained using the criterion standard in-person, study-based assessment in a subsample of HRS participants.18 Second, the HRS is a nationally representative sample. As such, this work can be used as a national benchmark against which to evaluate future efforts to reduce racial disparities in dementia prevalence at either the local or national scale. Third, we used data from multiple points over 16 years to estimate secular trends. As evident in our work and the work of others,2 estimates of dementia prevalence and incidence vary from year to year. Consideration of multiple time points is necessary to avoid spurious findings of secular trends that may arise when considering fewer points.
The study also has some limitations. Use of an algorithm to ascertain dementia undeniably misclassifies some participants. However, this is true of any simple measure appropriate for ascertaining information on health status in large samples. We therefore prioritized using algorithms that were explicitly designed to have similar performance across racial/ethnic groups. As such, we expect nondifferential misclassification of dementia, suggesting our findings of substantial racial disparities are likely conservative. We assume that our dementia ascertainment algorithms perform similarly over time. Given the relatively short span of years, we believe this to be a reasonable assumption. We were unable to consider other racial/ethnic groups or consider effect modification by sex or other factors given concerns about statistical power. Finally, our report focuses on the prevalence and incidence of the clinical syndrome of dementia. Although this focus remains the most relevant outcome to patients and caregivers, the field has moved toward biomarker-based diagnoses of Alzheimer disease and other forms of dementia.41,42 As brain pathology burden and clinical symptoms do not always align,43,44 our findings may not reflect trends in disparities in prevalence and incidence of biomarker-based preclinical and clinical Alzheimer disease.
Conclusions
These study findings suggest that the prevalence and incidence of dementia remain substantially higher in non-Hispanic Black individuals compared with non-Hispanic White individuals in the US. Although our findings suggest stable or declining dementia risk overall, we found no evidence to suggest that relative racial disparities in dementia risk have narrowed between 2000 and 2016. Additional efforts to identify and mitigate factors contributing to these disparities is warranted. Efforts to improve our capability to quantify and track dementia risk overall and by key sociodemographic groups are also needed. Such efforts would improve our ability to target interventions and track progress toward reducing both overall dementia risk and disparities in dementia risk.
eMethods 1. Description of Algorithms
eMethods 2. Summary of Predictors in Dementia-Prediction Models
eTable 1. Relative Prevalence of Dementia Across Non-Hispanic Black and White Americans in the United States, 2000-2016
eTable 2. Relative Incidence of Dementia Across Non-Hispanic Black and White Americans in the United States, 2000-2016
References
- 1.Fitzpatrick AL, Kuller LH, Ives DG, et al. Incidence and prevalence of dementia in the Cardiovascular Health Study. J Am Geriatr Soc. 2004;52(2):195-204. doi: 10.1111/j.1532-5415.2004.52058.x [DOI] [PubMed] [Google Scholar]
- 2.Rajan KB, Weuve J, Barnes LL, Wilson RS, Evans DA. Prevalence and incidence of clinically diagnosed Alzheimer’s disease dementia from 1994 to 2012 in a population study. Alzheimers Dement. 2019;15(1):1-7. doi: 10.1016/j.jalz.2018.07.216 [DOI] [PMC free article] [PubMed] [Google Scholar]
- 3.Steenland K, Goldstein FC, Levey A, Wharton W. A meta-analysis of Alzheimer’s disease incidence and prevalence comparing African-Americans and Caucasians. J Alzheimers Dis. 2016;50(1):71-76. doi: 10.3233/JAD-150778 [DOI] [PMC free article] [PubMed] [Google Scholar]
- 4.Williams DR, Lawrence JA, Davis BA. Racism and health: evidence and needed research. Annu Rev Public Health. 2019;40:105-125. doi: 10.1146/annurev-publhealth-040218-043750 [DOI] [PMC free article] [PubMed] [Google Scholar]
- 5.Hill CV, Pérez-Stable EJ, Anderson NA, Bernard MA. The National Institute on Aging health disparities research framework. Ethn Dis. 2015;25(3):245-254. doi: 10.18865/ed.25.3.245 [DOI] [PMC free article] [PubMed] [Google Scholar]
- 6.Brewster P, Barnes L, Haan M, et al. Progress and future challenges in aging and diversity research in the United States. Alzheimers Dement. 2019;15(7):995-1003. doi: 10.1016/j.jalz.2018.07.221 [DOI] [PMC free article] [PubMed] [Google Scholar]
- 7.Krieger N, Alegría M, Almeida-Filho N, et al. Who, and what, causes health inequities? reflections on emerging debates from an exploratory Latin American/North American workshop. J Epidemiol Community Health. 2010;64(9):747-749. doi: 10.1136/jech.2009.106906 [DOI] [PubMed] [Google Scholar]
- 8.Glymour MM, Manly JJ. Lifecourse social conditions and racial and ethnic patterns of cognitive aging. Neuropsychol Rev. 2008;18(3):223-254. doi: 10.1007/s11065-008-9064-z [DOI] [PubMed] [Google Scholar]
- 9.Williams DR, Sternthal M. Understanding racial-ethnic disparities in health: sociological contributions. J Health Soc Behav. 2010;51(suppl):S15-S27. doi: 10.1177/0022146510383838 [DOI] [PMC free article] [PubMed] [Google Scholar]
- 10.National Alzheimer’s Project Act, 42 USC §11225 (2011).
- 11.Choi H, Schoeni RF, Martin LG, Langa KM. Trends in the prevalence and disparity in cognitive limitations of Americans 55-69 years old. J Gerontol B Psychol Sci Soc Sci. 2018;73(suppl_1):S29-S37. doi: 10.1093/geronb/gbx155 [DOI] [PMC free article] [PubMed] [Google Scholar]
- 12.Langa KM, Larson EB, Crimmins EM, et al. A comparison of the prevalence of dementia in the United States in 2000 and 2012. JAMA Intern Med. 2017;177(1):51-58. doi: 10.1001/jamainternmed.2016.6807 [DOI] [PMC free article] [PubMed] [Google Scholar]
- 13.Chen C, Zissimopoulos JM. Racial and ethnic differences in trends in dementia prevalence and risk factors in the United States. Alzheimers Dement (N Y). 2018;4:510-520. doi: 10.1016/j.trci.2018.08.009 [DOI] [PMC free article] [PubMed] [Google Scholar]
- 14.Gianattasio KZ, Wu Q, Glymour MM, Power MC. Comparison of methods for algorithmic classification of dementia status in the Health and Retirement Study. Epidemiology. 2019;30(2):291-302. doi: 10.1097/EDE.0000000000000945 [DOI] [PMC free article] [PubMed] [Google Scholar]
- 15.Sonnega A, Faul JD, Ofstedal MB, Langa KM, Phillips JW, Weir DR. Cohort profile: the Health and Retirement Study (HRS). Int J Epidemiol. 2014;43(2):576-585. doi: 10.1093/ije/dyu067 [DOI] [PMC free article] [PubMed] [Google Scholar]
- 16.Health and Retirement Study. Produced and distributed by the University of Michigan with Funding from the National Institute on Aging (grant number U01AG009740). Data and documentation are available at https://hrsonline.isr.umich.edu/
- 17.Health and Retirement Study . Sample Sizes and Response Rates. University of Michigan; 2017. [Google Scholar]
- 18.Gianattasio KZ, Ciarleglio A, Power MC. Development of algorithmic dementia ascertainment for racial/ethnic disparities research in the US Health and Retirement Study. Epidemiology. 2020;31(1):126-133. doi: 10.1097/EDE.0000000000001101 [DOI] [PMC free article] [PubMed] [Google Scholar]
- 19.Agency for Health Care Research and Quality . Accounting for clustering in the analysis of MEPS data: frequently asked questions (FAQ). Accessed August 5, 2019. https://meps.ahrq.gov/survey_comp/hc_clustering_faq.pdf
- 20.Williams RL. A note on robust variance estimation for cluster-correlated data. Biometrics. 2000;56(2):645-646. doi: 10.1111/j.0006-341X.2000.00645.x [DOI] [PubMed] [Google Scholar]
- 21.Crimmins EM, Kim JK, Langa KM, Weir DR. Assessment of cognition using surveys and neuropsychological assessment: the Health and Retirement Study and the Aging, Demographics, and Memory Study. J Gerontol B Psychol Sci Soc Sci. 2011;66(suppl 1):i162-i171. doi: 10.1093/geronb/gbr048 [DOI] [PMC free article] [PubMed] [Google Scholar]
- 22.Freedman VA, Kasper JD, Spillman BC, Plassman BL. Short-term changes in the prevalence of probable dementia: an analysis of the 2011-2015 National Health and Aging Trends Study. J Gerontol B Psychol Sci Soc Sci. 2018;73(suppl_1):S48-S56. doi: 10.1093/geronb/gbx144 [DOI] [PMC free article] [PubMed] [Google Scholar]
- 23.Noble JM, Schupf N, Manly JJ, Andrews H, Tang MX, Mayeux R. Secular trends in the incidence of dementia in a multi-ethnic community. J Alzheimers Dis. 2017;60(3):1065-1075. doi: 10.3233/JAD-170300 [DOI] [PMC free article] [PubMed] [Google Scholar]
- 24.Weuve J, Hebert LE, Scherr PA, Evans DA. Deaths in the United States among persons with Alzheimer’s disease (2010-2050). Alzheimers Dement. 2014;10(2):e40-e46. doi: 10.1016/j.jalz.2014.01.004 [DOI] [PMC free article] [PubMed] [Google Scholar]
- 25.Prince M, Bryce R, Albanese E, Wimo A, Ribeiro W, Ferri CP. The global prevalence of dementia: a systematic review and metaanalysis. Alzheimers Dement. 2013;9(1):63-75.e2. doi: 10.1016/j.jalz.2012.11.007 [DOI] [PubMed] [Google Scholar]
- 26.Satizabal CL, Beiser AS, Chouraki V, Chêne G, Dufouil C, Seshadri S. Incidence of dementia over three decades in the Framingham Heart Study. N Engl J Med. 2016;374(6):523-532. doi: 10.1056/NEJMoa1504327 [DOI] [PMC free article] [PubMed] [Google Scholar]
- 27.Wu YT, Beiser AS, Breteler MMB, et al. The changing prevalence and incidence of dementia over time—current evidence. Nat Rev Neurol. 2017;13(6):327-339. doi: 10.1038/nrneurol.2017.63 [DOI] [PubMed] [Google Scholar]
- 28.Prince M, Ali GC, Guerchet M, Prina AM, Albanese E, Wu YT. Recent global trends in the prevalence and incidence of dementia, and survival with dementia. Alzheimers Res Ther. 2016;8(1):23. doi: 10.1186/s13195-016-0188-8 [DOI] [PMC free article] [PubMed] [Google Scholar]
- 29.Stephan BCM, Birdi R, Tang EYH, et al. Secular trends in dementia prevalence and incidence worldwide: a systematic review. J Alzheimers Dis. 2018;66(2):653-680. doi: 10.3233/JAD-180375 [DOI] [PubMed] [Google Scholar]
- 30.Wolters FJ, Chibnik LB, Waziry R, et al. Twenty-seven-year time trends in dementia incidence in Europe and the United States: the Alzheimer Cohorts Consortium. Neurology. 2020;95(5):e519-e531. doi: 10.1212/WNL.0000000000010022 [DOI] [PMC free article] [PubMed] [Google Scholar]
- 31.Pase MP, Satizabal CL, Seshadri S. Role of improved vascular health in the declining incidence of dementia. Stroke. 2017;48(7):2013-2020. doi: 10.1161/STROKEAHA.117.013369 [DOI] [PMC free article] [PubMed] [Google Scholar]
- 32.Sisco S, Gross AL, Shih RA, et al. The role of early-life educational quality and literacy in explaining racial disparities in cognition in late life. J Gerontol B Psychol Sci Soc Sci. 2015;70(4):557-567. doi: 10.1093/geronb/gbt133 [DOI] [PMC free article] [PubMed] [Google Scholar]
- 33.Liu SY, Glymour MM, Zahodne LB, Weiss C, Manly JJ. Role of place in explaining racial heterogeneity in cognitive outcomes among older adults. J Int Neuropsychol Soc. 2015;21(9):677-687. doi: 10.1017/S1355617715000806 [DOI] [PMC free article] [PubMed] [Google Scholar]
- 34.Williams DR, Lawrence JA, Davis BA, Vu C. Understanding how discrimination can affect health. Health Serv Res. 2019;54(suppl 2):1374-1388. doi: 10.1111/1475-6773.13222 [DOI] [PMC free article] [PubMed] [Google Scholar]
- 35.Zahodne LB, Manly JJ, Smith J, Seeman T, Lachman ME. Socioeconomic, health, and psychosocial mediators of racial disparities in cognition in early, middle, and late adulthood. Psychol Aging. 2017;32(2):118-130. doi: 10.1037/pag0000154 [DOI] [PMC free article] [PubMed] [Google Scholar]
- 36.Yaffe K, Falvey C, Harris TB, et al. ; Health ABC Study . Effect of socioeconomic disparities on incidence of dementia among biracial older adults: prospective study. BMJ. 2013;347:f7051. doi: 10.1136/bmj.f7051 [DOI] [PMC free article] [PubMed] [Google Scholar]
- 37.Sachs-Ericsson N, Blazer DG. Racial differences in cognitive decline in a sample of community-dwelling older adults: the mediating role of education and literacy. Am J Geriatr Psychiatry. 2005;13(11):968-975. doi: 10.1176/appi.ajgp.13.11.968 [DOI] [PubMed] [Google Scholar]
- 38.Gupta VK, Winter M, Cabral H, et al. Disparities in age-associated cognitive decline between African-American and Caucasian populations: the roles of health literacy and education. J Am Geriatr Soc. 2016;64(8):1716-1723. doi: 10.1111/jgs.14257 [DOI] [PubMed] [Google Scholar]
- 39.Zahodne LB, Sol K, Kraal Z. Psychosocial pathways to racial/ethnic inequalities in late-life memory trajectories. J Gerontol B Psychol Sci Soc Sci. 2019;74(3):409-418. doi: 10.1093/geronb.gbx113 [DOI] [PMC free article] [PubMed] [Google Scholar]
- 40.Low A, Low A. Importance of relative measures in policy on health inequalities. BMJ. 2006;332(7547):967-969. doi: 10.1136/bmj.332.7547.967 [DOI] [PMC free article] [PubMed] [Google Scholar]
- 41.Sperling RA, Aisen PS, Beckett LA, et al. Toward defining the preclinical stages of Alzheimer’s disease: recommendations from the National Institute on Aging-Alzheimer’s Association workgroups on diagnostic guidelines for Alzheimer’s disease. Alzheimers Dement. 2011;7(3):280-292. doi: 10.1016/j.jalz.2011.03.003 [DOI] [PMC free article] [PubMed] [Google Scholar]
- 42.McKhann GM, Knopman DS, Chertkow H, et al. The diagnosis of dementia due to Alzheimer’s disease: recommendations from the National Institute on Aging-Alzheimer’s Association workgroups on diagnostic guidelines for Alzheimer’s disease. Alzheimers Dement. 2011;7(3):263-269. doi: 10.1016/j.jalz.2011.03.005 [DOI] [PMC free article] [PubMed] [Google Scholar]
- 43.Schneider JA, Arvanitakis Z, Bang W, Bennett DA. Mixed brain pathologies account for most dementia cases in community-dwelling older persons. Neurology. 2007;69(24):2197-2204. doi: 10.1212/01.wnl.0000271090.28148.24 [DOI] [PubMed] [Google Scholar]
- 44.US Department of Health and Human Services . National plan to address Alzheimer’s disease: 2019 update. Published October 18, 2019. Accessed August 5, 2019. https://aspe.hhs.gov/report/national-plan-address-alzheimers-disease-2019-update
Associated Data
This section collects any data citations, data availability statements, or supplementary materials included in this article.
Supplementary Materials
eMethods 1. Description of Algorithms
eMethods 2. Summary of Predictors in Dementia-Prediction Models
eTable 1. Relative Prevalence of Dementia Across Non-Hispanic Black and White Americans in the United States, 2000-2016
eTable 2. Relative Incidence of Dementia Across Non-Hispanic Black and White Americans in the United States, 2000-2016