Abstract
Iron oxide nanoparticles have attracted much attention because of their superparamagnetic properties and their potential applications in many fields such as magnetic storage devices, catalysis, sensors, superparamagnetic relaxometry (SPMR), and high‐sensitivity biomolecule magnetic resonance imaging (MRI) for medical diagnosis and therapeutics. In this study, iron oxide nanoparticles (Fe2O3 NPs) have been synthesized using a taranjabin (camelthorn or persian manna) aqueous solution. The synthesized Fe2O3 NPs were identified through powder X‐ray diffraction (PXRD), X‐ray photoelectron spectroscopy (XPS), Fourier transform infrared spectroscopy (FT‐IR), field energy scanning electron microscopy (FESEM), transmission electron microscopy (TEM), energy‐dispersive spectroscopy (EDX), vibrating‐sample magnetometer (VSM) and Raman technics. The results show that the nanoparticles have a hexagonal structure with 20 to 60 nm in size. The cytotoxic effect of the synthesized nanoparticles has been tested upon application against lung cancer cell (A549) lines. It was found that there is no cytotoxic activity at lower concentrations of 200 μg/mL. The ability of the synthesized nanoparticles for lead removal in wastewaters was tested. Results show that highest concentration of adsorbent (50 mg/L) has maximum removal efficiency (96.73 %). So, synthesized Fe2O3 NPs can be a good candidate to use as heavy metals cleaner from contaminated waters.
Keywords: cytotoxic effects, iron oxide nanoparticles, lead removal, superparamagnetic effects, manna derivatives
Iron oxide nanoparticles have been synthesized using persian manna in aqueous solution. The nanoparticles have been tested for cytotoxic activity and for their lead removal properties in wastewaters.
1. Introduction
Nanoparticles are widely used in chemical, medical, pharmaceutical, electronic and agricultural industries because of their unique properties. [1] Nanoparticles generally categorize into two groups including organic and inorganic nanoparticles. One of the important classes of inorganic nanoparticles is magnetic nanoparticles. [2] Recently, producing nanoparticles significantly progress and new safe biosynthesize methods have been developed as an alternative to conventional techniques.[ 3 , 4 , 5 ]
Since 1900, the ability of plant extract to reduce metal ions was known. Although, nature of involved reducing agent and its mechanism is not well known; but due to simplicity of using plants metabolites to reduce metal ions widely developed, this method get great attraction by researchers′ over the past 12 years. [6] The synthesis plant‐mediated nanoparticles seem to be due to the existence of biomolecules, such as proteins, polysaccharides, polyphenols, terpenoids and etc. [7] All of these compounds are electronic donor and they are considered as suitable agents for reducing metal ions. [8]
Iron oxide is widely distributed in nature and it uses as catalysts, pigments, design of various sensors, remove heavy metals from contaminated water, anti‐bacteria, drug delivery and treatment of cancers. It has various oxidation modes including magahmatit (γ‐Fe2O3), hematite (α‐Fe2O3), magnetite (Fe3O4) and geotite (FeOOH).[ 9 , 10 ]
One of the important environmental problems in worldwide is water pollution by heavy metals. In order to meet stringent environmental requirements have been developed a range of technologies such as chemical deposition, coagulation and flocculation, electrochemical purification, ion exchange, membrane processes and adsorption to remove heavy metals from wastewaters. Based on studies, three methods including ion exchange, adsorption and membrane processes was studied more than other conventional processes for the eliminating heavy metals from wastewater. [11]
Lead is a heavy metal widely used in industries such as robotics, printing, paint, fuel, photography and military application. So, it considers as a sustainable environmental pollutant. [12] Physical membrane filtration, coagulation, and adsorption, chemical sequential neutralization with aid of lime and sodium carbonate and biological methods was already designed for removing lead of lead‐contaminated effluents. [11] Iron oxide nanoparticles is special matter for wastewater treatment, accelerating effluent coagulation, removing radioactive nucleotides, absorbing organic dyes, clearing contaminated soils and removing resistant compounds such as benzene. There are many studies that reported removing lead and other contaminants by iron oxide nanoparticles. [13]
Nanoparticle synthesis by using plant extract is a rapid, inexpensive, and non‐toxic method.[ 14 , 15 , 16 , 17 , 18 , 19 ] Hedysarum or taranjabin manna, as an herbal product, is a sweet substance that sits on Alhagi maurorum. It contains melitose, fructose, sucrose, tannin, alkaloid, oxalic acid and tartaric acid. [20] The sugar compounds in taranjabin are rich in electrons and can act as a reducing agent. Therefore, in the process of oxidation‐reduction of metal ions, these compounds, as reducing agents, by giving electrons to iron ions can reduces them, and finally convert into nanoparticles. Each plant can produce the same nanoparticles in nature but different in morphology and size. Each plant can produce the same nanoparticle in terms of nature but different in morphology and size. For first time in this study, we attempt to synthesis iron oxide nanoparticles using aqueous solution of taranjabin and survey cytotoxic activity of synthesized nanoparticles on lung cancer cell lines (A549) and also their capability to eliminating lead from aqueous solution.
Experimental Section
Synthesis of Iron Oxide Nanoparticles
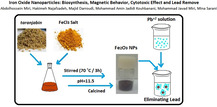
In brief, 1 gr of taranjabin powder was weighted and 50 ml of distilled water was added to it. Finally, the mixture was filtered by using filter paper Whatman No. 1. Filtrate was slowly added to Fe (III) chloride solution (1 M), and stirred in 70 °C for 3 h. Afterwards, the pH of solution was raised to 11.5. Resulting brown solution was dried at 110 °C. The resulting powder at 400 (S1), 500 (S2), 600 (S3) and 700 (S4) °C were calcined in furnace for 2 h, separately. Iron oxide nanoparticles were obtained as brown powder. Schematic diagram of the synthesis of nanoparticles are shown in Figure 1.
Figure 1.
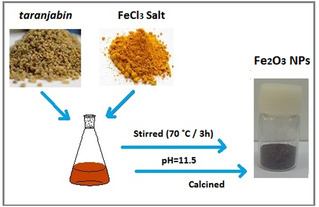
Schematic diagram of the iron oxide nanoparticles.
Lead Elimination
The solution of lead (II) nitrate in 10, 20, 30, 40 and 50 mg/L dilutions was prepared. Then 0.01 gr of iron oxide nanoparticles was added to each dilution. pH was adjusted by using NaOH solution (0.1 mM) and HCl solution (0.1 mM). Mixture was shaken at 150 rpm for 60 min. then mixture was filtered by using filter paper of Whatman No. 1, and absorbance of filtrate was read through atomic absorption spectroscopy.
Characterization
Synthesized Fe2O3 NPs were identified through Powder X‐ray Diffraction (PXRD, DAD4 Advance‐Bruker model, Netherlands), Fourier Transform Infrared spectroscopy (FT‐IR, Bruker Tensor27), Raman (Takram P50C0R10 model in 532 nm leaser wave length), and Field Energy Scanning Electron Microscopy (FESEM, TESCAN model of MIRA3) devises.
Cytotoxic Effect
The in vitro cytotoxicity of the synthesized nanoparticles was tested on lung cancer cell line (A549) using MTT colorimetric assay. In short, a certain number of cells (104) were aliquot onto each well of a 96‐well microplate and incubated in a humidified atmosphere of 5 % CO2, 95 % air at 37 °C to reach about 70–90 % confluence. Afterwards, 150 μL of nanoparticles which previously was incubated at 37 °C in serum containing media for 24 h was added to each well. After 24 h incubation, the medium was removed and the wells were washed twice for 2–3 min with 150 μL of the phosphate buffer saline. Then, 25 μL of the MTT (3‐(4,5 Dimethylthiazole‐2‐yl)‐2,5‐diphenyl tetrazolium, Sigma‐Aldrich, USA) stock solution was transfer into each well and incubated in a humidified atmosphere of 5 % CO2, 95 % air for 4 h at 37 °C. In this stage, Tetrazolium ring was created by selectively cleavage of mitochondrial dehydrogenases of viable cells, producing blue/purple formazan crystals. In order to dissolve the formazan, 100 μL of DMSO was added to each well. The absorption of the solution (OD) was read at a wavelength of 570 nm by an Elisa plate reader (Model 50, Bio‐Rad Corp, Hercules, CA). All experiments were performed in triplicate.
2. Results and Discussion
One of the most commercial nanoparticles is iron oxide. The PXRD is the most efficient tools for materials analysis. The PXRD analysis results and its output patterns reveal particles nature and size. PXRD pattern of synthesized iron oxide nanoparticles using aqueous solution of taranjabin was showed in Figure 2. Maghemite (γ‐Fe2O3) forms at 400 °C, but hematite (α‐Fe2O3) creates in other temperature. PXRD pattern of S1 includes (220), (311), (400), (422), (511) and (440) lines that indicate formation of maghemite nanoparticles, [21] but S2, S3 and S4 shows (104), (110), (113), (024), (116), (112), (214) and (300) lines that indicate formation of hematite nanoparticles. [22] Wide width lines in X‐ray spectra, especially for calcined samples at low temperatures; indicate formation of nanosizeing samples (Figure 2).
Figure 2.
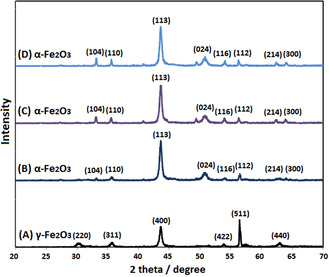
PXRD patterns of synthesized S1, S2, S3 and S4 using aqueous solution of taranjabin at (A) 400 °C, (B) 500 °C, (C) 600 °C and (D) 700 °C, respectively.
Results showed that by decreasing width of peaks increases particle size. Also, with increase sintering temperature increases nuclear movement and reduce surface energy in which increase particle size. [23] The nanoparticles size was calculated using Debye‐Scherrer equation (D=0.89λ/βcosθ; where D: crystal size of particle, λ: X‐ray wavelength used in the test, β: Full width at half maximum in radians, θ: Angle of diffraction). [19] The particle size of S1, S2, S3 and S4 samples was estimated 27, 43, 78 and 86 nm, respectively.
The morphology and size of synthesized iron oxide nanoparticles by using taranjabin aqueous solution were determined through FESEM imaging (Figure 3A). The FESEM image showed that the structure of nanoparticles is hexagonal with 20 to 60 nm in size. The wide dispersion of nanoparticles is due to the diversity of reducing and stabilizing properties of taranjabin ingredient. In addition, iron oxide nanoparticles tend to aggregates in the range of 100 to 600 nm. Comparing tendency to aggregation between chemical synthesized method and green synthesized way show the polyphenols in plant extract act as covering agents; this is in agreement with the results obtained by Sharaf [24] and Heydarzadeh. [25] The TEM image of S2 sample shown in figure 3B. This image well showed that the particles have about 20 to 60 nm sizes. The results of TEM confirm PXRD and FESEM. Composition of synthesized iron oxide nanoparticles was determined through EDX. The EDX graph of iron oxide nanoparticles is shown in Figure 3C, which demonstrates peaks of Fe and O elements.
Figure 3.
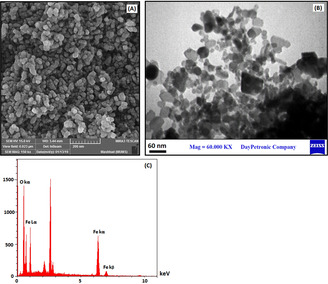
(A) SEM image, (B) TEM image and (C) EDX graph of synthesized S2 using aqueous solution of taranjabin.
Figure 4 shows XPS spectrum of synthesized iron oxide nanoparticles by using taranjabin aqueous solution. The spectrum shows the presence of Fe and O elements. A peak at 711.5 eV is attributed to Fe 2p1/2 and the peak at 725.1 eV is attributed to Fe 2p3/2. The shake‐up satellite line implies Fe+3 in Fe2O3. A peak observed in 532 eV is related to the oxygen is in structure of iron oxide nanoparticles and to the presence of hydroxyl groups in the sample. [26]
Figure 4.
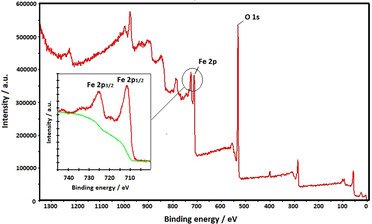
XPS spectrum of of synthesized S2 using aqueous solution of taranjabin.
FT‐IR and Raman spectra of sample confirm the presence of Fe2O3 NPs. The FT‐IR spectra of taranjabin and synthesized Fe2O3 NPs were investigated in range 400–4000 (Figure 5). As shown in Figure 5A, peak in the range 3378, 1635 and 1242 cm−1 indicted to OH groups of alcohols and phenols, C=O and C−O stretching vibration, respectively. The peak at 2939 cm−1 is due to CH2 antisymmetric stretch. The peaks in the region between 1118 and 864 cm−1 contains functional groups mainly from carbohydrate.
Figure 5.
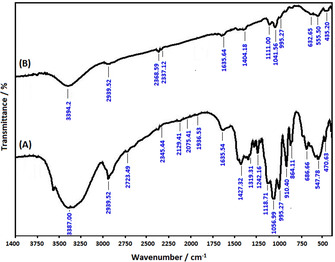
FT‐IR spectra of (A) taranjabin and (B) synthesized S2 using aqueous solution of taranjabin.
FT‐IR spectrum of S2 nanoparticles shows in Figure 5B. Absorption band in the range of 3394 cm−1 showed strong stretching vibration of generated hydrogen bond by OH groups. The absorption band in the range of 1635 cm−1 is related to adsorb H2O by groups on nanoparticle surface. The absorption band in the range of 555 and 435 cm−1 is related to vibrational band of O−Fe−O and Fe−O, respectively. In this spectrum, the peak in the range 600 cm −1 split into two peaks including 555 and 435 cm−1. It seems that this detachment is due to detachment of quantized energy levels of magnetic nanoparticles.
The Raman spectrum of synthesized Fe2O3 NPs using taranjabin aqueous solution is shown in Figure 6. Raman spectrum of Fe2O3 NPs shows 217, 286, 404, 657, 1318 and 1607 cm−1 bands, that are compatible with its previous reports. [27] The bands of 217 and 404 cm −1 are corresponding to phonon A1g and Eg modes, respectively. The peak of 657 cm−1 is related to the presence of iron oxide nanocrystals. Whereas, observed peak at 1318 cm−1 is assigned to scattering of two phonons of iron oxide. The presence of these peaks confirms calcination of Fe2O3 NPs. [28]
Figure 6.
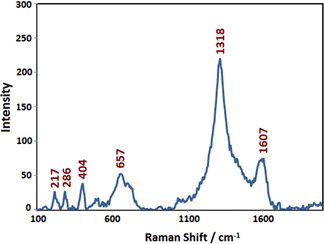
Raman spectrum of synthesized S2 using aqueous solution of taranjabin.
The magnetic properties of the synthesized nanoparticles were investigated by using VSM technique (Figure 7). S1 is maghemite nanoparticles and S2, S3 and S4 are hematite nanoparticles. Ms of S1 is 1.2 emu/g, and Ms of S2, S3 and S4 are 12.0, 2.0 and 1.2 emu/g, respectively. With increasing temperature, magnetic properties of hematite decreases. S2 has very small hysteresis loop but by increasing temperature it increase, which indicates the superparamagnetic behavior for S2. S3 and S4 show weaker magnetic behavior rather than S2. [29] In fact, the paramagnetic materials are a kind of soft magnetic materials. Hence, they magnetize when applies a low intensity of magnetic field on paramagnetic compounds. They easily magnetize and by eliminating magnetic field rapidly lose their magnetic moments. [30] Bepari and his coworkers survey magnetic properties of Fe2O3 NPs. They reported that Ms content of Fe2O3 NPs has a direct relationship with their particle size and particle shape anisotropy. [21]
Figure 7.
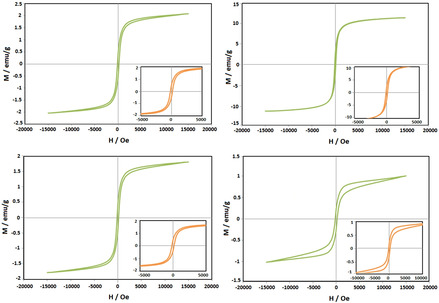
VSM image of synthesized S2 using aqueous solution of taranjabin at (A) 400 °C, (B) 500 °C, (C) 600 °C and (D) 700 °C.
Lead is important pollution in world, so the ability of synthesized Fe2O3 NPs on lead eliminating in its aqueous solution was studied. The lead concentration was prepared in the range of 10 to 50 mg/L and pH was adjusted between of 6–8. The amount of absorbent was considered 10 and 50 mg/L. Table 1 show the effect of pH and adsorbent dosage on lead adsorption. According to the results, the adsorption of lead by adsorbent was increased with increasing pH. So, pH=8 was considered as optimal pH. Alkaline pH increases the negative charges of solution. So, lead ions with positive charges easily are dispersing in the solution. So, create of strong electrostatic forces between adsorbent surface and lead ion increases the surface absorption of nanoparticles as adsorbent. But at acidic pHs, this phenomena is the opposite. Therefore, pH=8 was considered as the optimal pH.[ 31 , 32 ]
Table 1.
PH and adsorbent dosage effect on lead adsorption.
|
|
Atomic Absorption |
|
|---|---|---|
|
0.01 gr of S2 Concentration |
0.05 gr of S2 Concentration |
|
|
pH=6 |
0.01327±0.002 |
0.01078±0.002 |
|
pH=7 |
0.01302±0.002 |
0.01171±0.0018 |
|
pH=8 |
0.01078±0.0019 |
0.1065±0.002 |
Results show that there are no significant differences between adsorption of the two adsorbents (0.01 and 0.05 g). Therefore, 0.01 g/L adsorbent was selected as optimum concentration. The residual lead concentrations after treatment were calculated by line equation obtained in Figure 8.
Figure 8.
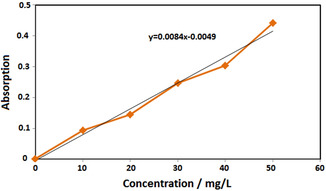
Standard curve of synthesized S2 using aqueous solution of taranjabin at different concentrations of lead.
The removal efficiency was calculated through R=((Ci−Ce)/Ci)×100 equation, which in this equation, Ci is initial concentration of Pb in solution (mg/L), Ce is equilibrium concentration of Pb in solution after adsorption process (mg/L) and R is removal efficiency. [33] Based on results in Table 2, the residual concentration of Pb was significantly decreased compare to its initial concentration (pH=8 and adsorbent content of 0.01 g/L), which reflects the ability of iron oxide nanoparticles to eliminate lead. Increasing concentration of lead increases removal efficiency. As shown in Figure 9, highest concentration of adsorbent (50 mg/L) has maximum elimination efficiency (96.73 %). By increasing initial concentration of lead increased number of lead ions that join to absorption sites. When initial concentration goes above 50 mg/L competition for occupation of adsorption sites increase, so removal efficiency reduces.[ 34 , 35 ] Rajput et al examined the effect of iron nanoparticles on removing heavy metal from water and results showed Fe2O3 NPs is able to remove lead from water. [36]
Table 2.
Effect of initial lead concentration on elimination efficiency at pH=8.
|
Initial Concentration (mg/L) |
10 |
20 |
30 |
40 |
50 |
|
Remaining Concentration (mg/L) |
0.6 |
1.126 |
1.45 |
1.83 |
1.637 |
|
Elimination efficiency (%) |
94 |
94.37 |
95.16 |
95.43 |
96.73 |
Figure 9.
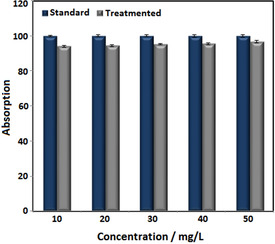
Effect of synthesized S2 on elimination of lead from aqueous solution at pH=8.
The cytotoxic activity of synthesized nanoparticles studied on A549 cancer cell lines using MTT assay. The (3‐(4,5‐dimethylthiazol‐2‐yl)‐2,5‐diphenyltetrazolium bromide or MTT assay, as an indicator of cell viability and cytotoxicity, was measured cellular metabolic activity in treated cell mitochondria.[ 37 , 38 ] This assay was performed in 0–200 μg/mL of nanoparticles concentrations at 24 h of treatment time (Figure 10). The results showed that cytotoxic effect of S2 sample depended on size and concentration of nanoparticles. Results show that there is no cytotoxic activity at concentrations lower than 200 μg/mL for synthesized nanoparticles. The factors such as chemical composition, cell type substrate coating are affected on cytotoxic of S2 sample.[ 39 , 40 ] Khan et al., investigated iron oxide nanoparticles toxicity on lung cancer cells and they stated that ROS lead to necrosis and cell death. [41] Ankamwar et al. investigated on several cell lines, they reported that toxicity is dependent on nanoparticle concentration and no cytotoxic effect was observed in concentrations lower than 100 μg/mL. [42] The higher concentrations of nanoparticles lead interaction between phospholipids of cellular membrane and iron nanoparticles resulting in case failure in the membrane.[ 39 , 40 ] Therefore, synthesized nanoparticles can be used in biomedical products.
Figure 10.
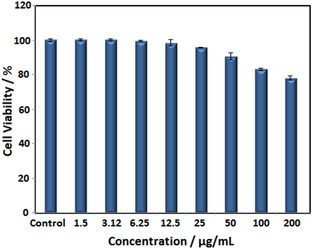
Cytotoxic activity of synthesized S2 on A549 cancer cell line at 24 h of incubation time.
3. Conclusions
In this study, biosynthesis of Fe2O3 NPs was done for the first time by using taranjabin solution. Results clearly demonstrate that taranjabin aqueous solution is able to stability and reduction of nanoparticles. According to the results synthesis of iron oxide nanoparticles by taranjabin is a fast reaction nanoparticles produces in a short time. The particle size of synthesized nanoparticles was in the range of 20–60 nm. The cytotoxicity of synthesized nanoparticles shows no toxicity against A549 cell lines. The lead removal ability of synthesized nanoparticles was studied in aqueous medium of lead. Results show that synthesized nanoparticles have excellent ability to clear lead contaminants. Therefore, synthesized Fe2O3 NPs can be a good candidate to use as heavy metals cleaner from contaminated waters.
Compliance with Ethical Standards
Ethical approval
In this research was studied cytotoxic activity of Iron oxide nanoparticles (Fe2O3 NPs) against lung (A549) cell line. The cytotoxic activity of synthesized nanoparticles was performed through MTT assay. The lung (A549) cell line was purchased from Pasteur Institute of Iran.
Conflict of interest
The authors declare no conflict of interest.
A. Miri, H. Najafzadeh, M. Darroudi, M. J. Miri, M. A. J. Kouhbanani, M. Sarani, ChemistryOpen 2021, 10, 327.
References
- 1. Song J. Y., Kim B. S., Bioprocess Biosyst. Eng. 2009, 32, 79. [DOI] [PubMed] [Google Scholar]
- 2. Singh M., Manikandan S., Kumaraguru A., Res J. Nanosci. Nanotechn. 2011, 1, 1–11. [Google Scholar]
- 3. Amin M., Kouhbanani J., Beheshtkhoo N., Nasirmoghadas P., Yazdanpanah S., Zomorodian K., Taghizadeh S., Amani A., J. Environ. Treat. Tech. 2019, 7(3), 461–466. [Google Scholar]
- 4. Kouhbanani M. A. J., Beheshtkhoo N., Fotoohiardakani G., Hosseini-Nave H., Taghizadeh S., Amani A. M., J. Environ. Treat. Tech. 2019, 7, 142–149. [Google Scholar]
- 5. Lohrasbi S., Kouhbanani M. A. J., Beheshtkhoo N., Ghasemi Y., Amani A. M., Taghizadeh S., BioNanoSci. 2019, 9, 317–322. [Google Scholar]
- 6. Frame F. A., Osterloh F. E., J. Phys. Chem. C 2010, 114, 10628–10633. [Google Scholar]
- 7. Hanauer M., Pierrat S., Zins I., Lotz A., Sönnichsen C., Nano Lett. 2007, 7, 2881–2885. [DOI] [PubMed] [Google Scholar]
- 8. Hao J.-Y., Han W., Xue B.-Y., Deng X., Sep. Purif. Technol. 2002, 28, 191–196. [Google Scholar]
- 9. Mahmoudi M., Sant S., Wang B., Laurent S., Sen T., Adv. Drug Delivery Rev. 2011, 63, 24–46. [DOI] [PubMed] [Google Scholar]
- 10. Kouhbanani M. A. J., Beheshtkhoo N., Taghizadeh S., Amani A. M., Alimardani V., ANSN. 2019, 10, 015007. [Google Scholar]
- 11. Samadi M., Nourozi R., Azizian S., Dadban Shahamat Y., Zarabi M., Iran. J. Health Environ. 2009, 2, 224–231. [Google Scholar]
- 12. Tchounwou P. B., Yedjou C. G., Patlolla A. K., Sutton D. J., Mol. Clin. Environ. Toxicol. 2012, 101, 133–164. [DOI] [PMC free article] [PubMed] [Google Scholar]
- 13. Mehrasbi M., Iran. J. Health Environ. 2008, 1, 57–66. [Google Scholar]
- 14. Miri A., Vahed H. O. S., Sarani M., Res. Chem. Intermed. 2018, 44, 6907–6915. [Google Scholar]
- 15. Miri A., Khatami M., Sarani M., J. Inorg. Organomet. Polym. Mater. 2019, 1–8. [Google Scholar]
- 16. Miri A., Sarani M., BioNanoSci. 2019, 9, 164–171. [Google Scholar]
- 17. Miri A., Mahdinejad N., Ebrahimy O., Khatami M., Sarani M., Mater. Sci. Eng. C 2019, 104, 109981. [DOI] [PubMed] [Google Scholar]
- 18. Khatami M., Sarani M., Mosazadeh F., Rajabalipour M., Izadi A., Abdollahpour-Alitappeh M., Lima Nobre M. A., Borhani F., Molecules. 2019, 24, 4424. [DOI] [PMC free article] [PubMed] [Google Scholar]
- 19. Miri A., Darroudi M., Sarani M., Appl. Organomet. Chem. 2020, e5308. [Google Scholar]
- 20. Yazdanparats S., Ziarati P., Asgarpanah J., Biosci. Biotechnol. Res. Asia, 2014, 11, 1025–1029. [Google Scholar]
- 21. Bepari R. A., Bharali P., Das B. K., J. Saudi Chem. Soc. 2017, 21, S170-S178. [Google Scholar]
- 22. Valášková M., Tokarský J., Pavlovský J., Prostějovský T., Kočí K., Materials. 2019, 12, 1880. [DOI] [PMC free article] [PubMed] [Google Scholar]
- 23. Wang T., Lin J., Chen Z., Megharaj M., Naidu R., J. Cleaner Prod. 2014, 83, 413–419. [Google Scholar]
- 24. Sharaf M., El-Ansari M., Saleh N., Fitoterapia. 1999, 70, 478–483. [Google Scholar]
- 25. Heydarzadeh S., Yaghoubi H., Razi. J. Med. Sci. 2017, 24, 15. [Google Scholar]
- 26. Mirzaei A., Janghorban K., Hashemi B., Hosseini S. R., Bonyani M., Leonardi S. G., Bonavita A., Neri G., Proce. Appl. Ceram. 2016, 10, 209–217. [Google Scholar]
- 27. Soler M. A., Qu F., Raman Spectrosc.Nanomater. Character. 2012, 379–416. [Google Scholar]
- 28. Testa-Anta M., Ramos-Docampo M. A., Comesaña-Hermo M., Rivas-Murias B., Salgueiriño V., Nanoscale Adv. 2019, 1, 2086–2103. [DOI] [PMC free article] [PubMed] [Google Scholar]
- 29. Wang J., Shao X., Zhang Q., Tian G., Ji X., Bao W., J. Mol. Liq. 2017, 248, 13–18. [Google Scholar]
- 30. Estelrich J., Escribano E., Queralt J., Busquets M. A., Int. J. Mol. Sci. 2015, 16, 8070–8101. [DOI] [PMC free article] [PubMed] [Google Scholar]
- 31. Shen Y., Zhao X., Zhang X., Li S., Liu D., Fan L., Korean J. Chem. Eng., 2016, 33, 159–169. [Google Scholar]
- 32. Yu C., Wang M., Dong X., Shi Z., Zhang X., Lin Q., RSC Adv., 2017, 7, 53135. [Google Scholar]
- 33. Bhatia M., Satish Babu R., Sonawane S. H., Gogate P. R., Girdhar A., Reddy E. R., Pola M., Int. J. Environ. Sci. Technol. 2017, 14, 1135–1154. [Google Scholar]
- 34. Irani M., Amjadi M., Mousavian M. A., Chem. Eng. J. 2011, 178, 317–323. [Google Scholar]
- 35. Nassar N. N., J. Hazard. Mater. 2010, 184, 538–546. [DOI] [PubMed] [Google Scholar]
- 36. Rajput S., Singh L. P., Pittman C. U. Jr, Mohan D., J. Colloid Interface Sci. 2017, 492, 176–190. [DOI] [PubMed] [Google Scholar]
- 37. Slater T. F., Sawyer B., Sträuli U., Biochim. Biophys. Acta 1963, 77, 383–393. [DOI] [PubMed] [Google Scholar]
- 38. Vistica D. T., Skehan P., Scudiero D., Monks A., Pittman A., Boyd M. R., Cancer Res. 1991, 51, 2515–2520. [PubMed] [Google Scholar]
- 39. Berry C. C., Wells S., Charles S., Aitchison G., Curtis A. S., Biomaterials. 2004, 25, 5405–5413. [DOI] [PubMed] [Google Scholar]
- 40. Berry C. C., Wells S., Charles S., Curtis A. S., Biomaterials. 2003, 24, 4551–4557. [DOI] [PubMed] [Google Scholar]
- 41. Khan M. I., Mohammad A., Patil G., Naqvi S. A. H., Chauhan L. K. S., Ahmad I., Biomaterials. 2012, 33, 1477–1488. [DOI] [PubMed] [Google Scholar]
- 42. Ankamwar B., Lai T. C., Huang J. H., Liu R. S., Hsiao M., Chen C. H., Hwu Y. K., Nanotechnology. 2010, 21,75102. [DOI] [PubMed] [Google Scholar]


